Gold Coast neighborhood in Alameda, California (CA), 94501 detailed profile
Settings
X


Business Search - 14 Million verified businesses
Area: 0.161 square miles
Population: 1,953
Population density:
| Gold Coast: | 12,097 people per square mile |
| Alameda: | 7,044 people per square mile |

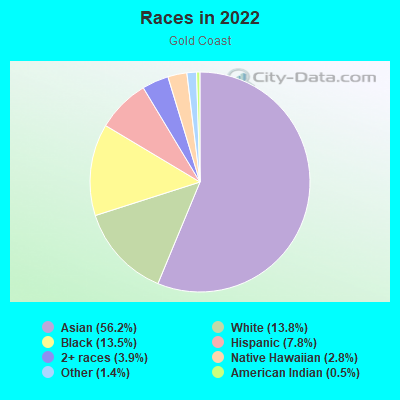
- 1,08654.1%White
- 31815.8%Asian
- 28214.0%Two or more races
- 1869.3%Hispanic or Latino
- 1045.2%Black
- 180.9%American Indian
- 80.4%Some other race
- 70.3%Native Hawaiian and Other
Pacific Islander
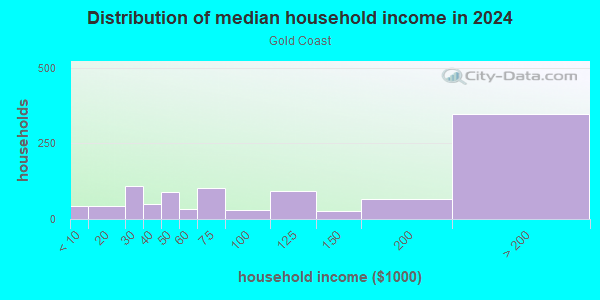
Distribution of median household income
![Distribution of median household income]()
- 13Less than $10,000
- 27$10,000 to $19,999
- 165$20,000 to $29,999
- 60$30,000 to $39,999
- 93$40,000 to $49,999
- 45$50,000 to $59,999
- 32$60,000 to $74,999
- 72$75,000 to $99,999
- 81$100,000 to $124,999
- 19$125,000 to $149,999
- 81$150,000 to $199,999
- 327$200,000 or more
Distribution of owner-occupied house/condo value
![Distribution of owner-occupied house/condo value]()
- 1$100,000 to $149,999
- 5$200,000 to $249,999
- 2$300,000 to $399,999
- 20$400,000 to $499,999
- 56$500,000 to $749,999
- 37$750,000 to $999,999
- 409$1,000,000 or more

Distribution of rent paid by renters
![Distribution of rent paid by renters]()
- 9Less than $100
- 1$100 to $199
- 40$200 to $299
- 171$300 to $399
- 3$400 to $499
- 40$700 to $799
- 7$800 to $899
- 19$900 to $999
- 18$1,000 to $1,249
- 56$1,250 to $1,499
- 99$1,500 to $1,999
- 147$2,000 or more
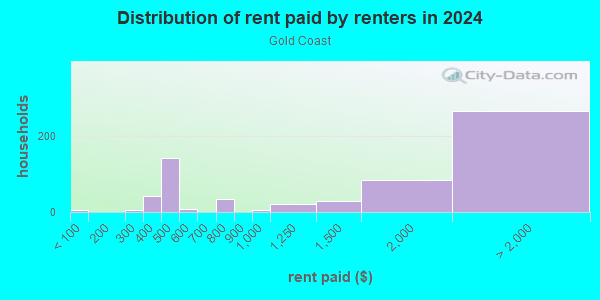
Median rent in 2022:
| Gold Coast: | $1,853 |
| Alameda: | $2,001 |
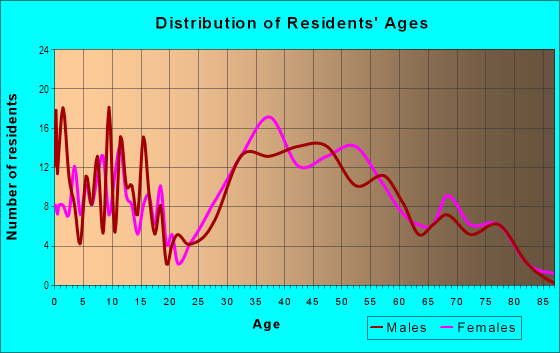
| Males: | 1,047 |
| Females: | 905 |
Males:
| This neighborhood: | 38.6 years |
| Whole city: | 40.2 years |
| This neighborhood: | 45.0 years |
| Whole city: | 41.8 years |
Average household size:
| Gold Coast: | 6.1 people |
| Alameda: | 2.7 people |
Percentage of family households:
| Gold Coast: | 51.1% |
| Alameda: | 45.6% |
| Here: | 52.3% |
| Alameda: | 52.5% |
Percentage of married-couple families with children (among all households):
| Gold Coast: | 29.7% |
| Alameda: | 29.2% |
Percentage of single-mother households (among all households):
| Gold Coast: | 9.5% |
| Alameda: | 5.9% |
Percentage of never married males 15 years old and over:
Percentage of never married females 15 years old and over:
| Gold Coast: | 22.2% |
| Alameda: | 14.3% |
Percentage of never married females 15 years old and over:
| Gold Coast: | 14.1% |
| city: | 17.4% |
Percentage of people that speak English not well or not at all:
| Gold Coast: | 0.6% |
| Alameda: | 4.7% |
Percentage of people born in this state:
Percentage of people born in another U.S. state:
Percentage of native residents but born outside the U.S.:
Percentage of foreign born residents:
| Here: | 51.6% |
| Alameda: | 50.2% |
Percentage of people born in another U.S. state:
| Gold Coast: | 23.8% |
| Alameda: | 19.2% |
Percentage of native residents but born outside the U.S.:
| Here: | 4.1% |
| city: | 2.3% |
Percentage of foreign born residents:
| Here: | 20.5% |
| Alameda: | 28.4% |
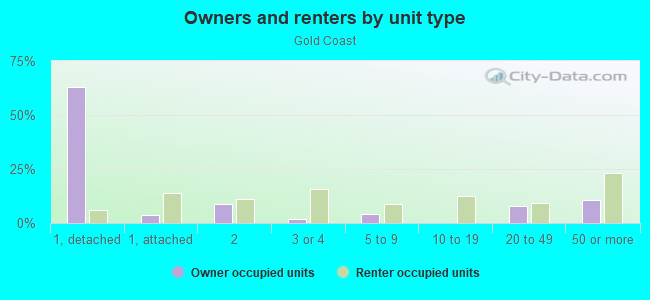
Owner-occupied
Renter-occupied

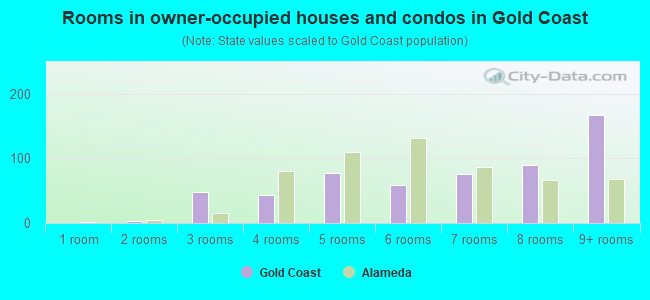
- Rooms in owner-occupied houses and condos in Gold Coast
- 01 room
- 32 rooms
- 483 rooms
- 434 rooms
- 785 rooms
- 596 rooms
- 757 rooms
- 898 rooms
- 1679+ rooms
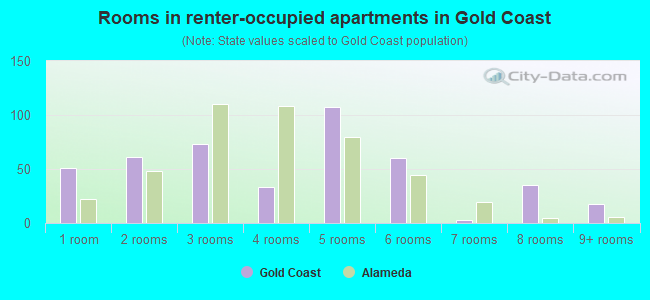
- Rooms in renter-occupied apartments in Gold Coast
- 511 room
- 612 rooms
- 733 rooms
- 334 rooms
- 1075 rooms
- 606 rooms
- 37 rooms
- 358 rooms
- 189+ rooms
Owner-occupied
Renter-occupied
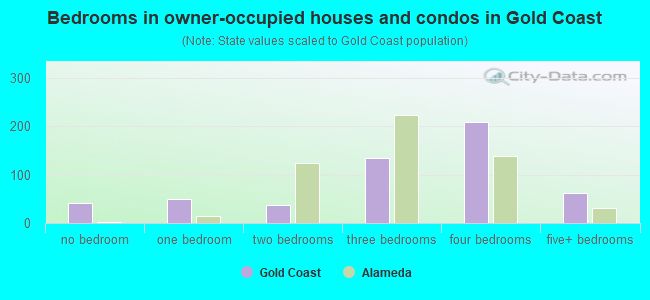
- Bedrooms in owner-occupied houses and condos in Gold Coast
- 42no bedroom
- 501 bedroom
- 372 bedrooms
- 1343 bedrooms
- 2094 bedrooms
- 625+ bedrooms
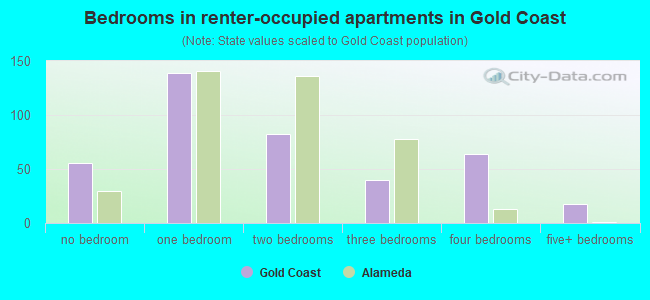
- Bedrooms in renter-occupied apartments in Gold Coast
- 56no bedroom
- 1391 bedroom
- 822 bedrooms
- 403 bedrooms
- 644 bedrooms
- 185+ bedrooms
Average number of cars or other vehicles available in houses/condos:
Average number of cars or other vehicles available in apartments:
| This neighborhood: | 2.4 |
| Alameda: | 2.0 |
Average number of cars or other vehicles available in apartments:
| Here: | 1.6 |
| city: | 1.4 |
Percentage of units with a mortgage:
| Gold Coast: | 61.3% |
| Alameda: | 68.4% |
Average estimated value of detached houses in 2022 (60.3% of all units):
| Gold Coast: | $1,662,286 |
| California: | $988,808 |
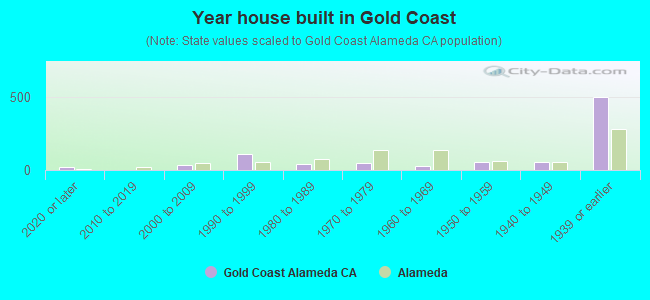
- Year house built in Gold Coast
- 202020 or later
- 02010 to 2019
- 332000 to 2009
- 1071990 to 1999
- 391980 to 1989
- 461970 to 1979
- 311960 to 1969
- 531950 to 1959
- 551940 to 1949
- 5011939 or earlier
City-data.com crime index for city in 2020 (higher means more crime):
| City: | 236.5 |
| U.S. average: | 219.5 |
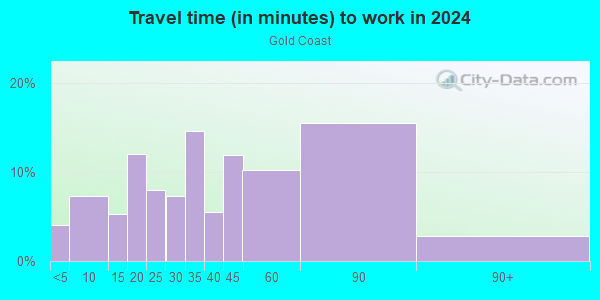
Travel time to work (commute)
![Travel time to work (commute)]()
- 30Less than 5 minutes
- 475 to 9 minutes
- 4410 to 14 minutes
- 9015 to 19 minutes
- 7120 to 24 minutes
- 5925 to 29 minutes
- 8730 to 34 minutes
- 1935 to 39 minutes
- 10340 to 44 minutes
- 8845 to 59 minutes
- 9860 to 89 minutes
- 4890 or more minutes
Means of transportation to work
![Means of transportation to work]()
- 39.6%419Drove a car alone
- 12.0%127Carpooled
- 5.2%55Bus
- 3.3%35Subway or elevated rail
- 12.1%128Light rail, streetcar or trolley
- 10.2%108Ferryboat
- 2.3%24Taxi
- 2.8%30Bicycle
- 3.7%39Walked
- 0.1%1Other means
- 35.2%372Worked at home

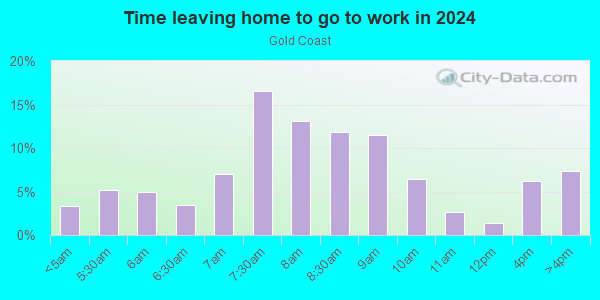
Time leaving home to go to work
![Time leaving home to go to work]()
- 3312:00 a.m. to 4:59 a.m.
- 125:00 a.m. to 5:29 a.m.
- 455:30 a.m. to 5:59 a.m.
- 516:00 a.m. to 6:29 a.m.
- 586:30 a.m. to 6:59 a.m.
- 1167:00 a.m. to 7:29 a.m.
- 1357:30 a.m. to 7:59 a.m.
- 938:00 a.m. to 8:29 a.m.
- 628:30 a.m. to 8:59 a.m.
- 159:00 a.m. to 9:59 a.m.
- 2410:00 a.m. to 10:59 a.m.
- 1111:00 a.m. to 11:59 a.m.
- 4412:00 p.m. to 3:59 p.m.
- 524:00 p.m. to 11:59 p.m.
Occupations of males:
- Percentage of males in management occupations (except farmers):
Here: 27.5% city: 17.8%
- Percentage of males in business and financial operations occupations:
Here: 5.3% city: 7.3%
- Percentage of males in computer and mathematical occupations:
Here: 4.3% city: 9.1%
- Percentage of males in architecture and engineering occupations:
Here: 10.1% city: 6.4%
- Percentage of males in legal occupations:
Here: 5.3% city: 2.9%
- Percentage of males in education, training, and library occupations:
Here: 3.0% city: 4.8%
- Percentage of males in arts, design, entertainment, sports, and media occupations:
Here: 8.6% city: 5.3%
- Percentage of males in service occupations:
Here: 2.6% city: 9.9%
- Percentage of males in sales and office occupations:
Here: 18.1% city: 14.7%
- Percentage of males in construction, extraction, and maintenance occupations:
Here: 3.0% city: 2.1%
- Percentage of males in transportation occupations:
Here: 7.2% city: 5.8%
- Percentage of males in material moving occupations:
Here: 3.1% city: 2.3%
Occupations of females:
- Percentage of females in management occupations (except farmers):
Here: 11.9% city: 14.4%
- Percentage of females in business and financial operations occupations:
Here: 15.4% city: 10.6%
- Percentage of females in computer and mathematical occupations:
Here: 9.3% city: 3.7%
- Percentage of females in life, physical, and social science occupations:
Here: 7.9% city: 3.2%
- Percentage of females in legal occupations:
Here: 3.1% city: 2.5%
- Percentage of females in education, training, and library occupations:
Here: 15.2% city: 8.3%
- Percentage of females in arts, design, entertainment, sports, and media occupations:
Here: 1.6% city: 4.9%
- Percentage of females in healthcare practitioners and technical occupations:
Here: 8.1% city: 8.9%
- Percentage of females in service occupations:
Here: 11.7% city: 13.8%
- Percentage of females in sales and office occupations:
Here: 11.6% city: 20.0%
- Percentage of females in production occupations:
Here: 1.9% city: 2.2%
- Percentage of females in material moving occupations:
Here: 2.1% city: 1.3%
Percentage of people 16-64 in Armed Forces:
| Gold Coast: | 0.1% |
| Alameda: | 1.1% |
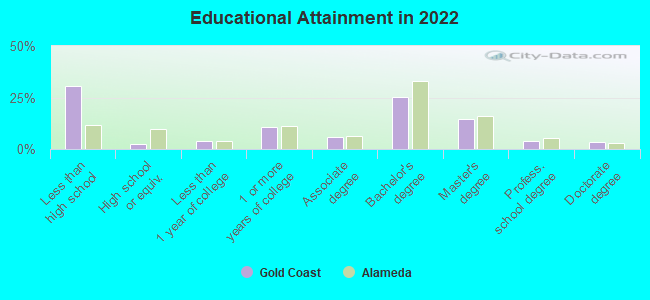
Education in this neighborhood (subdivision or community):
- Percentage of people 3 years and older in K-12 schools:
Gold Coast: 13.2% Alameda: 16.7%
- Percentage of people 3 years and older in undergraduate colleges:
Gold Coast: 8.0% Alameda: 5.5%
- Percentage of people 3 years and older in grad. or professional schools:
Gold Coast: 4.9% Alameda: 3.4%
- Percentage of students K-12 enrolled in private schools:
Gold Coast: 38.9% Alameda: 12.4%
Percentage of population below poverty level:
| Gold Coast: | 6.6% |
| Alameda: | 9.3% |
Median year renter moved in (as recorded in 2022):
| Gold Coast: | 2016 |
| Alameda: | 2019 |
Percentage of married-couple families with both working:
| Gold Coast: | 71.2% |
| Alameda: | 80.1% |
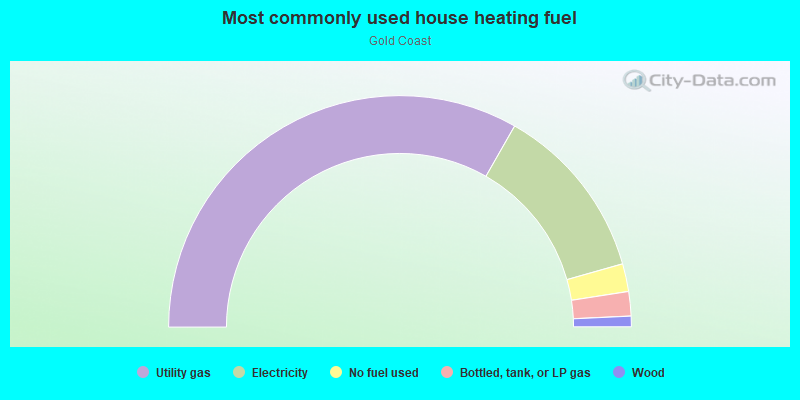
- 66.5%Utility gas
- 24.7%Electricity
- 3.9%No fuel used
- 3.4%Bottled, tank, or LP gas
- 1.5%Wood
Roads and streets:
Central Ave
Length: 0.90 miles
Direction: E-W
Address range: 823 to 1199
Direction: E-W
Address range: 823 to 1199
San Antonio Ave
Length: 0.63 miles
Direction: E-W
Address range: 800 to 1399
Direction: E-W
Address range: 800 to 1399
Bay St
Length: 0.35 miles
Direction: N-S
Address range: 1100 to 1403
Direction: N-S
Address range: 1100 to 1403
St Charles St
Length: 0.30 miles
Direction: N-S
Address range: 1100 to 1403
Direction: N-S
Address range: 1100 to 1403
Sherman St
Length: 0.25 miles
Direction: N-S
Address range: 1000 to 1299
Direction: N-S
Address range: 1000 to 1299
Caroline St
Length: 0.23 miles
Direction: N-S
Address range: 1200 to 1403
Direction: N-S
Address range: 1200 to 1403
Morton St
Length: 0.22 miles
Direction: N-S
Address range: 800 to 1403
Direction: N-S
Address range: 800 to 1403
Weber St
Length: 0.20 miles
Direction: N-S
Address range: 1200 to 1399
Direction: N-S
Address range: 1200 to 1399
9th St
Length: 0.17 miles
Direction: N-S
Address range: 962 to 1403
Direction: N-S
Address range: 962 to 1403
Burbank St
Length: 0.16 miles
Direction: N-S
Address range: 1300 to 1399
Direction: N-S
Address range: 1300 to 1399
Fair Oaks Ave
Length: 0.15 miles
Direction: E-W
Address range: 1000 to 1099
Direction: E-W
Address range: 1000 to 1099
Hawthorne St
Length: 0.13 miles
Direction: N-S
Address range: 1200 to 1299
Direction: N-S
Address range: 1200 to 1299
Centennial Ave
Length: 0.11 miles
Direction: E-W
Address range: 800 to 999
Direction: E-W
Address range: 800 to 999
Portola Ave
Length: 0.05 miles
Directions: E-W, SE-NW
Address range: 824 to 899
Directions: E-W, SE-NW
Address range: 824 to 899