Government Services District neighborhood in Durham, North Carolina (NC), 27701 detailed profile
Settings
X


Business Search - 14 Million verified businesses
Area: 0.202 square miles
Population: 1,061
Population density:
| Government Services District: | 5,245 people per square mile |
| Durham: | 3,084 people per square mile |

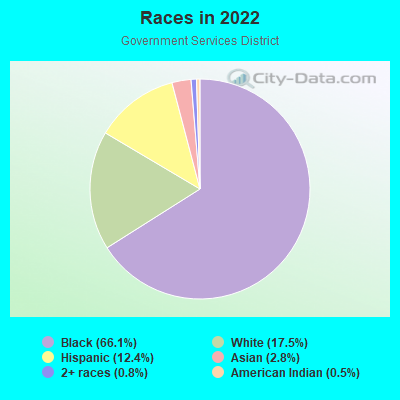
- 69966.1%Black
- 18517.5%White
- 13112.4%Hispanic or Latino
- 302.8%Asian
- 80.8%Two or more races
- 50.5%American Indian
Median household income in 2022:
| Government Services District: | $28,235 |
| Durham: | $78,105 |
Distribution of median household income
![Distribution of median household income]()
- 43Less than $10,000
- 148$10,000 to $19,999
- 35$20,000 to $29,999
- 62$30,000 to $39,999
- 32$40,000 to $49,999
- 4$50,000 to $59,999
- 26$60,000 to $74,999
- 20$75,000 to $99,999
- 40$100,000 to $124,999
- 8$150,000 to $199,999
- 8$200,000 or more

Distribution of owner-occupied house/condo value
![Distribution of owner-occupied house/condo value]()
- 14Less than $50,000
- 10$50,000 to $99,999
- 26$100,000 to $149,999
- 3$150,000 to $199,999
- 19$200,000 to $249,999
- 25$250,000 to $299,999
- 8$300,000 to $399,999
- 11$400,000 to $499,999
- 6$500,000 to $749,999

Distribution of rent paid by renters
![Distribution of rent paid by renters]()
- 14$100 to $199
- 51$200 to $299
- 24$300 to $399
- 60$400 to $499
- 25$500 to $599
- 74$600 to $699
- 26$700 to $799
- 30$800 to $899
- 19$900 to $999
- 20$1,000 to $1,249
- 19$1,250 to $1,499
- 6$1,500 to $1,999
- 16$2,000 or more

Median rent in 2022:
| Government Services District: | $609 |
| Durham: | $1,246 |
| Males: | 555 |
| Females: | 505 |
Males:
| This neighborhood: | 53.1 years |
| Whole city: | 34.3 years |
| This neighborhood: | 33.4 years |
| Whole city: | 35.8 years |
Average household size:
| Government Services District: | 27.0 people |
| Durham: | 2.3 people |
Percentage of family households:
| Government Services District: | 37.8% |
| Durham: | 41.2% |
| Here: | 21.8% |
| Durham: | 36.4% |
Percentage of married-couple families with children (among all households):
| Government Services District: | 14.7% |
| Durham: | 27.1% |
Percentage of single-mother households (among all households):
| Government Services District: | 21.7% |
| Durham: | 12.7% |
Percentage of never married males 15 years old and over:
Percentage of never married females 15 years old and over:
| Government Services District: | 29.1% |
| Durham: | 20.9% |
Percentage of never married females 15 years old and over:
| Government Services District: | 19.9% |
| city: | 23.2% |
Percentage of people that speak English not well or not at all:
| Government Services District: | 4.2% |
| Durham: | 4.9% |
Percentage of people born in this state:
Percentage of people born in another U.S. state:
Percentage of native residents but born outside the U.S.:
Percentage of foreign born residents:
| Here: | 61.1% |
| Durham: | 45.4% |
Percentage of people born in another U.S. state:
| Government Services District: | 25.6% |
| Durham: | 38.2% |
Percentage of native residents but born outside the U.S.:
| Here: | 0.6% |
| city: | 1.6% |
Percentage of foreign born residents:
| Here: | 12.8% |
| Durham: | 14.8% |
Owner-occupied
Renter-occupied

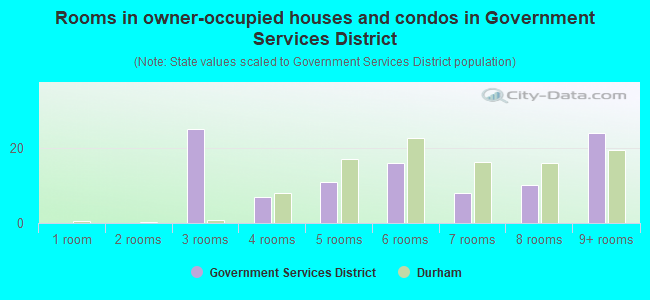
- Rooms in owner-occupied houses and condos in Government Services District
- 01 room
- 02 rooms
- 253 rooms
- 74 rooms
- 115 rooms
- 166 rooms
- 87 rooms
- 108 rooms
- 249+ rooms
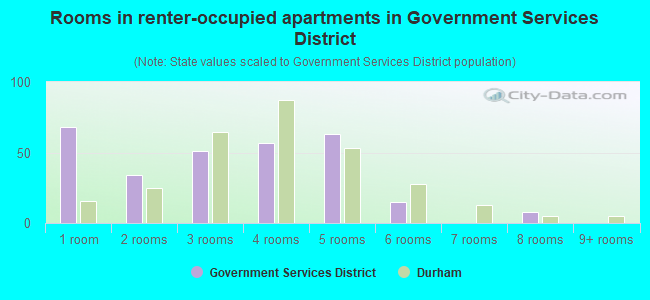
- Rooms in renter-occupied apartments in Government Services District
- 681 room
- 342 rooms
- 513 rooms
- 574 rooms
- 635 rooms
- 156 rooms
- 07 rooms
- 88 rooms
- 09+ rooms
Owner-occupied
Renter-occupied
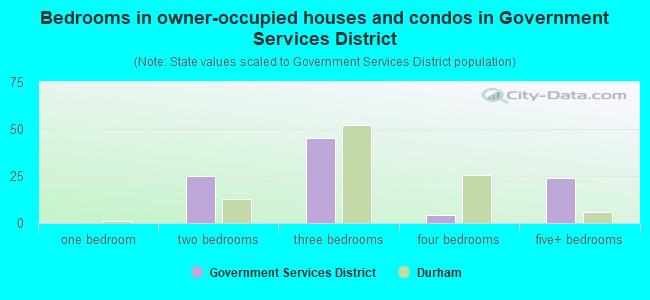
- Bedrooms in owner-occupied houses and condos in Government Services District
- 0no bedroom
- 01 bedroom
- 252 bedrooms
- 453 bedrooms
- 44 bedrooms
- 245+ bedrooms
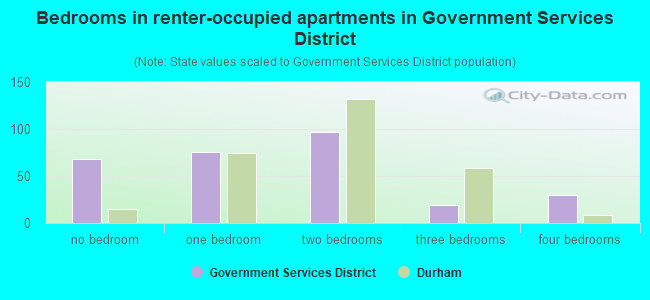
- Bedrooms in renter-occupied apartments in Government Services District
- 68no bedroom
- 761 bedroom
- 972 bedrooms
- 193 bedrooms
- 304 bedrooms
- 05+ bedrooms
Average number of cars or other vehicles available in houses/condos:
Average number of cars or other vehicles available in apartments:
| This neighborhood: | 1.9 |
| Durham: | 1.9 |
Average number of cars or other vehicles available in apartments:
| Here: | 0.5 |
| city: | 1.3 |
Percentage of units with a mortgage:
| Government Services District: | 88.3% |
| Durham: | 74.8% |
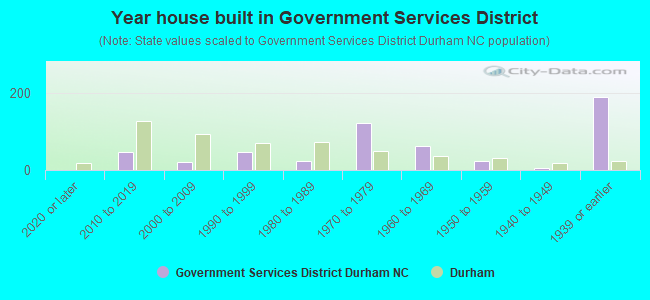
- Year house built in Government Services District
- 02020 or later
- 472010 to 2019
- 212000 to 2009
- 471990 to 1999
- 221980 to 1989
- 1221970 to 1979
- 621960 to 1969
- 241950 to 1959
- 51940 to 1949
- 1881939 or earlier
City-data.com crime index for city in 2020 (higher means more crime):
| City: | 425.9 |
| U.S. average: | 219.5 |
Travel time to work (commute)
![Travel time to work (commute)]()
- 395 to 9 minutes
- 3010 to 14 minutes
- 4615 to 19 minutes
- 8320 to 24 minutes
- 1425 to 29 minutes
- 8430 to 34 minutes
- 335 to 39 minutes
- 4040 to 44 minutes
- 745 to 59 minutes
- 2560 to 89 minutes

Means of transportation to work
![Means of transportation to work]()
- 54.0%203Drove a car alone
- 19.4%73Carpooled
- 2.4%9Bus
- 9.6%36Taxi
- 3.2%12Walked
- 0.8%3Other means
- 10.4%39Worked at home

Time leaving home to go to work
![Time leaving home to go to work]()
- 515:00 a.m. to 5:29 a.m.
- 666:00 a.m. to 6:29 a.m.
- 246:30 a.m. to 6:59 a.m.
- 907:00 a.m. to 7:29 a.m.
- 137:30 a.m. to 7:59 a.m.
- 418:00 a.m. to 8:29 a.m.
- 158:30 a.m. to 8:59 a.m.
- 199:00 a.m. to 9:59 a.m.
- 810:00 a.m. to 10:59 a.m.
- 911:00 a.m. to 11:59 a.m.
- 3012:00 p.m. to 3:59 p.m.
- 44:00 p.m. to 11:59 p.m.

Occupations of males:
- Percentage of males in management occupations (except farmers):
Here: 3.8% city: 13.6%
- Percentage of males in life, physical, and social science occupations:
Here: 2.6% city: 2.7%
- Percentage of males in legal occupations:
Here: 1.4% city: 1.1%
- Percentage of males in education, training, and library occupations:
Here: 7.6% city: 6.0%
- Percentage of males in healthcare practitioners and technical occupations:
Here: 2.7% city: 5.3%
- Percentage of males in service occupations:
Here: 22.0% city: 13.7%
- Percentage of males in sales and office occupations:
Here: 12.5% city: 12.9%
- Percentage of males in construction, extraction, and maintenance occupations:
Here: 30.7% city: 8.8%
- Percentage of males in production occupations:
Here: 8.3% city: 3.9%
- Percentage of males in transportation occupations:
Here: 3.4% city: 3.3%
- Percentage of males in material moving occupations:
Here: 11.7% city: 4.1%
Occupations of females:
- Percentage of females in management occupations (except farmers):
Here: 10.6% city: 11.0%
- Percentage of females in computer and mathematical occupations:
Here: 5.5% city: 2.8%
- Percentage of females in life, physical, and social science occupations:
Here: 4.9% city: 4.4%
- Percentage of females in community and social services occupations:
Here: 2.1% city: 3.3%
- Percentage of females in legal occupations:
Here: 7.3% city: 1.2%
- Percentage of females in education, training, and library occupations:
Here: 12.2% city: 11.8%
- Percentage of females in arts, design, entertainment, sports, and media occupations:
Here: 1.9% city: 2.1%
- Percentage of females in healthcare practitioners and technical occupations:
Here: 16.3% city: 13.6%
- Percentage of females in service occupations:
Here: 14.7% city: 16.8%
- Percentage of females in sales and office occupations:
Here: 31.8% city: 19.6%
- Percentage of females in production occupations:
Here: 11.0% city: 1.9%
- Percentage of females in material moving occupations:
Here: 6.9% city: 1.3%
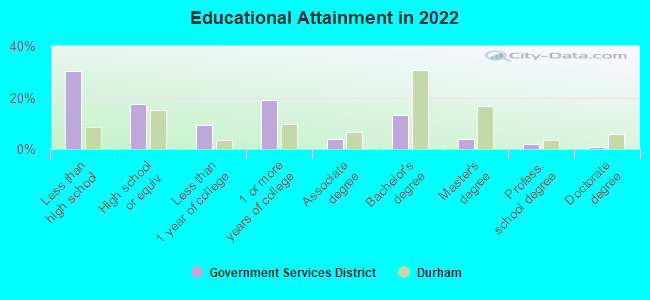
Education in this neighborhood (subdivision or community):
- Percentage of people 3 years and older in K-12 schools:
Government Services District: 16.5% Durham: 14.4%
- Percentage of people 3 years and older in undergraduate colleges:
Government Services District: 0.1% Durham: 5.8%
- Percentage of people 3 years and older in grad. or professional schools:
Government Services District: 0.6% Durham: 4.6%
- Percentage of students K-12 enrolled in private schools:
Government Services District: 0.0% Durham: 16.9%
Percentage of population below poverty level:
| Government Services District: | 32.4% |
| Durham: | 11.2% |
Median year owner moved in (as recorded in 2022):
Median year renter moved in (as recorded in 2022):
| Government Services District: | 2016 |
| Durham: | 2013 |
Median year renter moved in (as recorded in 2022):
| Government Services District: | 2017 |
| Durham: | 2020 |
Percentage of married-couple families with both working:
| Government Services District: | 100.0% |
| Durham: | 68.9% |
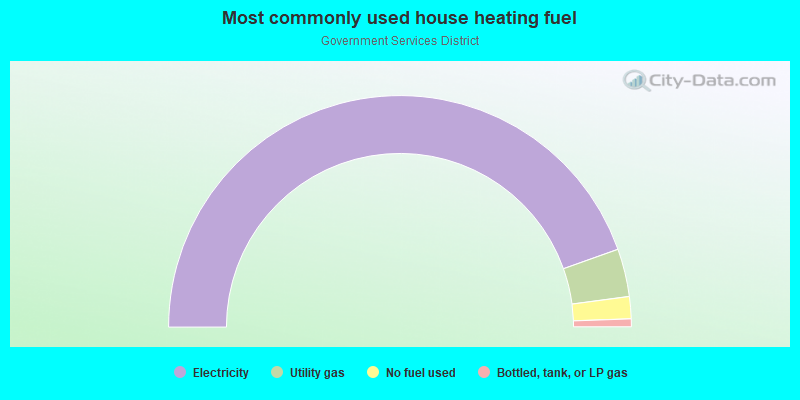
- 89.1%Electricity
- 6.7%Utility gas
- 3.1%No fuel used
- 1.1%Bottled, tank, or LP gas
Limited-access highways (interstate or state) in this neighborhood:
State Hwy 147 (Durham Fwy)
Length: 0.31 miles
Directions: E-W, SE-NW
Directions: E-W, SE-NW
Highways in this neighborhood:
Roxboro Rd (US Hwy 15 Bus, US Hwy 501 Bus)
Length: 0.51 miles
Direction: SW-NE
Address range: 100 to 399
Direction: SW-NE
Address range: 100 to 399
US Hwy 70 (State Hwy 98, Holloway St)
Length: 0.21 miles
Directions: E-W, SE-NW, SW-NE
Address range: 192 to 399
Directions: E-W, SE-NW, SW-NE
Address range: 192 to 399
E Morgan St (US Hwy 70, State Hwy 98)
Length: 0.07 miles
Directions: N-S, SE-NW
Address range: 200 to 299
Directions: N-S, SE-NW
Address range: 200 to 299
Roads and streets:
Liberty St
Length: 0.47 miles
Directions: N-S, SE-NW
Address range: 100 to 498
Directions: N-S, SE-NW
Address range: 100 to 498
E Pettigrew St
Length: 0.39 miles
Directions: N-S, SE-NW, SW-NE
Address range: 300 to 599
Directions: N-S, SE-NW, SW-NE
Address range: 300 to 599
Downtown Loop (Ramseur St)
Length: 0.35 miles
Direction: SE-NW
Address range: 300 to 499
Direction: SE-NW
Address range: 300 to 499
E Main St
Length: 0.30 miles
Direction: SE-NW
Address range: 200 to 499
Direction: SE-NW
Address range: 200 to 499
E Dillard St
Length: 0.21 miles
Directions: E-W, SE-NW
Address range: 250 to 299
Directions: E-W, SE-NW
Address range: 250 to 299
W Pettigrew St
Length: 0.20 miles
Direction: SE-NW
Direction: SE-NW
N Queen St
Length: 0.18 miles
Directions: N-S, SW-NE
Address range: 100 to 499
Directions: N-S, SW-NE
Address range: 100 to 499
S Dillard St
Length: 0.18 miles
Direction: SW-NE
Address range: 100 to 399
Direction: SW-NE
Address range: 100 to 399
Jackie Robinson Dr
Length: 0.17 miles
Directions: E-W, SE-NW
Address range: 400 to 499
Directions: E-W, SE-NW
Address range: 400 to 499
E Peabody St
Length: 0.15 miles
Directions: E-W, SE-NW, SW-NE
Directions: E-W, SE-NW, SW-NE
Cleveland St
Length: 0.15 miles
Directions: E-W, SW-NE
Address range: 300 to 599
Directions: E-W, SW-NE
Address range: 300 to 599
N Svc Rd E
Length: 0.15 miles
Direction: E-W
Address range: 200 to 399
Direction: E-W
Address range: 200 to 399
N Church St
Length: 0.12 miles
Directions: E-W, SW-NE
Address range: 100 to 299
Directions: E-W, SW-NE
Address range: 100 to 299
N Dillard St
Length: 0.10 miles
Direction: SW-NE
Address range: 100 to 199
Direction: SW-NE
Address range: 100 to 199
E Parrish St
Length: 0.09 miles
Direction: SE-NW
Address range: 200 to 299
Direction: SE-NW
Address range: 200 to 299
S Queen St
Length: 0.08 miles
Direction: SW-NE
Address range: 100 to 199
Direction: SW-NE
Address range: 100 to 199
State Rd 1118 (Fayetteville Rd)
Length: 0.05 miles
Direction: SW-NE
Direction: SW-NE
Railroad features:
Southern Rlwy
Length: 0.21 miles
Direction: SE-NW
Direction: SE-NW