Grant Wood neighborhood in Cedar Rapids, Iowa (IA), 52402 detailed profile
Settings
X


Business Search - 14 Million verified businesses
Area: 0.241 square miles
Population: 1,305
Population density:
| Grant Wood: | 5,418 people per square mile |
| Cedar Rapids: | 2,161 people per square mile |

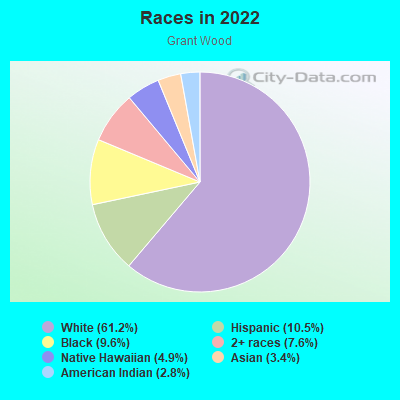
- 88061.2%White
- 15110.5%Hispanic or Latino
- 1389.6%Black
- 1097.6%Two or more races
- 704.9%Native Hawaiian and Other
Pacific Islander - 493.4%Asian
- 402.8%American Indian

Median household income in 2022:
| Grant Wood: | $61,802 |
| Cedar Rapids: | $64,435 |
Distribution of median household income
![Distribution of median household income]()
- 49Less than $10,000
- 68$10,000 to $19,999
- 116$20,000 to $29,999
- 89$30,000 to $39,999
- 73$40,000 to $49,999
- 47$50,000 to $59,999
- 22$60,000 to $74,999
- 32$75,000 to $99,999
- 28$100,000 to $124,999
- 27$125,000 to $149,999
- 14$150,000 to $199,999
- 255$200,000 or more

Distribution of owner-occupied house/condo value
![Distribution of owner-occupied house/condo value]()
- 30Less than $50,000
- 124$50,000 to $99,999
- 125$100,000 to $149,999
- 48$150,000 to $199,999
- 75$200,000 to $249,999
- 143$250,000 to $299,999
- 128$300,000 to $399,999
- 6$400,000 to $499,999
- 21$500,000 to $749,999

Distribution of rent paid by renters
![Distribution of rent paid by renters]()
- 82$200 to $299
- 4$300 to $399
- 87$400 to $499
- 176$500 to $599
- 62$600 to $699
- 56$700 to $799
- 9$800 to $899
- 15$900 to $999
- 29$1,000 to $1,249
- 3$1,250 to $1,499
- 13$1,500 to $1,999
- 7$2,000 or more

Median rent in 2022:
| Grant Wood: | $645 |
| Cedar Rapids: | $745 |
| Males: | 681 |
| Females: | 623 |
Males:
| This neighborhood: | 34.4 years |
| Whole city: | 39.0 years |
| This neighborhood: | 41.7 years |
| Whole city: | 39.2 years |
Average household size:
| Grant Wood: | 2.1 people |
| Cedar Rapids: | 2.3 people |
Percentage of family households:
| Grant Wood: | 27.5% |
| Cedar Rapids: | 40.6% |
| Here: | 33.1% |
| Cedar Rapids: | 40.3% |
Percentage of married-couple families with children (among all households):
| Grant Wood: | 12.8% |
| Cedar Rapids: | 28.1% |
Percentage of single-mother households (among all households):
| Grant Wood: | 37.0% |
| Cedar Rapids: | 11.2% |
Percentage of never married males 15 years old and over:
Percentage of never married females 15 years old and over:
| Grant Wood: | 24.8% |
| Cedar Rapids: | 19.7% |
Percentage of never married females 15 years old and over:
| Grant Wood: | 28.4% |
| city: | 19.4% |
Percentage of people that speak English not well or not at all:
| Grant Wood: | 0.2% |
| Cedar Rapids: | 1.4% |
Percentage of people born in this state:
Percentage of people born in another U.S. state:
Percentage of native residents but born outside the U.S.:
Percentage of foreign born residents:
| Here: | 57.7% |
| Cedar Rapids: | 69.8% |
Percentage of people born in another U.S. state:
| Grant Wood: | 33.7% |
| Cedar Rapids: | 23.6% |
Percentage of native residents but born outside the U.S.:
| Here: | 2.1% |
| city: | 1.0% |
Percentage of foreign born residents:
| Here: | 6.5% |
| Cedar Rapids: | 5.6% |
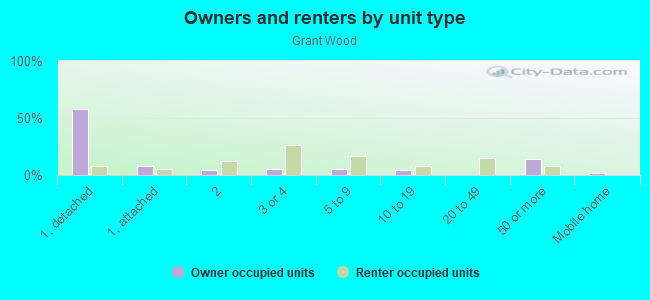
Owner-occupied
Renter-occupied

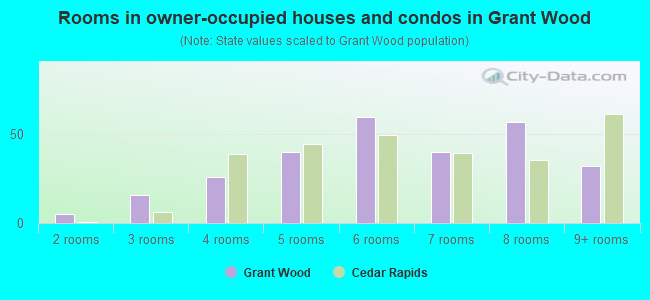
- Rooms in owner-occupied houses and condos in Grant Wood
- 01 room
- 52 rooms
- 163 rooms
- 264 rooms
- 405 rooms
- 606 rooms
- 407 rooms
- 578 rooms
- 329+ rooms
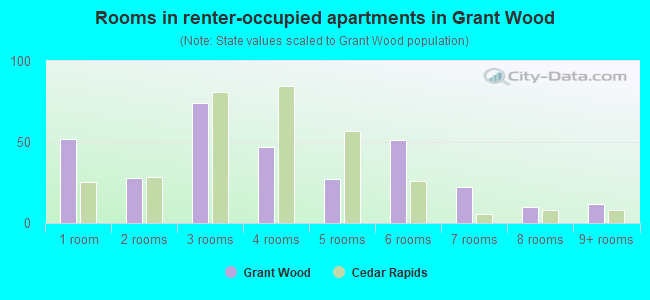
- Rooms in renter-occupied apartments in Grant Wood
- 521 room
- 282 rooms
- 743 rooms
- 474 rooms
- 275 rooms
- 516 rooms
- 227 rooms
- 108 rooms
- 129+ rooms
Owner-occupied
Renter-occupied
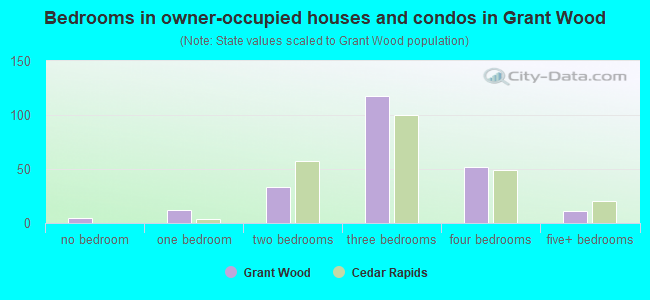
- Bedrooms in owner-occupied houses and condos in Grant Wood
- 5no bedroom
- 121 bedroom
- 332 bedrooms
- 1183 bedrooms
- 524 bedrooms
- 115+ bedrooms
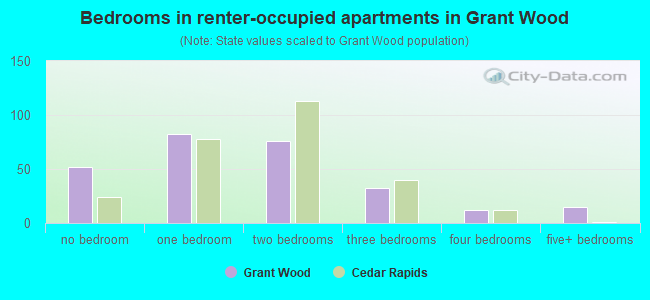
- Bedrooms in renter-occupied apartments in Grant Wood
- 52no bedroom
- 821 bedroom
- 762 bedrooms
- 323 bedrooms
- 124 bedrooms
- 155+ bedrooms
Average number of cars or other vehicles available in houses/condos:
Average number of cars or other vehicles available in apartments:
| This neighborhood: | 2.2 |
| Cedar Rapids: | 2.0 |
Average number of cars or other vehicles available in apartments:
| Here: | 0.9 |
| city: | 1.3 |
Percentage of units with a mortgage:
| Grant Wood: | 73.7% |
| Cedar Rapids: | 61.9% |
Average estimated value of detached houses in 2022 (47.7% of all units):
| Grant Wood: | $122,074 |
| Cedar Rapids: | $213,360 |
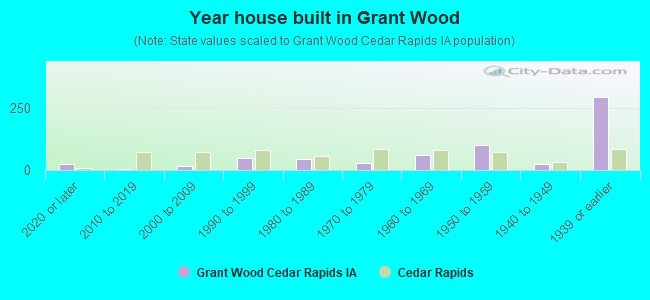
- Year house built in Grant Wood
- 252020 or later
- 32010 to 2019
- 162000 to 2009
- 471990 to 1999
- 461980 to 1989
- 291970 to 1979
- 611960 to 1969
- 1021950 to 1959
- 251940 to 1949
- 2911939 or earlier
City-data.com crime index for city in 2020 (higher means more crime):
| City: | 255.6 |
| U.S. average: | 219.5 |
Travel time to work (commute)
![Travel time to work (commute)]()
- 52Less than 5 minutes
- 1535 to 9 minutes
- 17810 to 14 minutes
- 20215 to 19 minutes
- 6320 to 24 minutes
- 1925 to 29 minutes
- 5730 to 34 minutes
- 235 to 39 minutes
- 1240 to 44 minutes
- 3345 to 59 minutes
- 1360 to 89 minutes
- 290 or more minutes

Means of transportation to work
![Means of transportation to work]()
- 55.7%270Drove a car alone
- 7.8%38Carpooled
- 2.7%13Bus
- 4.1%20Bicycle
- 52.2%253Walked
- 3.3%16Other means
- 10.3%50Worked at home

Time leaving home to go to work
![Time leaving home to go to work]()
- 912:00 a.m. to 4:59 a.m.
- 235:00 a.m. to 5:29 a.m.
- 125:30 a.m. to 5:59 a.m.
- 686:00 a.m. to 6:29 a.m.
- 666:30 a.m. to 6:59 a.m.
- 757:00 a.m. to 7:29 a.m.
- 1057:30 a.m. to 7:59 a.m.
- 1028:00 a.m. to 8:29 a.m.
- 448:30 a.m. to 8:59 a.m.
- 1079:00 a.m. to 9:59 a.m.
- 1410:00 a.m. to 10:59 a.m.
- 1611:00 a.m. to 11:59 a.m.
- 6912:00 p.m. to 3:59 p.m.
- 694:00 p.m. to 11:59 p.m.

Occupations of males:
- Percentage of males in management occupations (except farmers):
Here: 2.9% city: 9.9%
- Percentage of males in business and financial operations occupations:
Here: 1.8% city: 4.2%
- Percentage of males in computer and mathematical occupations:
Here: 4.3% city: 6.3%
- Percentage of males in community and social services occupations:
Here: 1.4% city: 1.1%
- Percentage of males in education, training, and library occupations:
Here: 3.8% city: 2.2%
- Percentage of males in healthcare practitioners and technical occupations:
Here: 3.6% city: 1.9%
- Percentage of males in service occupations:
Here: 35.4% city: 12.0%
- Percentage of males in sales and office occupations:
Here: 19.8% city: 15.0%
- Percentage of males in construction, extraction, and maintenance occupations:
Here: 5.2% city: 8.1%
- Percentage of males in production occupations:
Here: 8.8% city: 12.0%
- Percentage of males in transportation occupations:
Here: 6.8% city: 5.5%
- Percentage of males in material moving occupations:
Here: 3.5% city: 6.3%
Occupations of females:
- Percentage of females in management occupations (except farmers):
Here: 4.9% city: 8.2%
- Percentage of females in computer and mathematical occupations:
Here: 2.8% city: 1.2%
- Percentage of females in architecture and engineering occupations:
Here: 3.6% city: 1.1%
- Percentage of females in education, training, and library occupations:
Here: 12.0% city: 7.5%
- Percentage of females in arts, design, entertainment, sports, and media occupations:
Here: 1.6% city: 1.5%
- Percentage of females in healthcare practitioners and technical occupations:
Here: 1.7% city: 9.7%
- Percentage of females in service occupations:
Here: 34.2% city: 19.8%
- Percentage of females in sales and office occupations:
Here: 37.0% city: 28.7%
- Percentage of females in production occupations:
Here: 2.9% city: 5.4%
- Percentage of females in transportation occupations:
Here: 1.7% city: 1.0%
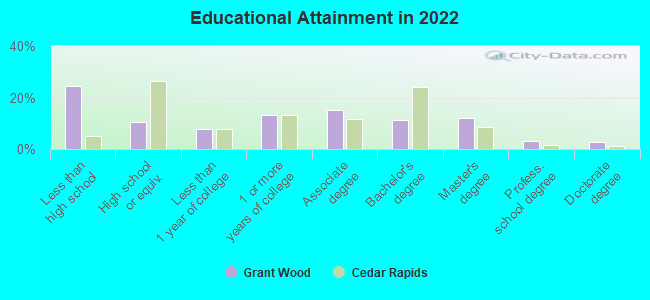
Education in this neighborhood (subdivision or community):
- Percentage of people 3 years and older in K-12 schools:
Grant Wood: 24.1% Cedar Rapids: 15.7%
- Percentage of people 3 years and older in undergraduate colleges:
Grant Wood: 52.1% Cedar Rapids: 5.7%
- Percentage of people 3 years and older in grad. or professional schools:
Grant Wood: 2.9% Cedar Rapids: 0.8%
- Percentage of students K-12 enrolled in private schools:
Grant Wood: 27.2% Cedar Rapids: 12.8%
Percentage of population below poverty level:
| Grant Wood: | 16.0% |
| Cedar Rapids: | 11.4% |
Median year owner moved in (as recorded in 2022):
| Grant Wood: | 2007 |
| Cedar Rapids: | 2012 |
Percentage of married-couple families with both working:
| Grant Wood: | 106.2% |
| Cedar Rapids: | 71.3% |
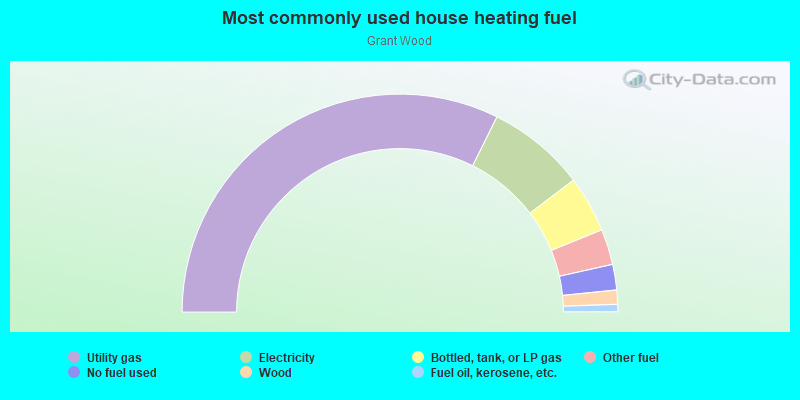
- 64.7%Utility gas
- 14.6%Electricity
- 8.4%Bottled, tank, or LP gas
- 5.3%Other fuel
- 3.8%No fuel used
- 2.1%Wood
- 1.1%Fuel oil, kerosene, etc.
Highways in this neighborhood:
1st Ave E (US Hwy 151 Bus, 1st Ave NE, 1st Ave SE)
Length: 0.77 miles
Direction: SW-NE
Address range: 1400 to 1899
Direction: SW-NE
Address range: 1400 to 1899
Roads and streets:
Length: 0.90 miles
Direction: SW-NE
Address range: 1301 to 1899
Direction: SW-NE
Address range: 1301 to 1899
A Ave NE
Length: 0.77 miles
Direction: SW-NE
Address range: 1400 to 1899
Direction: SW-NE
Address range: 1400 to 1899
D Ave NE
Length: 0.48 miles
Direction: SW-NE
Address range: 1600 to 1899
Direction: SW-NE
Address range: 1600 to 1899
C Ave NE
Length: 0.48 miles
Direction: SW-NE
Address range: 1600 to 1899
Direction: SW-NE
Address range: 1600 to 1899
16th St NE
Length: 0.34 miles
Direction: SE-NW
Address range: 100 to 499
Direction: SE-NW
Address range: 100 to 499
17th St NE
Length: 0.34 miles
Direction: SE-NW
Address range: 100 to 499
Direction: SE-NW
Address range: 100 to 499
19th St NE
Length: 0.33 miles
Direction: SE-NW
Address range: 100 to 499
Direction: SE-NW
Address range: 100 to 499
18th St NE
Length: 0.33 miles
Direction: SE-NW
Address range: 100 to 499
Direction: SE-NW
Address range: 100 to 499
14th St NE
Length: 0.17 miles
Direction: SE-NW
Address range: 100 to 299
Direction: SE-NW
Address range: 100 to 299
15th St NE
Length: 0.17 miles
Direction: SE-NW
Address range: 100 to 299
Direction: SE-NW
Address range: 100 to 299