Green Oaks neighborhood in Lansing, Michigan (MI), 48912 detailed profile
Settings
X


Business Search - 14 Million verified businesses
Area: 0.061 square miles
Population: 581
Population density:
| Green Oaks: | 9,528 people per square mile |
| Lansing: | 3,223 people per square mile |

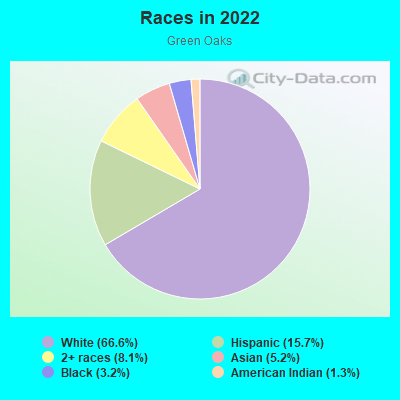
- 41266.6%White
- 9715.7%Hispanic or Latino
- 508.1%Two or more races
- 325.2%Asian
- 203.2%Black
- 81.3%American Indian
Median household income in 2022:
| Green Oaks: | $38,241 |
| Lansing: | $48,962 |
Distribution of median household income
![Distribution of median household income]()
- 18Less than $10,000
- 115$10,000 to $19,999
- 21$20,000 to $29,999
- 48$30,000 to $39,999
- 37$40,000 to $49,999
- 20$50,000 to $59,999
- 34$60,000 to $74,999
- 29$75,000 to $99,999
- 5$100,000 to $124,999
- 5$125,000 to $149,999
- 8$150,000 to $199,999
- 13$200,000 or more

Distribution of owner-occupied house/condo value
![Distribution of owner-occupied house/condo value]()
- 14Less than $50,000
- 56$50,000 to $99,999
- 28$100,000 to $149,999
- 33$150,000 to $199,999
- 6$200,000 to $249,999
- 13$250,000 to $299,999

Distribution of rent paid by renters
![Distribution of rent paid by renters]()
- 2Less than $100
- 22$300 to $399
- 11$400 to $499
- 12$500 to $599
- 42$600 to $699
- 83$700 to $799
- 10$800 to $899
- 11$900 to $999
- 62$1,000 to $1,249
- 9$1,250 to $1,499
- 2$1,500 to $1,999

Median rent in 2022:
| Green Oaks: | $723 |
| Lansing: | $773 |
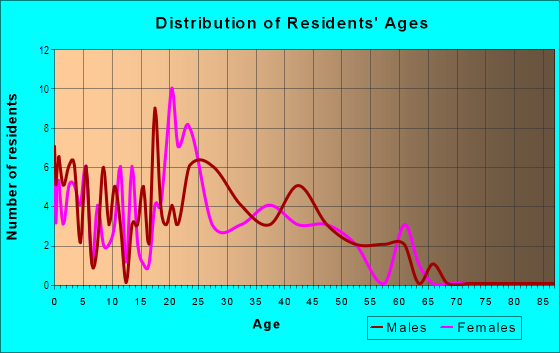
| Males: | 348 |
| Females: | 232 |
Males:
| This neighborhood: | 33.0 years |
| Whole city: | 33.0 years |
| This neighborhood: | 26.4 years |
| Whole city: | 34.5 years |
Average household size:
| Green Oaks: | 1.9 people |
| Lansing: | 2.1 people |
Percentage of family households:
| Green Oaks: | 19.3% |
| Lansing: | 33.9% |
| Here: | 33.9% |
| Lansing: | 27.4% |
Percentage of married-couple families with children (among all households):
| Green Oaks: | 53.9% |
| Lansing: | 23.0% |
Percentage of single-mother households (among all households):
| Green Oaks: | 59.2% |
| Lansing: | 14.1% |
Percentage of never married males 15 years old and over:
Percentage of never married females 15 years old and over:
| Green Oaks: | 20.8% |
| Lansing: | 24.9% |
Percentage of never married females 15 years old and over:
| Green Oaks: | 22.0% |
| city: | 21.6% |
Percentage of people that speak English not well or not at all:
| Green Oaks: | 2.7% |
| Lansing: | 2.3% |
Percentage of people born in this state:
Percentage of people born in another U.S. state:
Percentage of native residents but born outside the U.S.:
Percentage of foreign born residents:
| Here: | 67.9% |
| Lansing: | 72.5% |
Percentage of people born in another U.S. state:
| Green Oaks: | 16.2% |
| Lansing: | 19.1% |
Percentage of native residents but born outside the U.S.:
| Here: | 2.0% |
| city: | 0.8% |
Percentage of foreign born residents:
| Here: | 13.9% |
| Lansing: | 7.6% |
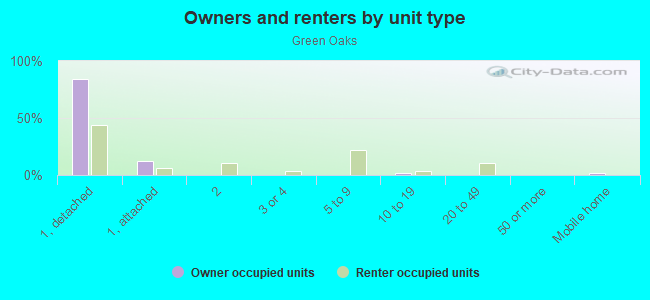
Owner-occupied
Renter-occupied

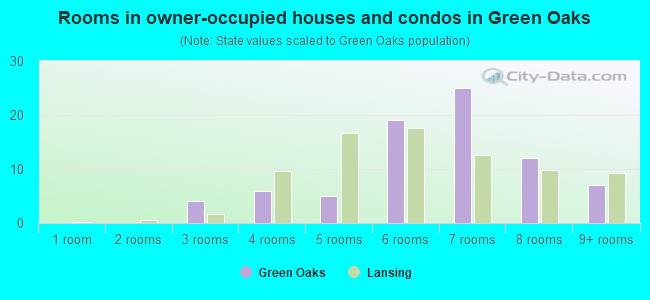
- Rooms in owner-occupied houses and condos in Green Oaks
- 01 room
- 02 rooms
- 43 rooms
- 64 rooms
- 55 rooms
- 196 rooms
- 257 rooms
- 128 rooms
- 79+ rooms
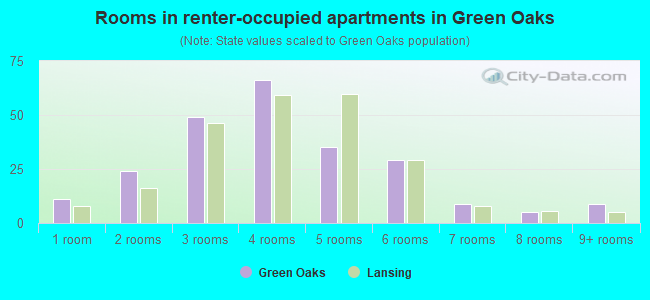
- Rooms in renter-occupied apartments in Green Oaks
- 111 room
- 242 rooms
- 493 rooms
- 664 rooms
- 355 rooms
- 296 rooms
- 97 rooms
- 58 rooms
- 99+ rooms
Owner-occupied
Renter-occupied
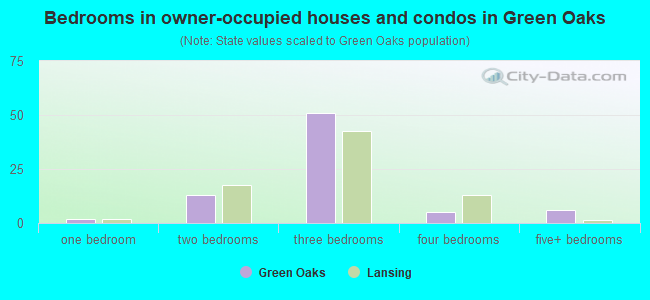
- Bedrooms in owner-occupied houses and condos in Green Oaks
- 0no bedroom
- 21 bedroom
- 132 bedrooms
- 513 bedrooms
- 54 bedrooms
- 65+ bedrooms
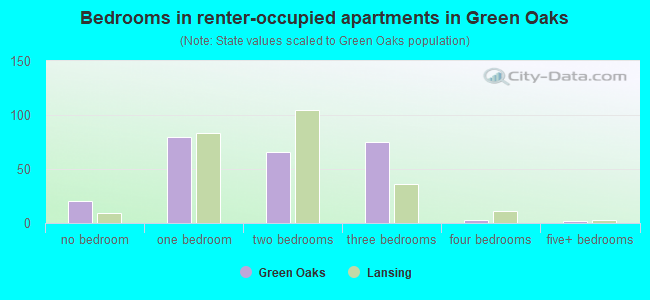
- Bedrooms in renter-occupied apartments in Green Oaks
- 20no bedroom
- 801 bedroom
- 662 bedrooms
- 753 bedrooms
- 34 bedrooms
- 25+ bedrooms
Average number of cars or other vehicles available in houses/condos:
Average number of cars or other vehicles available in apartments:
| This neighborhood: | 1.5 |
| Lansing: | 1.7 |
Average number of cars or other vehicles available in apartments:
| Here: | 1.1 |
| city: | 1.1 |
Percentage of units with a mortgage:
| Green Oaks: | 37.6% |
| Lansing: | 65.6% |
Average estimated value of detached houses in 2022 (54.9% of all units):
| Green Oaks: | $95,467 |
| Lansing: | $121,378 |
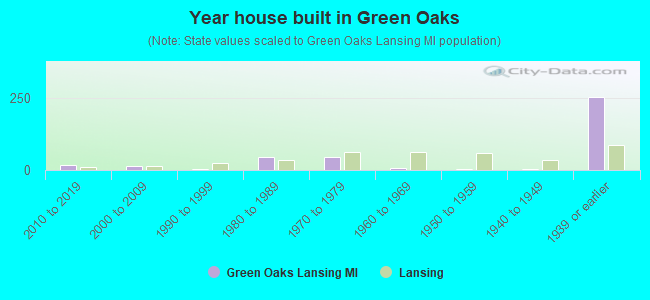
- Year house built in Green Oaks
- 02020 or later
- 192010 to 2019
- 142000 to 2009
- 51990 to 1999
- 451980 to 1989
- 441970 to 1979
- 61960 to 1969
- 51950 to 1959
- 41940 to 1949
- 2521939 or earlier
City-data.com crime index for city in 2020 (higher means more crime):
| City: | 553.0 |
| U.S. average: | 219.5 |
Travel time to work (commute)
![Travel time to work (commute)]()
- 18Less than 5 minutes
- 415 to 9 minutes
- 7110 to 14 minutes
- 7315 to 19 minutes
- 2020 to 24 minutes
- 325 to 29 minutes
- 830 to 34 minutes
- 435 to 39 minutes
- 340 to 44 minutes
- 3460 to 89 minutes
- 590 or more minutes

Means of transportation to work
![Means of transportation to work]()
- 61.5%222Drove a car alone
- 10.8%39Carpooled
- 13.0%47Bus
- 13.0%47Bicycle
- 1.1%4Walked
- 12.5%45Worked at home

Time leaving home to go to work
![Time leaving home to go to work]()
- 2612:00 a.m. to 4:59 a.m.
- 45:00 a.m. to 5:29 a.m.
- 85:30 a.m. to 5:59 a.m.
- 96:00 a.m. to 6:29 a.m.
- 246:30 a.m. to 6:59 a.m.
- 337:00 a.m. to 7:29 a.m.
- 357:30 a.m. to 7:59 a.m.
- 408:00 a.m. to 8:29 a.m.
- 278:30 a.m. to 8:59 a.m.
- 269:00 a.m. to 9:59 a.m.
- 810:00 a.m. to 10:59 a.m.
- 411:00 a.m. to 11:59 a.m.
- 1212:00 p.m. to 3:59 p.m.
- 224:00 p.m. to 11:59 p.m.

Occupations of males:
- Percentage of males in management occupations (except farmers):
Here: 10.1% city: 6.2%
- Percentage of males in business and financial operations occupations:
Here: 10.2% city: 4.1%
- Percentage of males in architecture and engineering occupations:
Here: 3.9% city: 2.5%
- Percentage of males in life, physical, and social science occupations:
Here: 1.5% city: 1.9%
- Percentage of males in community and social services occupations:
Here: 9.9% city: 1.5%
- Percentage of males in education, training, and library occupations:
Here: 11.2% city: 4.9%
- Percentage of males in service occupations:
Here: 3.3% city: 17.2%
- Percentage of males in sales and office occupations:
Here: 22.7% city: 13.3%
- Percentage of males in farming, fishing, and forestry occupations:
Here: 34.2% city: 1.5%
- Percentage of males in production occupations:
Here: 6.2% city: 9.4%
Occupations of females:
- Percentage of females in management occupations (except farmers):
Here: 9.8% city: 6.9%
- Percentage of females in business and financial operations occupations:
Here: 10.0% city: 6.7%
- Percentage of females in computer and mathematical occupations:
Here: 1.3% city: 2.4%
- Percentage of females in community and social services occupations:
Here: 2.2% city: 2.9%
- Percentage of females in education, training, and library occupations:
Here: 11.4% city: 8.7%
- Percentage of females in arts, design, entertainment, sports, and media occupations:
Here: 12.1% city: 1.7%
- Percentage of females in healthcare practitioners and technical occupations:
Here: 25.0% city: 6.7%
- Percentage of females in service occupations:
Here: 18.2% city: 25.0%
- Percentage of females in sales and office occupations:
Here: 23.5% city: 25.9%
- Percentage of females in production occupations:
Here: 3.5% city: 5.6%
- Percentage of females in material moving occupations:
Here: 4.0% city: 2.3%
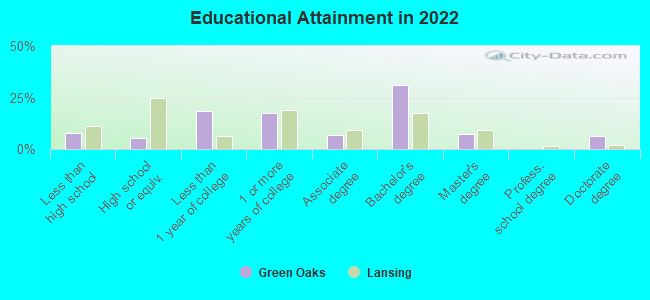
Education in this neighborhood (subdivision or community):
- Percentage of people 3 years and older in K-12 schools:
Green Oaks: 12.8% Lansing: 14.3%
- Percentage of people 3 years and older in undergraduate colleges:
Green Oaks: 5.8% Lansing: 4.6%
- Percentage of people 3 years and older in grad. or professional schools:
Green Oaks: 10.6% Lansing: 2.6%
- Percentage of students K-12 enrolled in private schools:
Green Oaks: 11.3% Lansing: 7.9%
Percentage of population below poverty level:
| Green Oaks: | 19.2% |
| Lansing: | 22.2% |
Median year owner moved in (as recorded in 2022):
Median year renter moved in (as recorded in 2022):
| Green Oaks: | 1996 |
| Lansing: | 2012 |
Median year renter moved in (as recorded in 2022):
| Green Oaks: | 2019 |
| Lansing: | 2020 |
Percentage of married-couple families with both working:
| Green Oaks: | 65.9% |
| Lansing: | 59.6% |
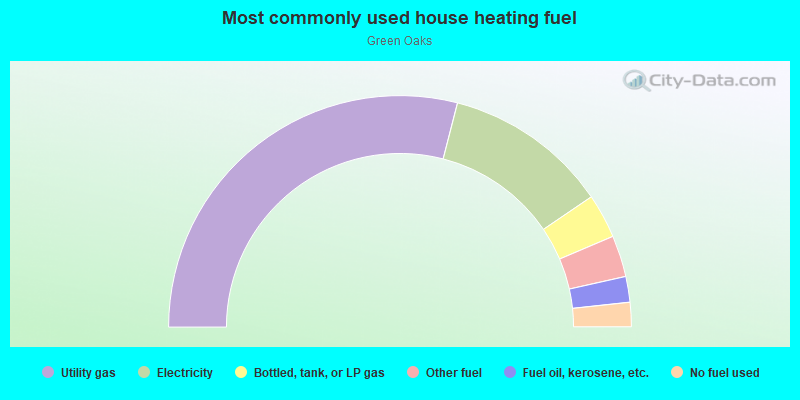
- 58.0%Utility gas
- 23.0%Electricity
- 6.2%Bottled, tank, or LP gas
- 5.8%Other fuel
- 3.6%Fuel oil, kerosene, etc.
- 3.4%No fuel used
Roads and streets:
Prospect St
Length: 0.29 miles
Directions: E-W, SE-NW
Address range: 700 to 999
Directions: E-W, SE-NW
Address range: 700 to 999
Eureka St
Length: 0.22 miles
Direction: E-W
Address range: 800 to 999
Direction: E-W
Address range: 800 to 999
S 8th St
Length: 0.17 miles
Direction: N-S
Address range: 200 to 399
Direction: N-S
Address range: 200 to 399
S Hosmer St
Length: 0.17 miles
Direction: N-S
Address range: 200 to 399
Direction: N-S
Address range: 200 to 399
E Kalamazoo St
Length: 0.17 miles
Direction: E-W
Address range: 726 to 799
Direction: E-W
Address range: 726 to 799
Hill St
Length: 0.05 miles
Direction: N-S
Address range: 300 to 399
Direction: N-S
Address range: 300 to 399
Mosher St
Length: 0.03 miles
Directions: E-W, SW-NE
Address range: 200 to 298
Directions: E-W, SW-NE
Address range: 200 to 298
Railroad features:
Csx RR
Length: 0.10 miles
Direction: SE-NW
Direction: SE-NW