Greenwood neighborhood in East Orange, New Jersey (NJ), 07017 detailed profile
Settings
X


Business Search - 14 Million verified businesses
Area: 0.147 square miles
Population: 4,029
Population density:
| Greenwood: | 27,392 people per square mile |
| East Orange: | 17,426 people per square mile |

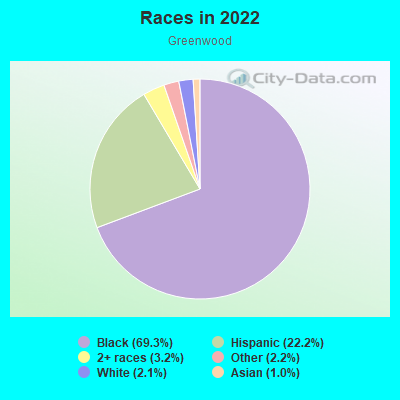
- 2,96769.3%Black
- 95022.2%Hispanic or Latino
- 1393.2%Two or more races
- 942.2%Some other race
- 922.1%White
- 421.0%Asian
Distribution of median household income
![Distribution of median household income]()
- 169Less than $10,000
- 165$10,000 to $19,999
- 148$20,000 to $29,999
- 109$30,000 to $39,999
- 172$40,000 to $49,999
- 122$50,000 to $59,999
- 63$60,000 to $74,999
- 178$75,000 to $99,999
- 164$100,000 to $124,999
- 101$125,000 to $149,999
- 89$150,000 to $199,999
- 95$200,000 or more

Distribution of owner-occupied house/condo value
![Distribution of owner-occupied house/condo value]()
- 50Less than $50,000
- 58$50,000 to $99,999
- 121$100,000 to $149,999
- 35$150,000 to $199,999
- 71$200,000 to $249,999
- 138$250,000 to $299,999
- 127$300,000 to $399,999
- 66$400,000 to $499,999
- 32$500,000 to $749,999
- 67$750,000 to $999,999

Distribution of rent paid by renters
![Distribution of rent paid by renters]()
- 78Less than $100
- 137$100 to $199
- 57$200 to $299
- 23$400 to $499
- 73$500 to $599
- 16$600 to $699
- 103$700 to $799
- 112$800 to $899
- 123$900 to $999
- 205$1,000 to $1,249
- 161$1,250 to $1,499
- 98$1,500 to $1,999
- 91$2,000 or more

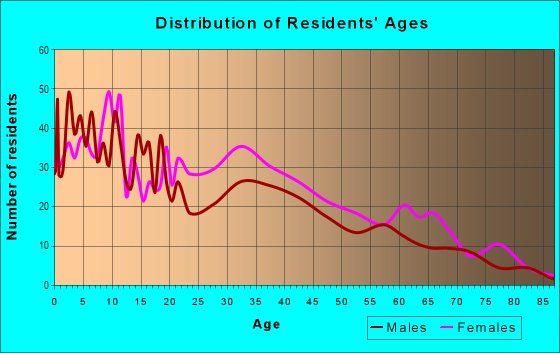
| Males: | 1,867 |
| Females: | 2,162 |
Males:
| This neighborhood: | 37.8 years |
| Whole city: | 34.0 years |
| This neighborhood: | 35.4 years |
| Whole city: | 39.2 years |
Average household size:
| Greenwood: | 6.8 people |
| East Orange: | 2.4 people |
Percentage of family households:
| Greenwood: | 55.8% |
| East Orange: | 35.5% |
| Here: | 29.7% |
| East Orange: | 21.9% |
Percentage of married-couple families with children (among all households):
| Greenwood: | 10.1% |
| East Orange: | 17.7% |
Percentage of single-mother households (among all households):
| Greenwood: | 17.4% |
| East Orange: | 19.1% |
Percentage of never married males 15 years old and over:
Percentage of never married females 15 years old and over:
| Greenwood: | 24.2% |
| East Orange: | 27.1% |
Percentage of never married females 15 years old and over:
| Greenwood: | 30.3% |
| city: | 26.2% |
Percentage of people that speak English not well or not at all:
| Greenwood: | 5.7% |
| East Orange: | 4.0% |
Percentage of people born in this state:
Percentage of people born in another U.S. state:
Percentage of native residents but born outside the U.S.:
Percentage of foreign born residents:
| Here: | 50.7% |
| East Orange: | 44.2% |
Percentage of people born in another U.S. state:
| Greenwood: | 24.3% |
| East Orange: | 18.0% |
Percentage of native residents but born outside the U.S.:
| Here: | 4.4% |
| city: | 2.4% |
Percentage of foreign born residents:
| Here: | 20.6% |
| East Orange: | 35.4% |
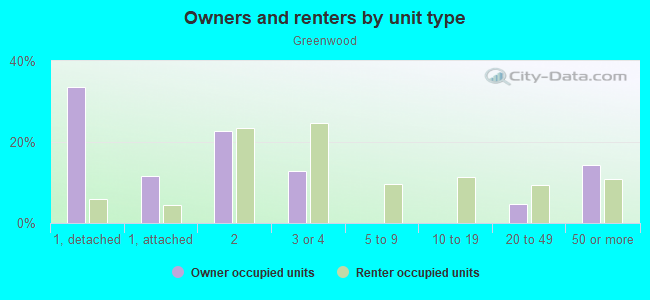
Owner-occupied
Renter-occupied

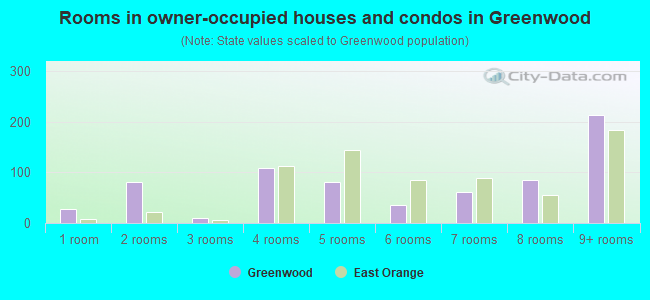
- Rooms in owner-occupied houses and condos in Greenwood
- 281 room
- 812 rooms
- 103 rooms
- 1094 rooms
- 815 rooms
- 356 rooms
- 627 rooms
- 848 rooms
- 2139+ rooms
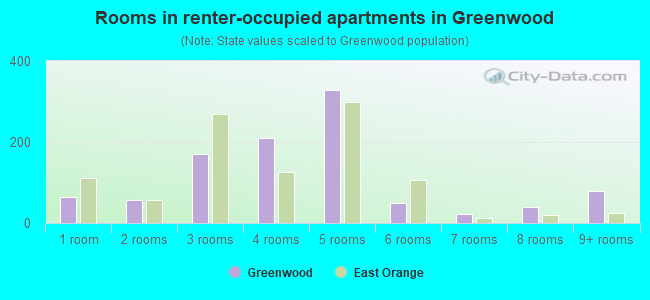
- Rooms in renter-occupied apartments in Greenwood
- 651 room
- 562 rooms
- 1703 rooms
- 2104 rooms
- 3295 rooms
- 496 rooms
- 227 rooms
- 408 rooms
- 789+ rooms
Owner-occupied
Renter-occupied
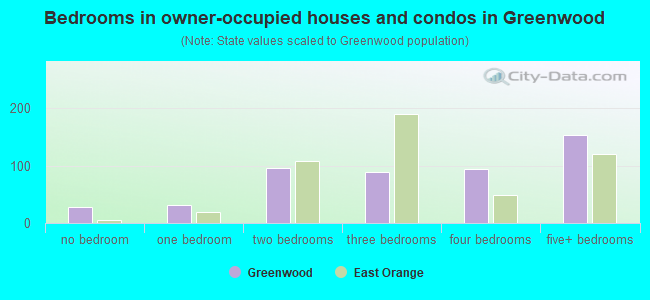
- Bedrooms in owner-occupied houses and condos in Greenwood
- 28no bedroom
- 311 bedroom
- 962 bedrooms
- 883 bedrooms
- 944 bedrooms
- 1535+ bedrooms
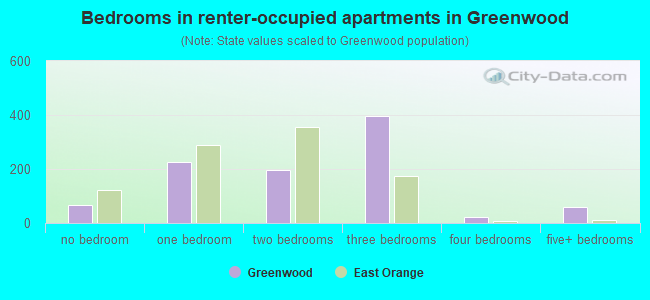
- Bedrooms in renter-occupied apartments in Greenwood
- 65no bedroom
- 2251 bedroom
- 1952 bedrooms
- 3963 bedrooms
- 214 bedrooms
- 585+ bedrooms
Average number of cars or other vehicles available in houses/condos:
Average number of cars or other vehicles available in apartments:
| This neighborhood: | 1.7 |
| East Orange: | 1.9 |
Average number of cars or other vehicles available in apartments:
| Here: | 0.9 |
| city: | 0.7 |
Percentage of units with a mortgage:
| Greenwood: | 82.5% |
| East Orange: | 72.5% |
Average estimated value of detached houses in 2022 (19.3% of all units):
| Greenwood: | $321,926 |
| East Orange: | $351,364 |
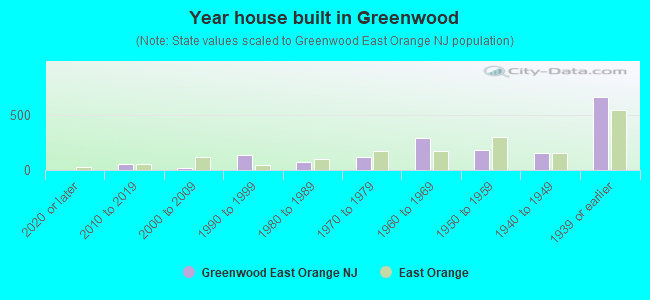
- Year house built in Greenwood
- 02020 or later
- 542010 to 2019
- 182000 to 2009
- 1381990 to 1999
- 731980 to 1989
- 1221970 to 1979
- 2941960 to 1969
- 1781950 to 1959
- 1521940 to 1949
- 6591939 or earlier
City-data.com crime index for city in 2020 (higher means more crime):
| City: | 201.2 |
| U.S. average: | 219.5 |
Travel time to work (commute)
![Travel time to work (commute)]()
- 18Less than 5 minutes
- 945 to 9 minutes
- 13810 to 14 minutes
- 24215 to 19 minutes
- 28020 to 24 minutes
- 20925 to 29 minutes
- 25930 to 34 minutes
- 7535 to 39 minutes
- 3640 to 44 minutes
- 7745 to 59 minutes
- 10860 to 89 minutes
- 6790 or more minutes

Means of transportation to work
![Means of transportation to work]()
- 68.1%1,071Drove a car alone
- 8.1%128Carpooled
- 10.2%161Bus
- 6.8%107Subway or elevated rail
- 5.0%78Long-distance train or commuter rail
- 3.2%51Taxi
- 3.1%49Walked
- 11.5%181Other means
- 8.0%125Worked at home

Time leaving home to go to work
![Time leaving home to go to work]()
- 11112:00 a.m. to 4:59 a.m.
- 805:00 a.m. to 5:29 a.m.
- 645:30 a.m. to 5:59 a.m.
- 576:00 a.m. to 6:29 a.m.
- 1826:30 a.m. to 6:59 a.m.
- 1237:00 a.m. to 7:29 a.m.
- 1547:30 a.m. to 7:59 a.m.
- 2068:00 a.m. to 8:29 a.m.
- 768:30 a.m. to 8:59 a.m.
- 1849:00 a.m. to 9:59 a.m.
- 2010:00 a.m. to 10:59 a.m.
- 2711:00 a.m. to 11:59 a.m.
- 18212:00 p.m. to 3:59 p.m.
- 1554:00 p.m. to 11:59 p.m.

Occupations of males:
- Percentage of males in management occupations (except farmers):
Here: 6.3% city: 6.9%
- Percentage of males in business and financial operations occupations:
Here: 5.5% city: 4.1%
- Percentage of males in architecture and engineering occupations:
Here: 2.8% city: 3.3%
- Percentage of males in community and social services occupations:
Here: 1.4% city: 1.3%
- Percentage of males in education, training, and library occupations:
Here: 1.7% city: 2.2%
- Percentage of males in arts, design, entertainment, sports, and media occupations:
Here: 1.5% city: 1.6%
- Percentage of males in healthcare practitioners and technical occupations:
Here: 2.4% city: 2.7%
- Percentage of males in service occupations:
Here: 27.5% city: 21.2%
- Percentage of males in sales and office occupations:
Here: 13.1% city: 16.5%
- Percentage of males in construction, extraction, and maintenance occupations:
Here: 1.2% city: 6.4%
- Percentage of males in production occupations:
Here: 4.7% city: 4.7%
- Percentage of males in transportation occupations:
Here: 13.3% city: 12.2%
- Percentage of males in material moving occupations:
Here: 14.8% city: 10.6%
Occupations of females:
- Percentage of females in management occupations (except farmers):
Here: 3.1% city: 6.5%
- Percentage of females in business and financial operations occupations:
Here: 3.6% city: 5.7%
- Percentage of females in computer and mathematical occupations:
Here: 3.8% city: 1.0%
- Percentage of females in community and social services occupations:
Here: 6.8% city: 4.4%
- Percentage of females in education, training, and library occupations:
Here: 10.3% city: 6.6%
- Percentage of females in healthcare practitioners and technical occupations:
Here: 2.5% city: 6.6%
- Percentage of females in service occupations:
Here: 29.3% city: 32.6%
- Percentage of females in sales and office occupations:
Here: 35.1% city: 27.4%
- Percentage of females in production occupations:
Here: 2.8% city: 1.1%
- Percentage of females in material moving occupations:
Here: 2.6% city: 3.3%
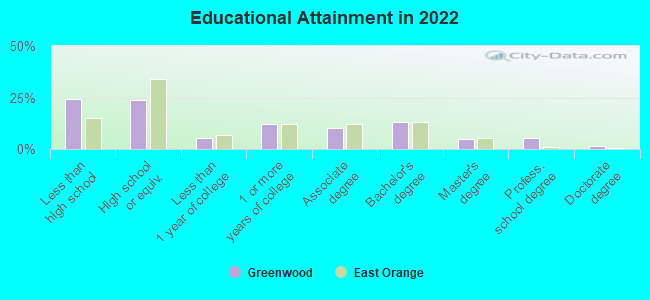
Education in this neighborhood (subdivision or community):
- Percentage of people 3 years and older in K-12 schools:
Greenwood: 25.0% East Orange: 19.7%
- Percentage of people 3 years and older in undergraduate colleges:
Greenwood: 5.7% East Orange: 7.0%
- Percentage of people 3 years and older in grad. or professional schools:
Greenwood: 3.2% East Orange: 0.4%
- Percentage of students K-12 enrolled in private schools:
Greenwood: 22.3% East Orange: 11.6%
Percentage of population below poverty level:
| Greenwood: | 28.0% |
| East Orange: | 22.1% |
Percentage of married-couple families with both working:
| Greenwood: | 81.3% |
| East Orange: | 72.4% |
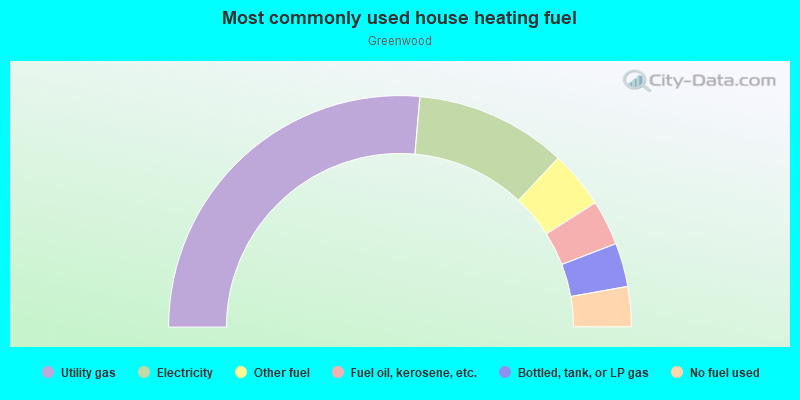
- 52.7%Utility gas
- 21.2%Electricity
- 8.0%Other fuel
- 6.3%Fuel oil, kerosene, etc.
- 6.1%Bottled, tank, or LP gas
- 5.6%No fuel used
Roads and streets:
N 19th St
Length: 0.49 miles
Direction: SW-NE
Address range: 1 to 189
Direction: SW-NE
Address range: 1 to 189
N 18th St
Length: 0.38 miles
Direction: SW-NE
Address range: 1 to 135
Direction: SW-NE
Address range: 1 to 135
N 17th St
Length: 0.37 miles
Direction: SW-NE
Address range: 1 to 135
Direction: SW-NE
Address range: 1 to 135
N 16th St
Length: 0.35 miles
Direction: SW-NE
Address range: 1 to 132
Direction: SW-NE
Address range: 1 to 132
N 15th St
Length: 0.34 miles
Direction: SW-NE
Address range: 1 to 175
Direction: SW-NE
Address range: 1 to 175
Park Ave
Length: 0.33 miles
Directions: E-W, SE-NW
Address range: 1 to 110
Directions: E-W, SE-NW
Address range: 1 to 110
Eaton Pl
Length: 0.31 miles
Direction: E-W
Address range: 1 to 107
Direction: E-W
Address range: 1 to 107
William St
Length: 0.31 miles
Direction: E-W
Address range: 24 to 121
Direction: E-W
Address range: 24 to 121
Greenwood Ave
Length: 0.20 miles
Directions: N-S, SW-NE
Address range: 33 to 99
Directions: N-S, SW-NE
Address range: 33 to 99
Essex County 658
Length: 0.00 miles
Direction: SE-NW
Direction: SE-NW