Greenwood Park neighborhood in Ferndale, Michigan (MI), 48220 detailed profile
Settings
X


Business Search - 14 Million verified businesses
Area: 0.432 square miles
Population: 3,339
Population density:
| Greenwood Park: | 7,730 people per square mile |
| Ferndale: | 4,966 people per square mile |

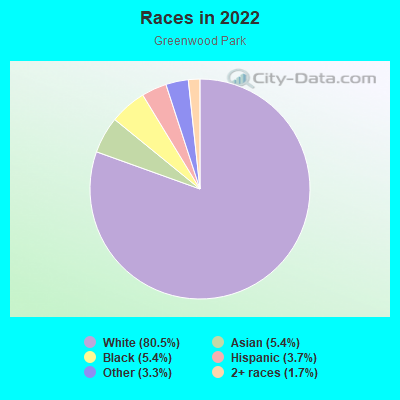
- 2,72080.5%White
- 1815.4%Black
- 1845.4%Asian
- 1253.7%Hispanic or Latino
- 1103.3%Some other race
- 561.7%Two or more races
- 10.03%American Indian
Median household income in 2022:
| Greenwood Park: | $99,382 |
| Ferndale: | $86,120 |
Distribution of median household income
![Distribution of median household income]()
- 53Less than $10,000
- 107$10,000 to $19,999
- 124$20,000 to $29,999
- 99$30,000 to $39,999
- 109$40,000 to $49,999
- 185$50,000 to $59,999
- 196$60,000 to $74,999
- 252$75,000 to $99,999
- 264$100,000 to $124,999
- 110$125,000 to $149,999
- 317$150,000 to $199,999
- 126$200,000 or more

Distribution of owner-occupied house/condo value
![Distribution of owner-occupied house/condo value]()
- 93Less than $50,000
- 106$50,000 to $99,999
- 94$100,000 to $149,999
- 172$150,000 to $199,999
- 415$200,000 to $249,999
- 313$250,000 to $299,999
- 161$300,000 to $399,999
- 143$400,000 to $499,999
- 25$500,000 to $749,999
- 8$750,000 to $999,999

Distribution of rent paid by renters
![Distribution of rent paid by renters]()
- 114$200 to $299
- 48$300 to $399
- 151$400 to $499
- 73$500 to $599
- 90$600 to $699
- 59$700 to $799
- 46$800 to $899
- 31$900 to $999
- 137$1,000 to $1,249
- 178$1,250 to $1,499
- 66$1,500 to $1,999
- 50$2,000 or more

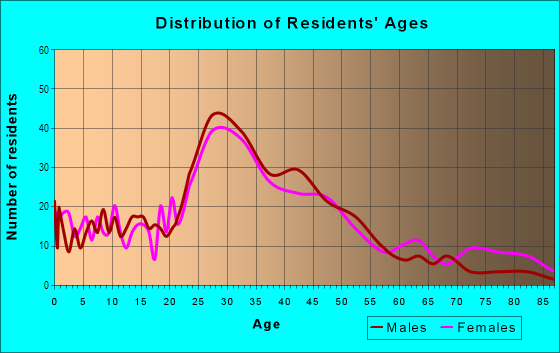
| Males: | 1,969 |
| Females: | 1,370 |
Males:
| This neighborhood: | 35.9 years |
| Whole city: | 36.6 years |
| This neighborhood: | 33.5 years |
| Whole city: | 35.1 years |
Average household size:
| Greenwood Park: | 5.8 people |
| Ferndale: | 1.9 people |
Percentage of family households:
| Greenwood Park: | 32.5% |
| Ferndale: | 29.4% |
| Here: | 33.3% |
| Ferndale: | 28.4% |
Percentage of married-couple families with children (among all households):
| Greenwood Park: | 50.3% |
| Ferndale: | 38.1% |
Percentage of single-mother households (among all households):
| Greenwood Park: | 3.2% |
| Ferndale: | 9.4% |
Percentage of never married males 15 years old and over:
Percentage of never married females 15 years old and over:
| Greenwood Park: | 29.4% |
| Ferndale: | 26.7% |
Percentage of never married females 15 years old and over:
| Greenwood Park: | 19.6% |
| city: | 25.4% |
Percentage of people that speak English not well or not at all:
| Greenwood Park: | 0.2% |
| Ferndale: | 0.2% |
Percentage of people born in this state:
Percentage of people born in another U.S. state:
Percentage of native residents but born outside the U.S.:
Percentage of foreign born residents:
| Here: | 75.7% |
| Ferndale: | 77.2% |
Percentage of people born in another U.S. state:
| Greenwood Park: | 16.8% |
| Ferndale: | 16.7% |
Percentage of native residents but born outside the U.S.:
| Here: | 1.0% |
| city: | 0.9% |
Percentage of foreign born residents:
| Here: | 6.7% |
| Ferndale: | 5.3% |
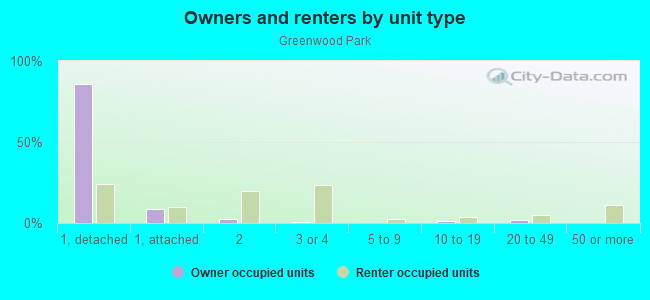
Owner-occupied
Renter-occupied

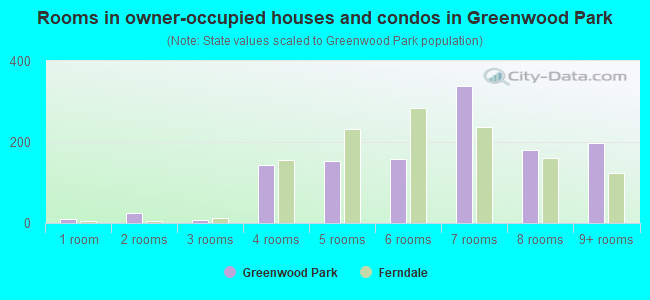
- Rooms in owner-occupied houses and condos in Greenwood Park
- 101 room
- 252 rooms
- 83 rooms
- 1424 rooms
- 1535 rooms
- 1586 rooms
- 3387 rooms
- 1808 rooms
- 1989+ rooms
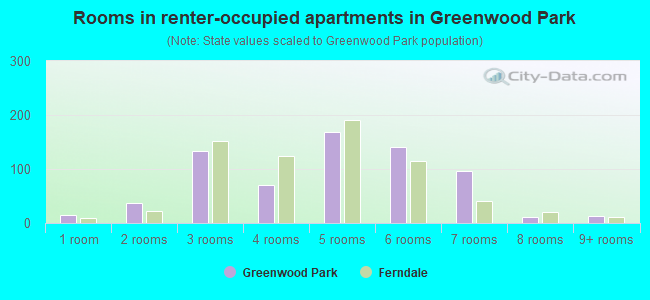
- Rooms in renter-occupied apartments in Greenwood Park
- 151 room
- 372 rooms
- 1333 rooms
- 714 rooms
- 1685 rooms
- 1406 rooms
- 977 rooms
- 118 rooms
- 139+ rooms
Owner-occupied
Renter-occupied
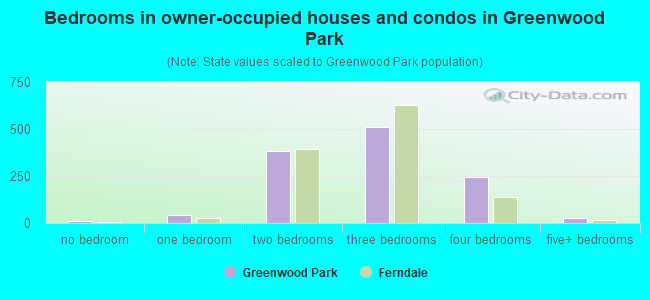
- Bedrooms in owner-occupied houses and condos in Greenwood Park
- 10no bedroom
- 401 bedroom
- 3822 bedrooms
- 5103 bedrooms
- 2464 bedrooms
- 245+ bedrooms
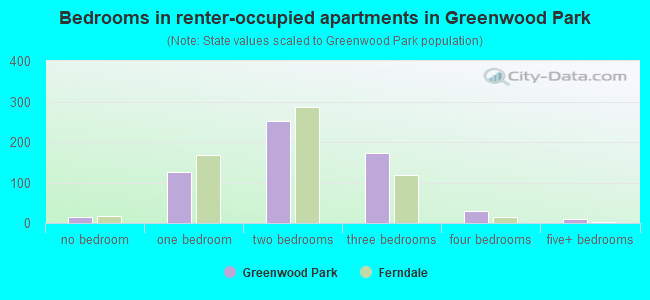
- Bedrooms in renter-occupied apartments in Greenwood Park
- 15no bedroom
- 1261 bedroom
- 2522 bedrooms
- 1743 bedrooms
- 294 bedrooms
- 115+ bedrooms
Average number of cars or other vehicles available in houses/condos:
Average number of cars or other vehicles available in apartments:
| This neighborhood: | 1.8 |
| Ferndale: | 1.8 |
Average number of cars or other vehicles available in apartments:
| Here: | 1.5 |
| city: | 1.4 |
Percentage of units with a mortgage:
| Greenwood Park: | 79.6% |
| Ferndale: | 76.8% |
Average estimated value of detached houses in 2022 (78.2% of all units):
| Greenwood Park: | $249,515 |
| Michigan: | $280,038 |
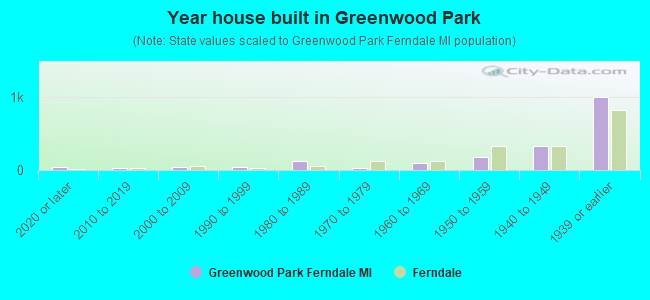
- Year house built in Greenwood Park
- 382020 or later
- 272010 to 2019
- 442000 to 2009
- 421990 to 1999
- 1211980 to 1989
- 271970 to 1979
- 951960 to 1969
- 1841950 to 1959
- 3261940 to 1949
- 9941939 or earlier
City-data.com crime index for city in 2020 (higher means more crime):
| City: | 137.0 |
| U.S. average: | 219.5 |
Travel time to work (commute)
![Travel time to work (commute)]()
- 13Less than 5 minutes
- 675 to 9 minutes
- 8010 to 14 minutes
- 15215 to 19 minutes
- 34320 to 24 minutes
- 16125 to 29 minutes
- 22930 to 34 minutes
- 5935 to 39 minutes
- 5440 to 44 minutes
- 8145 to 59 minutes
- 4360 to 89 minutes
- 2090 or more minutes

Means of transportation to work
![Means of transportation to work]()
- 67.6%1,476Drove a car alone
- 3.8%82Carpooled
- 0.4%9Bus
- 2.0%44Motorcycle
- 4.1%89Bicycle
- 2.2%49Walked
- 2.5%55Other means
- 26.3%575Worked at home

Time leaving home to go to work
![Time leaving home to go to work]()
- 912:00 a.m. to 4:59 a.m.
- 155:00 a.m. to 5:29 a.m.
- 265:30 a.m. to 5:59 a.m.
- 606:00 a.m. to 6:29 a.m.
- 866:30 a.m. to 6:59 a.m.
- 1267:00 a.m. to 7:29 a.m.
- 2657:30 a.m. to 7:59 a.m.
- 1978:00 a.m. to 8:29 a.m.
- 1678:30 a.m. to 8:59 a.m.
- 1519:00 a.m. to 9:59 a.m.
- 5810:00 a.m. to 10:59 a.m.
- 2711:00 a.m. to 11:59 a.m.
- 6212:00 p.m. to 3:59 p.m.
- 514:00 p.m. to 11:59 p.m.

Occupations of males:
- Percentage of males in management occupations (except farmers):
Here: 21.5% city: 13.7%
- Percentage of males in business and financial operations occupations:
Here: 5.8% city: 6.8%
- Percentage of males in computer and mathematical occupations:
Here: 9.2% city: 9.5%
- Percentage of males in architecture and engineering occupations:
Here: 8.5% city: 10.0%
- Percentage of males in life, physical, and social science occupations:
Here: 1.4% city: 0.7%
- Percentage of males in legal occupations:
Here: 2.9% city: 2.3%
- Percentage of males in education, training, and library occupations:
Here: 1.2% city: 2.2%
- Percentage of males in arts, design, entertainment, sports, and media occupations:
Here: 4.9% city: 5.5%
- Percentage of males in healthcare practitioners and technical occupations:
Here: 2.3% city: 3.2%
- Percentage of males in service occupations:
Here: 9.2% city: 10.1%
- Percentage of males in sales and office occupations:
Here: 13.3% city: 15.4%
- Percentage of males in construction, extraction, and maintenance occupations:
Here: 2.3% city: 3.7%
- Percentage of males in production occupations:
Here: 8.6% city: 8.4%
- Percentage of males in transportation occupations:
Here: 6.5% city: 4.5%
Occupations of females:
- Percentage of females in management occupations (except farmers):
Here: 15.5% city: 14.6%
- Percentage of females in business and financial operations occupations:
Here: 9.5% city: 11.7%
- Percentage of females in computer and mathematical occupations:
Here: 2.1% city: 2.4%
- Percentage of females in architecture and engineering occupations:
Here: 2.4% city: 2.3%
- Percentage of females in life, physical, and social science occupations:
Here: 2.8% city: 2.9%
- Percentage of females in education, training, and library occupations:
Here: 6.1% city: 6.1%
- Percentage of females in arts, design, entertainment, sports, and media occupations:
Here: 5.9% city: 6.5%
- Percentage of females in healthcare practitioners and technical occupations:
Here: 25.5% city: 14.7%
- Percentage of females in service occupations:
Here: 11.6% city: 13.4%
- Percentage of females in sales and office occupations:
Here: 17.3% city: 18.0%
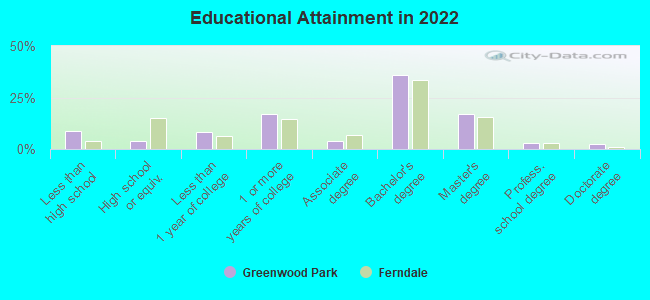
Education in this neighborhood (subdivision or community):
- Percentage of people 3 years and older in K-12 schools:
Greenwood Park: 12.1% Ferndale: 5.7%
- Percentage of people 3 years and older in undergraduate colleges:
Greenwood Park: 7.2% Ferndale: 3.6%
- Percentage of people 3 years and older in grad. or professional schools:
Greenwood Park: 3.3% Ferndale: 4.2%
- Percentage of students K-12 enrolled in private schools:
Greenwood Park: 11.3% Ferndale: 6.7%
Percentage of population below poverty level:
| Greenwood Park: | 8.1% |
| Ferndale: | 8.4% |
Median year owner moved in (as recorded in 2022):
| Greenwood Park: | 2012 |
| Ferndale: | 2011 |
Percentage of married-couple families with both working:
| Greenwood Park: | 102.2% |
| Ferndale: | 89.9% |
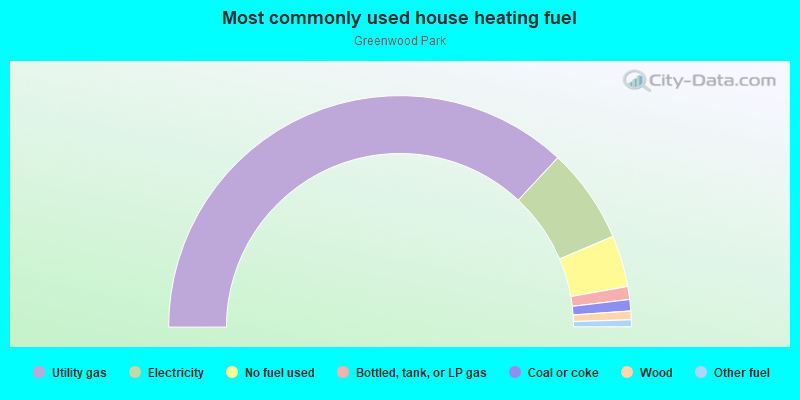
- 73.9%Utility gas
- 13.3%Electricity
- 7.2%No fuel used
- 1.8%Bottled, tank, or LP gas
- 1.6%Coal or coke
- 1.2%Wood
- 1.0%Other fuel
Highways in this neighborhood:
State Hwy 1 (S Woodward Ave)
Length: 1.18 miles
Direction: SE-NW
Address range: 22001 to 22899
Direction: SE-NW
Address range: 22001 to 22899
Roads and streets:
W Hazelhurst St
Length: 0.73 miles
Direction: E-W
Address range: 100 to 799
Direction: E-W
Address range: 100 to 799
Pearson St
Length: 0.68 miles
Direction: E-W
Address range: 100 to 799
Direction: E-W
Address range: 100 to 799
Leroy St
Length: 0.64 miles
Direction: E-W
Address range: 100 to 699
Direction: E-W
Address range: 100 to 699
Albany St
Length: 0.61 miles
Direction: E-W
Address range: 100 to 699
Direction: E-W
Address range: 100 to 699
W Saratoga St
Length: 0.57 miles
Direction: E-W
Address range: 100 to 700
Direction: E-W
Address range: 100 to 700
W 9 Mile Rd
Length: 0.54 miles
Direction: E-W
Address range: 128 to 600
Direction: E-W
Address range: 128 to 600
W Marshall Ave (W Marshall St)
Length: 0.53 miles
Direction: E-W
Address range: 122 to 499
Direction: E-W
Address range: 122 to 499
W Troy Ave
Length: 0.53 miles
Direction: E-W
Address range: 100 to 599
Direction: E-W
Address range: 100 to 599
Paxton St
Length: 0.52 miles
Direction: N-S
Address range: 1000 to 1949
Direction: N-S
Address range: 1000 to 1949
Vester Ave (Vester St)
Length: 0.48 miles
Direction: E-W
Address range: 100 to 407
Direction: E-W
Address range: 100 to 407
E 9 Mile Rd
Length: 0.44 miles
Direction: E-W
Address range: 100 to 499
Direction: E-W
Address range: 100 to 499
Allen St (Allen Ave)
Length: 0.40 miles
Direction: N-S
Address range: 947 to 1799
Direction: N-S
Address range: 947 to 1799
E Troy St
Length: 0.40 miles
Direction: E-W
Address range: 100 to 499
Direction: E-W
Address range: 100 to 499
Farmdale St
Length: 0.39 miles
Direction: N-S
Address range: 1000 to 1799
Direction: N-S
Address range: 1000 to 1799
E Saratoga St
Length: 0.37 miles
Direction: E-W
Address range: 100 to 499
Direction: E-W
Address range: 100 to 499
Ardmore Dr
Length: 0.34 miles
Direction: E-W
Address range: 100 to 399
Direction: E-W
Address range: 100 to 399
Academy St
Length: 0.30 miles
Direction: E-W
Address range: 100 to 399
Direction: E-W
Address range: 100 to 399
W Marshall St
Length: 0.28 miles
Direction: E-W
Address range: 500 to 705
Direction: E-W
Address range: 500 to 705
College St
Length: 0.27 miles
Direction: E-W
Address range: 100 to 699
Direction: E-W
Address range: 100 to 699
Withington St
Length: 0.26 miles
Direction: E-W
Address range: 100 to 399
Direction: E-W
Address range: 100 to 399
University St
Length: 0.24 miles
Direction: E-W
Address range: 100 to 299
Direction: E-W
Address range: 100 to 299
E Hazelhurst St
Length: 0.21 miles
Direction: E-W
Address range: 100 to 447
Direction: E-W
Address range: 100 to 447
E Marshall St
Length: 0.17 miles
Direction: E-W
Address range: 100 to 348
Direction: E-W
Address range: 100 to 348
Planavon St
Length: 0.07 miles
Direction: N-S
Address range: 1800 to 1899
Direction: N-S
Address range: 1800 to 1899
Bermuda St
Length: 0.06 miles
Direction: N-S
Direction: N-S
Leland St
Length: 0.06 miles
Direction: N-S
Address range: 1800 to 1899
Direction: N-S
Address range: 1800 to 1899
Laprairie St
Length: 0.06 miles
Direction: N-S
Address range: 1000 to 1099
Direction: N-S
Address range: 1000 to 1099