Habitat neighborhood in Belmont, Massachusetts (MA), 02478 detailed profile
Settings
X


Business Search - 14 Million verified businesses
Area: 0.334 square miles
Population: 391
Population density:
| Habitat: | 1,172 people per square mile |
| Belmont: | 5,792 people per square mile |

- 34086.5%White
- 4010.2%Asian
- 71.8%Two or more races
- 41.0%Black
- 20.5%Hispanic or Latino

Median household income in 2022:
| Habitat: | $150,701 |
| Belmont: | $164,918 |
Distribution of median household income
![Distribution of median household income]()
- 6Less than $10,000
- 7$10,000 to $19,999
- 18$20,000 to $29,999
- 6$30,000 to $39,999
- 7$40,000 to $49,999
- 6$50,000 to $59,999
- 5$60,000 to $74,999
- 15$75,000 to $99,999
- 11$100,000 to $124,999
- 13$125,000 to $149,999
- 15$150,000 to $199,999
- 58$200,000 or more

Distribution of owner-occupied house/condo value
![Distribution of owner-occupied house/condo value]()
- 3Less than $50,000
- 5$100,000 to $149,999
- 5$150,000 to $199,999
- 1$200,000 to $249,999
- 7$300,000 to $399,999
- 5$400,000 to $499,999
- 7$500,000 to $749,999
- 28$750,000 to $999,999
- 60$1,000,000 or more

Distribution of rent paid by renters
![Distribution of rent paid by renters]()
- 5Less than $100
- 1$100 to $199
- 2$200 to $299
- 3$300 to $399
- 7$400 to $499
- 3$500 to $599
- 9$600 to $699
- 12$700 to $799
- 3$1,000 to $1,249
- 4$1,250 to $1,499
- 12$1,500 to $1,999
- 22$2,000 or more

Median rent in 2022:
| Habitat: | $2,391 |
| Belmont: | $2,001 |
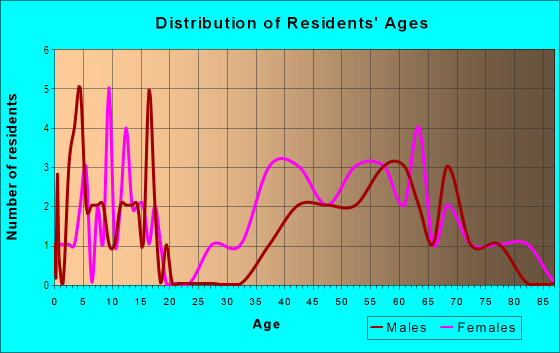
| Males: | 191 |
| Females: | 200 |
Males:
| This neighborhood: | 51.7 years |
| Whole city: | 41.7 years |
| This neighborhood: | 50.0 years |
| Whole city: | 42.3 years |
Average household size:
| Habitat: | 2.6 people |
| Belmont: | 2.6 people |
Percentage of family households:
| Habitat: | 52.7% |
| Belmont: | 52.9% |
| Here: | 79.0% |
| Belmont: | 62.9% |
Percentage of married-couple families with children (among all households):
| Habitat: | 35.7% |
| Belmont: | 34.7% |
Percentage of single-mother households (among all households):
| Habitat: | 1.4% |
| Belmont: | 2.8% |
Percentage of never married males 15 years old and over:
Percentage of never married females 15 years old and over:
| Habitat: | 14.6% |
| Belmont: | 11.9% |
Percentage of never married females 15 years old and over:
| Habitat: | 6.7% |
| place: | 13.4% |
Percentage of people that speak English not well or not at all:
| Habitat: | 3.4% |
| Belmont: | 3.0% |
Percentage of people born in this state:
Percentage of people born in another U.S. state:
Percentage of native residents but born outside the U.S.:
Percentage of foreign born residents:
| Here: | 49.1% |
| Belmont: | 44.8% |
Percentage of people born in another U.S. state:
| Habitat: | 27.3% |
| Belmont: | 27.9% |
Percentage of native residents but born outside the U.S.:
| Here: | 2.5% |
| place: | 1.7% |
Percentage of foreign born residents:
| Here: | 21.0% |
| Belmont: | 25.6% |

Owner-occupied
Renter-occupied


- Rooms in owner-occupied houses and condos in Habitat
- 01 room
- 02 rooms
- 43 rooms
- 24 rooms
- 125 rooms
- 106 rooms
- 157 rooms
- 148 rooms
- 469+ rooms

- Rooms in renter-occupied apartments in Habitat
- 61 room
- 122 rooms
- 143 rooms
- 74 rooms
- 75 rooms
- 126 rooms
- 37 rooms
- 78 rooms
- 129+ rooms
Owner-occupied
Renter-occupied

- Bedrooms in owner-occupied houses and condos in Habitat
- 0no bedroom
- 121 bedroom
- 162 bedrooms
- 333 bedrooms
- 374 bedrooms
- 155+ bedrooms

- Bedrooms in renter-occupied apartments in Habitat
- 6no bedroom
- 261 bedroom
- 122 bedrooms
- 93 bedrooms
- 94 bedrooms
- 35+ bedrooms
Average number of cars or other vehicles available in houses/condos:
Average number of cars or other vehicles available in apartments:
| This neighborhood: | 1.9 |
| Belmont: | 1.8 |
Average number of cars or other vehicles available in apartments:
| Here: | 1.3 |
| place: | 1.2 |
Percentage of units with a mortgage:
| Habitat: | 76.6% |
| Belmont: | 64.8% |
Housing prices:
- Average estimated value of detached houses in 2022 (77.9% of all units):
Habitat: $1,300,781 Belmont: $1,353,493
- Average estimated value of housing units in 2-unit structures in 2022 (18.6% of all units):
This neighborhood: $724,362 Belmont: $774,009

- Year house built in Habitat
- 22020 or later
- 102010 to 2019
- 392000 to 2009
- 11990 to 1999
- 21980 to 1989
- 81970 to 1979
- 131960 to 1969
- 71950 to 1959
- 161940 to 1949
- 891939 or earlier

City-data.com crime index for place in 2020 (higher means more crime):
| City: | 56.5 |
| U.S. average: | 219.5 |
Travel time to work (commute)
![Travel time to work (commute)]()
- 1Less than 5 minutes
- 95 to 9 minutes
- 310 to 14 minutes
- 1715 to 19 minutes
- 1820 to 24 minutes
- 625 to 29 minutes
- 2530 to 34 minutes
- 835 to 39 minutes
- 940 to 44 minutes
- 1145 to 59 minutes
- 660 to 89 minutes

Means of transportation to work
![Means of transportation to work]()
- 68.3%129Drove a car alone
- 7.9%15Carpooled
- 5.3%10Bus
- 3.2%6Subway or elevated rail
- 0.5%1Long-distance train or commuter rail
- 2.1%4Taxi
- 5.8%11Bicycle
- 2.1%4Walked
- 4.8%9Other means
- 7.9%15Worked at home

Time leaving home to go to work
![Time leaving home to go to work]()
- 212:00 a.m. to 4:59 a.m.
- 15:00 a.m. to 5:29 a.m.
- 76:00 a.m. to 6:29 a.m.
- 46:30 a.m. to 6:59 a.m.
- 297:00 a.m. to 7:29 a.m.
- 127:30 a.m. to 7:59 a.m.
- 248:00 a.m. to 8:29 a.m.
- 128:30 a.m. to 8:59 a.m.
- 209:00 a.m. to 9:59 a.m.
- 110:00 a.m. to 10:59 a.m.
- 411:00 a.m. to 11:59 a.m.
- 512:00 p.m. to 3:59 p.m.
- 44:00 p.m. to 11:59 p.m.

Occupations of males:
- Percentage of males in management occupations (except farmers):
Here: 17.4% place: 18.9%
- Percentage of males in business and financial operations occupations:
Here: 5.3% place: 9.8%
- Percentage of males in computer and mathematical occupations:
Here: 12.3% place: 11.9%
- Percentage of males in architecture and engineering occupations:
Here: 12.8% place: 7.3%
- Percentage of males in life, physical, and social science occupations:
Here: 8.5% place: 10.3%
- Percentage of males in community and social services occupations:
Here: 7.5% place: 0.9%
- Percentage of males in legal occupations:
Here: 1.2% place: 3.8%
- Percentage of males in arts, design, entertainment, sports, and media occupations:
Here: 6.3% place: 3.9%
- Percentage of males in service occupations:
Here: 11.6% place: 4.7%
- Percentage of males in sales and office occupations:
Here: 9.0% place: 10.1%
- Percentage of males in production occupations:
Here: 5.2% place: 1.8%
- Percentage of males in transportation occupations:
Here: 1.0% place: 0.7%
- Percentage of males in material moving occupations:
Here: 7.2% place: 1.4%
Occupations of females:
- Percentage of females in management occupations (except farmers):
Here: 27.7% place: 16.9%
- Percentage of females in business and financial operations occupations:
Here: 13.0% place: 12.5%
- Percentage of females in computer and mathematical occupations:
Here: 3.4% place: 4.0%
- Percentage of females in life, physical, and social science occupations:
Here: 3.0% place: 7.8%
- Percentage of females in legal occupations:
Here: 4.7% place: 2.8%
- Percentage of females in education, training, and library occupations:
Here: 15.3% place: 15.1%
- Percentage of females in healthcare practitioners and technical occupations:
Here: 8.2% place: 7.7%
- Percentage of females in service occupations:
Here: 12.9% place: 6.5%
- Percentage of females in sales and office occupations:
Here: 11.4% place: 17.8%
Education in this neighborhood (subdivision or community):
- Percentage of people 3 years and older in K-12 schools:
Habitat: 20.8% Belmont: 19.8%
- Percentage of people 3 years and older in undergraduate colleges:
Habitat: 7.0% Belmont: 3.9%
- Percentage of people 3 years and older in grad. or professional schools:
Habitat: 2.3% Belmont: 2.7%
- Percentage of students K-12 enrolled in private schools:
Habitat: 43.8% Belmont: 11.4%
Percentage of population below poverty level:
| Habitat: | 3.6% |
| Belmont: | 3.9% |
Median year owner moved in (as recorded in 2022):
Median year renter moved in (as recorded in 2022):
| Habitat: | 2005 |
| Belmont: | 2005 |
Median year renter moved in (as recorded in 2022):
| Habitat: | 2011 |
| Belmont: | 2016 |
Percentage of married-couple families with both working:
| Habitat: | 56.2% |
| Belmont: | 74.6% |

- 57.8%Utility gas
- 21.9%Electricity
- 14.6%Fuel oil, kerosene, etc.
- 3.2%Bottled, tank, or LP gas
- 1.4%Wood
- 1.1%No fuel used
Roads and streets:
Concord Ave
Length: 0.94 miles
Directions: E-W, SE-NW
Address range: 752 to 999
Directions: E-W, SE-NW
Address range: 752 to 999
Marsh St
Length: 0.71 miles
Directions: E-W, SE-NW, SW-NE
Address range: 189 to 499
Directions: E-W, SE-NW, SW-NE
Address range: 189 to 499
Juniper Rd
Length: 0.40 miles
Directions: E-W, N-S, SE-NW, SW-NE
Address range: 1 to 199
Directions: E-W, N-S, SE-NW, SW-NE
Address range: 1 to 199
Woodbine Rd
Length: 0.32 miles
Directions: E-W, N-S, SE-NW, SW-NE
Address range: 1 to 99
Directions: E-W, N-S, SE-NW, SW-NE
Address range: 1 to 99
Partridge Ln
Length: 0.29 miles
Directions: E-W, N-S, SE-NW, SW-NE
Address range: 1 to 99
Directions: E-W, N-S, SE-NW, SW-NE
Address range: 1 to 99
Somerset St
Length: 0.29 miles
Directions: E-W, SW-NE
Address range: 203 to 399
Directions: E-W, SW-NE
Address range: 203 to 399
Winter St
Length: 0.24 miles
Direction: SE-NW
Address range: 1 to 95
Direction: SE-NW
Address range: 1 to 95
Rayburn Rd
Length: 0.21 miles
Directions: N-S, SE-NW, SW-NE
Address range: 1 to 99
Directions: N-S, SE-NW, SW-NE
Address range: 1 to 99
Audubon Ln
Length: 0.14 miles
Directions: E-W, SE-NW, SW-NE
Address range: 1 to 50
Directions: E-W, SE-NW, SW-NE
Address range: 1 to 50
Dundonald Rd
Length: 0.09 miles
Direction: SW-NE
Address range: 1 to 99
Direction: SW-NE
Address range: 1 to 99
Other features:
Atkins Brk
Length: 0.07 miles
Direction: SE-NW
Direction: SE-NW