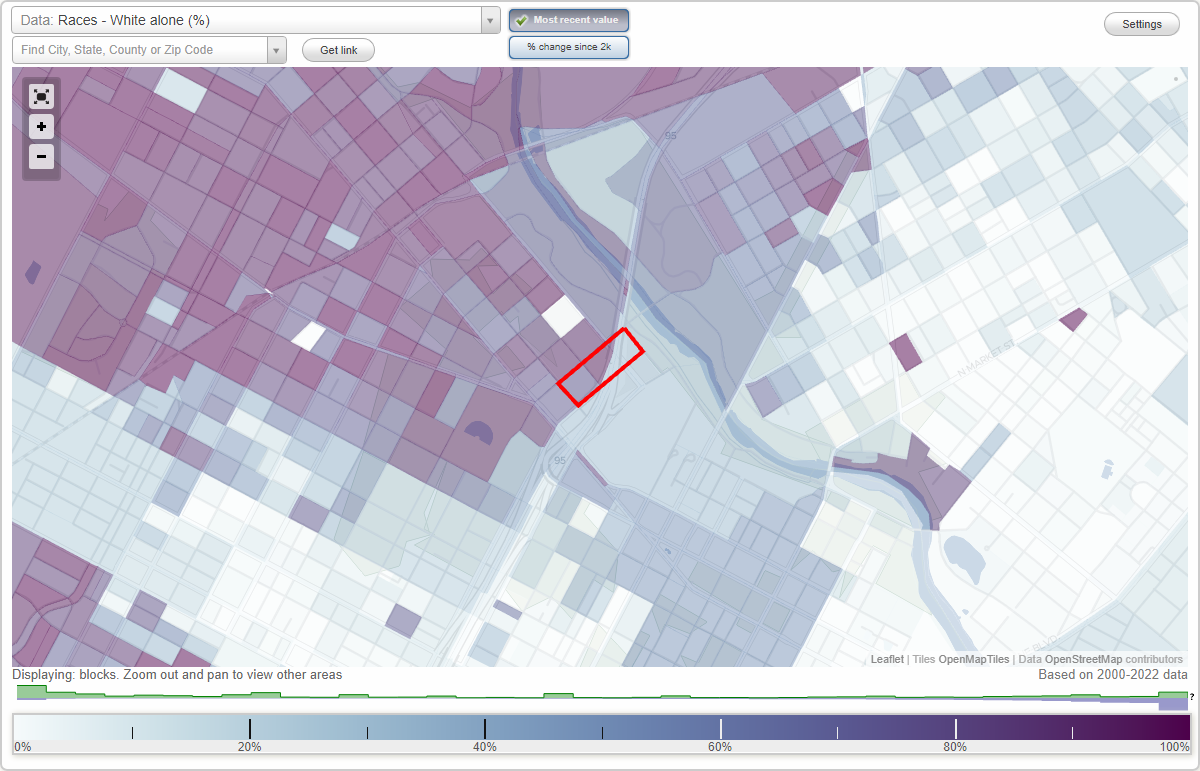
Happy Valley neighborhood in Wilmington, Delaware (DE), 19806 detailed profile
Settings
X

Business Search - 14 Million verified businesses
Area: 0.013 square miles
Population: 301
Population density:
| Happy Valley: | 22,762 people per square mile |
| Wilmington: | 6,597 people per square mile |

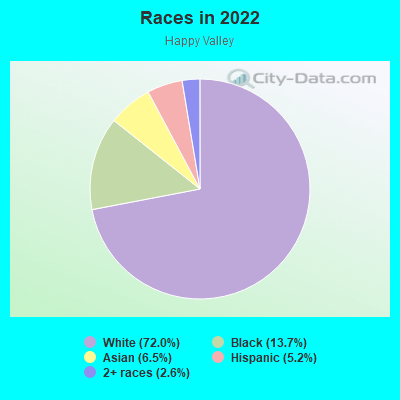
- 22172.0%White
- 4213.7%Black
- 206.5%Asian
- 165.2%Hispanic or Latino
- 82.6%Two or more races
Median household income in 2022:
| Happy Valley: | $73,685 |
| Wilmington: | $52,768 |
Distribution of median household income
![Distribution of median household income]()
- 32Less than $10,000
- 23$10,000 to $19,999
- 16$20,000 to $29,999
- 25$30,000 to $39,999
- 33$40,000 to $49,999
- 11$50,000 to $59,999
- 37$60,000 to $74,999
- 16$75,000 to $99,999
- 12$100,000 to $124,999
- 37$125,000 to $149,999
- 27$150,000 to $199,999
- 15$200,000 or more

Distribution of owner-occupied house/condo value
![Distribution of owner-occupied house/condo value]()
- 5$50,000 to $99,999
- 8$100,000 to $149,999
- 16$150,000 to $199,999
- 9$200,000 to $249,999
- 5$250,000 to $299,999
- 41$300,000 to $399,999
- 11$400,000 to $499,999
- 8$500,000 to $749,999
- 5$750,000 to $999,999

Distribution of rent paid by renters
![Distribution of rent paid by renters]()
- 2$100 to $199
- 9$200 to $299
- 17$300 to $399
- 2$400 to $499
- 5$500 to $599
- 5$600 to $699
- 11$700 to $799
- 1$800 to $899
- 31$900 to $999
- 30$1,000 to $1,249
- 25$1,250 to $1,499
- 19$1,500 to $1,999
- 20$2,000 or more

Median rent in 2022:
| Happy Valley: | $1,085 |
| Wilmington: | $941 |
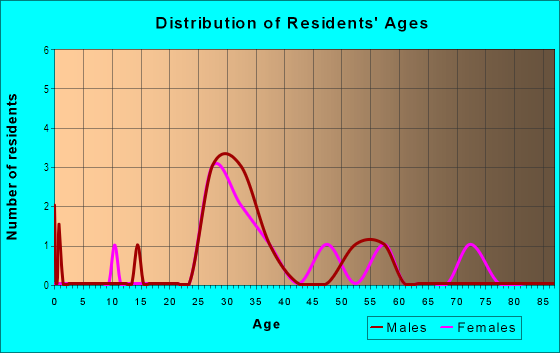
| Males: | 168 |
| Females: | 133 |
Males:
| This neighborhood: | 41.8 years |
| Whole city: | 37.1 years |
| This neighborhood: | 68.8 years |
| Whole city: | 41.1 years |
Average household size:
| Happy Valley: | 1.2 people |
| Wilmington: | 2.1 people |
Percentage of family households:
| Happy Valley: | 7.6% |
| Wilmington: | 32.8% |
| Here: | 10.4% |
| Wilmington: | 20.9% |
Percentage of married-couple families with children (among all households):
| Happy Valley: | 19.1% |
| Wilmington: | 13.2% |
Percentage of single-mother households (among all households):
| Happy Valley: | 56.9% |
| Wilmington: | 24.1% |
Percentage of never married males 15 years old and over:
Percentage of never married females 15 years old and over:
| Happy Valley: | 35.5% |
| Wilmington: | 22.2% |
Percentage of never married females 15 years old and over:
| Happy Valley: | 10.4% |
| city: | 28.6% |
Percentage of people that speak English not well or not at all:
| Happy Valley: | 0.0% |
| Wilmington: | 2.4% |
Percentage of people born in this state:
Percentage of people born in another U.S. state:
Percentage of native residents but born outside the U.S.:
Percentage of foreign born residents:
| Here: | 39.9% |
| Wilmington: | 45.5% |
Percentage of people born in another U.S. state:
| Happy Valley: | 55.4% |
| Wilmington: | 43.0% |
Percentage of native residents but born outside the U.S.:
| Here: | 0.0% |
| city: | 3.5% |
Percentage of foreign born residents:
| Here: | 4.6% |
| Wilmington: | 8.0% |
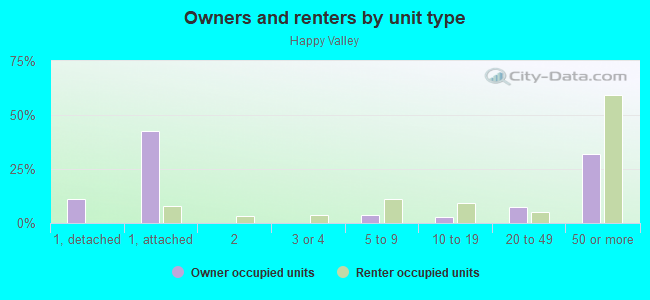
Owner-occupied
Renter-occupied

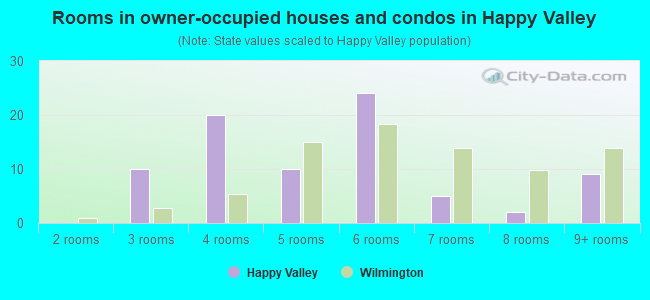
- Rooms in owner-occupied houses and condos in Happy Valley
- 01 room
- 02 rooms
- 103 rooms
- 204 rooms
- 105 rooms
- 246 rooms
- 57 rooms
- 28 rooms
- 99+ rooms
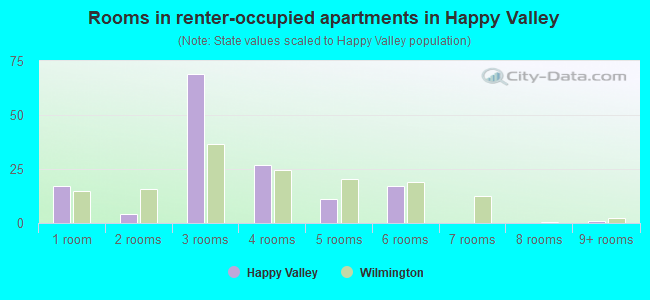
- Rooms in renter-occupied apartments in Happy Valley
- 171 room
- 42 rooms
- 693 rooms
- 274 rooms
- 115 rooms
- 176 rooms
- 07 rooms
- 08 rooms
- 19+ rooms
Owner-occupied
Renter-occupied
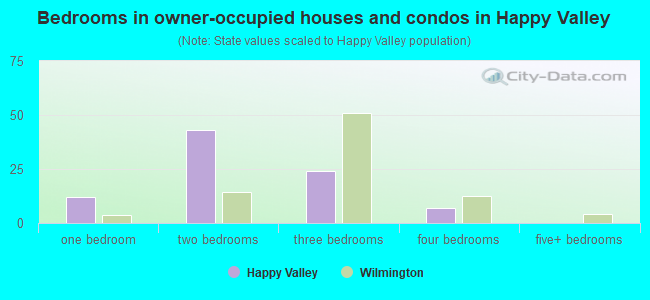
- Bedrooms in owner-occupied houses and condos in Happy Valley
- 0no bedroom
- 121 bedroom
- 432 bedrooms
- 243 bedrooms
- 74 bedrooms
- 05+ bedrooms
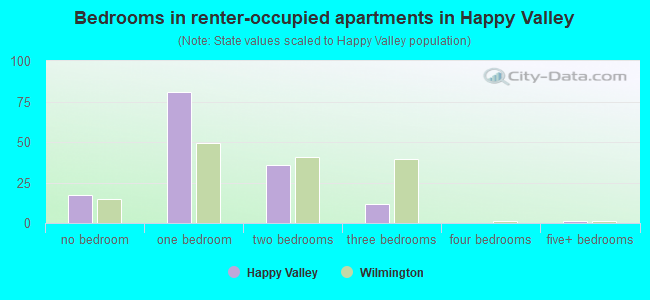
- Bedrooms in renter-occupied apartments in Happy Valley
- 17no bedroom
- 811 bedroom
- 362 bedrooms
- 123 bedrooms
- 04 bedrooms
- 15+ bedrooms
Average number of cars or other vehicles available in houses/condos:
Average number of cars or other vehicles available in apartments:
| This neighborhood: | 1.5 |
| Wilmington: | 1.6 |
Average number of cars or other vehicles available in apartments:
| Here: | 0.8 |
| city: | 0.9 |
Percentage of units with a mortgage:
| Happy Valley: | 50.6% |
| Wilmington: | 67.1% |
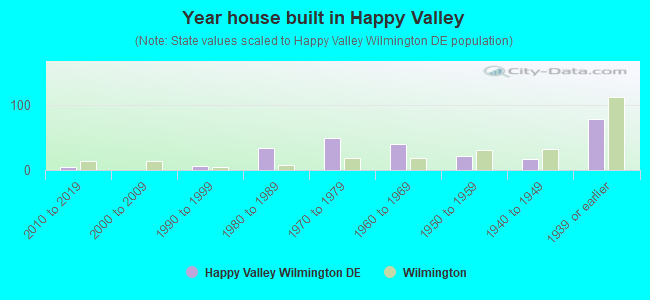
- Year house built in Happy Valley
- 02020 or later
- 52010 to 2019
- 02000 to 2009
- 61990 to 1999
- 341980 to 1989
- 501970 to 1979
- 401960 to 1969
- 221950 to 1959
- 171940 to 1949
- 791939 or earlier
City-data.com crime index for city in 2020 (higher means more crime):
| City: | 649.2 |
| U.S. average: | 219.5 |
Travel time to work (commute)
![Travel time to work (commute)]()
- 5Less than 5 minutes
- 285 to 9 minutes
- 4110 to 14 minutes
- 3615 to 19 minutes
- 3520 to 24 minutes
- 1125 to 29 minutes
- 1330 to 34 minutes
- 335 to 39 minutes
- 340 to 44 minutes
- 1045 to 59 minutes
- 360 to 89 minutes
- 390 or more minutes

Means of transportation to work
![Means of transportation to work]()
- 83.7%131Drove a car alone
- 0.6%1Bus
- 3.2%5Long-distance train or commuter rail
- 3.2%5Walked
- 0.6%1Other means
- 12.1%19Worked at home

Time leaving home to go to work
![Time leaving home to go to work]()
- 612:00 a.m. to 4:59 a.m.
- 25:30 a.m. to 5:59 a.m.
- 66:00 a.m. to 6:29 a.m.
- 176:30 a.m. to 6:59 a.m.
- 237:00 a.m. to 7:29 a.m.
- 417:30 a.m. to 7:59 a.m.
- 198:00 a.m. to 8:29 a.m.
- 138:30 a.m. to 8:59 a.m.
- 199:00 a.m. to 9:59 a.m.
- 1110:00 a.m. to 10:59 a.m.
- 111:00 a.m. to 11:59 a.m.
- 2212:00 p.m. to 3:59 p.m.
- 94:00 p.m. to 11:59 p.m.

Occupations of males:
- Percentage of males in management occupations (except farmers):
Here: 32.9% city: 8.8%
- Percentage of males in business and financial operations occupations:
Here: 4.9% city: 5.8%
- Percentage of males in computer and mathematical occupations:
Here: 12.6% city: 3.9%
- Percentage of males in architecture and engineering occupations:
Here: 1.6% city: 3.0%
- Percentage of males in life, physical, and social science occupations:
Here: 9.5% city: 1.7%
- Percentage of males in legal occupations:
Here: 2.2% city: 3.3%
- Percentage of males in education, training, and library occupations:
Here: 4.6% city: 2.6%
- Percentage of males in arts, design, entertainment, sports, and media occupations:
Here: 10.5% city: 1.7%
- Percentage of males in healthcare practitioners and technical occupations:
Here: 5.0% city: 3.8%
- Percentage of males in service occupations:
Here: 19.5% city: 18.7%
- Percentage of males in sales and office occupations:
Here: 5.4% city: 11.8%
- Percentage of males in production occupations:
Here: 4.9% city: 5.6%
- Percentage of males in material moving occupations:
Here: 7.0% city: 5.8%
Occupations of females:
- Percentage of females in management occupations (except farmers):
Here: 21.8% city: 10.8%
- Percentage of females in business and financial operations occupations:
Here: 12.8% city: 10.0%
- Percentage of females in computer and mathematical occupations:
Here: 12.8% city: 2.3%
- Percentage of females in life, physical, and social science occupations:
Here: 3.0% city: 1.4%
- Percentage of females in community and social services occupations:
Here: 16.9% city: 4.0%
- Percentage of females in legal occupations:
Here: 31.6% city: 2.6%
- Percentage of females in education, training, and library occupations:
Here: 12.8% city: 9.1%
- Percentage of females in arts, design, entertainment, sports, and media occupations:
Here: 20.1% city: 1.4%
- Percentage of females in healthcare practitioners and technical occupations:
Here: 24.1% city: 8.1%
- Percentage of females in service occupations:
Here: 22.0% city: 21.3%
- Percentage of females in sales and office occupations:
Here: 35.6% city: 21.1%
- Percentage of females in production occupations:
Here: 15.8% city: 2.2%
Percentage of people 16-64 in Armed Forces:
| Happy Valley: | 2.7% |
| Wilmington: | 0.4% |
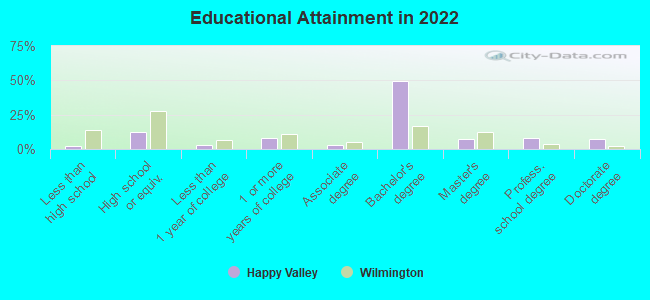
Education in this neighborhood (subdivision or community):
- Percentage of people 3 years and older in K-12 schools:
Happy Valley: 2.3% Wilmington: 16.0%
- Percentage of people 3 years and older in undergraduate colleges:
Happy Valley: 3.3% Wilmington: 3.1%
- Percentage of people 3 years and older in grad. or professional schools:
Happy Valley: 3.3% Wilmington: 2.8%
- Percentage of students K-12 enrolled in private schools:
Happy Valley: 71.4% Wilmington: 8.2%
Percentage of population below poverty level:
| Happy Valley: | 22.5% |
| Wilmington: | 22.2% |
Median year owner moved in (as recorded in 2022):
Median year renter moved in (as recorded in 2022):
| Happy Valley: | 2016 |
| Wilmington: | 2010 |
Median year renter moved in (as recorded in 2022):
| Happy Valley: | 2019 |
| Wilmington: | 2020 |
Percentage of married-couple families with both working:
| Happy Valley: | 100.0% |
| Wilmington: | 84.9% |
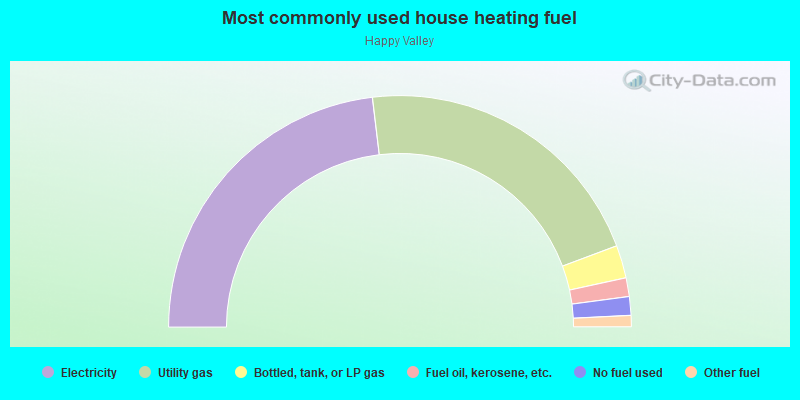
- 46.2%Electricity
- 42.4%Utility gas
- 4.6%Bottled, tank, or LP gas
- 2.6%Fuel oil, kerosene, etc.
- 2.6%No fuel used
- 1.6%Other fuel
Limited-access highways (interstate or state) in this neighborhood:
US Hwy 202 (I- 95)
Length: 0.05 miles
Direction: N-S
Direction: N-S
Roads and streets:
N Jackson St
Length: 0.07 miles
Directions: N-S, SW-NE
Address range: 1502 to 1599
Directions: N-S, SW-NE
Address range: 1502 to 1599
Lovering Ave
Length: 0.03 miles
Direction: SE-NW
Address range: 932 to 1049
Direction: SE-NW
Address range: 932 to 1049
Shallcross Ave
Length: 0.01 miles
Direction: SE-NW
Direction: SE-NW