Hayes Valley neighborhood in San Francisco, California (CA), 94102, 94117 detailed profile
Settings
X


Business Search - 14 Million verified businesses
Area: 0.143 square miles
Population: 4,693
Population density:
| Hayes Valley: | 32,799 people per square mile |
| San Francisco: | 17,313 people per square mile |

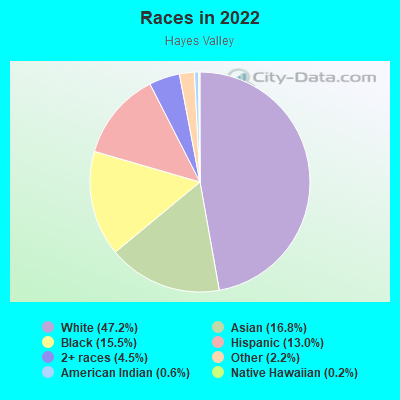
- 2,39147.2%White
- 84916.8%Asian
- 78615.5%Black
- 65813.0%Hispanic or Latino
- 2284.5%Two or more races
- 1132.2%Some other race
- 280.6%American Indian
- 90.2%Native Hawaiian and Other
Pacific Islander
Distribution of median household income
![Distribution of median household income]()
- 155Less than $10,000
- 282$10,000 to $19,999
- 215$20,000 to $29,999
- 243$30,000 to $39,999
- 155$40,000 to $49,999
- 124$50,000 to $59,999
- 243$60,000 to $74,999
- 227$75,000 to $99,999
- 155$100,000 to $124,999
- 353$125,000 to $149,999
- 262$150,000 to $199,999
- 1,013$200,000 or more

Distribution of owner-occupied house/condo value
![Distribution of owner-occupied house/condo value]()
- 58$300,000 to $399,999
- 48$500,000 to $749,999
- 205$750,000 to $999,999
- 518$1,000,000 or more

Distribution of rent paid by renters
![Distribution of rent paid by renters]()
- 89$100 to $199
- 383$200 to $299
- 70$400 to $499
- 179$600 to $699
- 94$700 to $799
- 153$800 to $899
- 159$900 to $999
- 135$1,000 to $1,249
- 242$1,250 to $1,499
- 189$1,500 to $1,999
- 1,314$2,000 or more

Median rent in 2022:
| Hayes Valley: | $2,243 |
| San Francisco: | $2,001 |
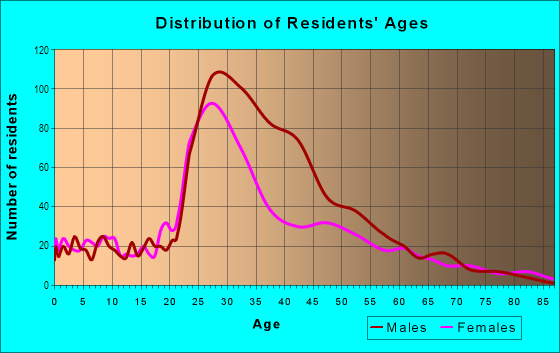
| Males: | 2,606 |
| Females: | 2,087 |
Males:
| This neighborhood: | 35.9 years |
| Whole city: | 40.3 years |
| This neighborhood: | 34.1 years |
| Whole city: | 40.5 years |
Average household size:
| Hayes Valley: | 4.4 people |
| San Francisco: | 2.2 people |
Percentage of family households:
| Hayes Valley: | 29.5% |
| San Francisco: | 30.3% |
| Here: | 26.3% |
| San Francisco: | 35.3% |
Percentage of married-couple families with children (among all households):
| Hayes Valley: | 48.4% |
| San Francisco: | 35.9% |
Percentage of single-mother households (among all households):
| Hayes Valley: | 12.8% |
| San Francisco: | 6.0% |
Percentage of never married males 15 years old and over:
Percentage of never married females 15 years old and over:
| Hayes Valley: | 29.4% |
| San Francisco: | 24.6% |
Percentage of never married females 15 years old and over:
| Hayes Valley: | 25.1% |
| city: | 19.9% |
Percentage of people that speak English not well or not at all:
| Hayes Valley: | 4.1% |
| San Francisco: | 10.9% |
Percentage of people born in this state:
Percentage of people born in another U.S. state:
Percentage of native residents but born outside the U.S.:
Percentage of foreign born residents:
| Here: | 30.2% |
| San Francisco: | 40.8% |
Percentage of people born in another U.S. state:
| Hayes Valley: | 40.0% |
| San Francisco: | 23.4% |
Percentage of native residents but born outside the U.S.:
| Here: | 1.5% |
| city: | 2.6% |
Percentage of foreign born residents:
| Here: | 28.3% |
| San Francisco: | 33.2% |
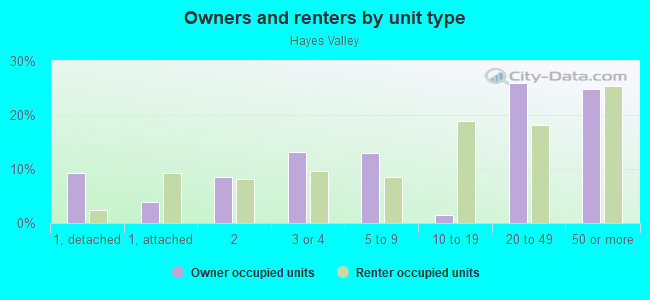
Owner-occupied
Renter-occupied

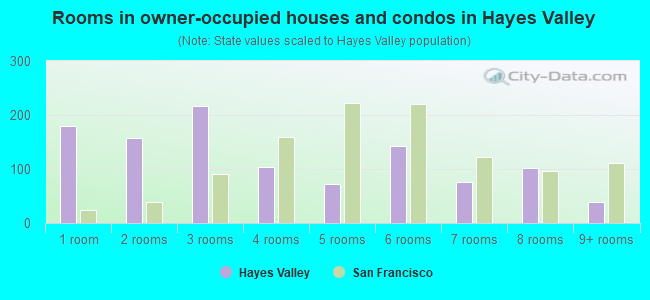
- Rooms in owner-occupied houses and condos in Hayes Valley
- 1801 room
- 1572 rooms
- 2163 rooms
- 1044 rooms
- 725 rooms
- 1426 rooms
- 767 rooms
- 1018 rooms
- 399+ rooms

- Rooms in renter-occupied apartments in Hayes Valley
- 4401 room
- 4012 rooms
- 4623 rooms
- 3904 rooms
- 1975 rooms
- 1716 rooms
- 507 rooms
- 258 rooms
- 09+ rooms
Owner-occupied
Renter-occupied
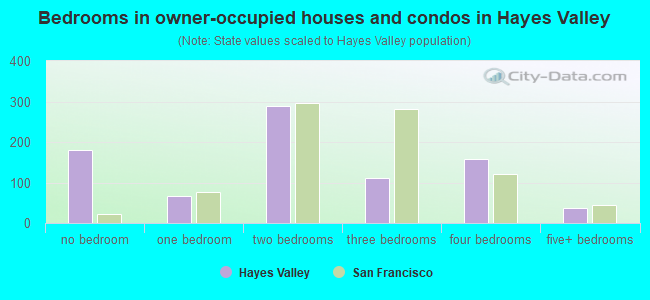
- Bedrooms in owner-occupied houses and condos in Hayes Valley
- 180no bedroom
- 661 bedroom
- 2892 bedrooms
- 1103 bedrooms
- 1594 bedrooms
- 375+ bedrooms
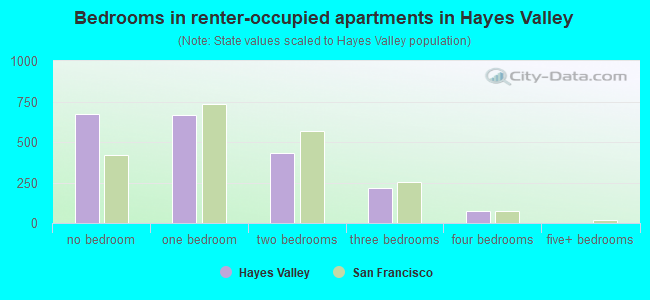
- Bedrooms in renter-occupied apartments in Hayes Valley
- 674no bedroom
- 6681 bedroom
- 4302 bedrooms
- 2143 bedrooms
- 774 bedrooms
- 05+ bedrooms
Average number of cars or other vehicles available in houses/condos:
Average number of cars or other vehicles available in apartments:
| This neighborhood: | 1.3 |
| San Francisco: | 1.5 |
Average number of cars or other vehicles available in apartments:
| Here: | 0.4 |
| city: | 0.8 |
Percentage of units with a mortgage:
| Hayes Valley: | 57.6% |
| San Francisco: | 62.3% |
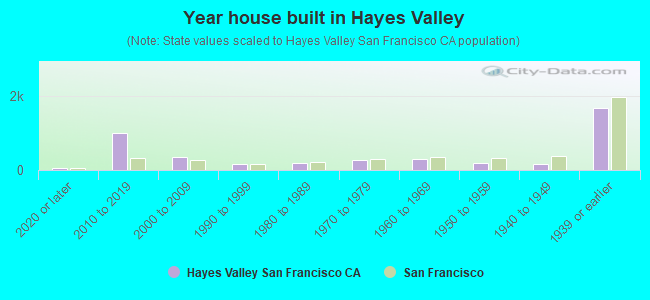
- Year house built in Hayes Valley
- 662020 or later
- 9932010 to 2019
- 3572000 to 2009
- 1591990 to 1999
- 1791980 to 1989
- 2811970 to 1979
- 2901960 to 1969
- 1921950 to 1959
- 1591940 to 1949
- 1,6731939 or earlier
City-data.com crime index for city in 2020 (higher means more crime):
| City: | 387.4 |
| U.S. average: | 219.5 |
Travel time to work (commute)
![Travel time to work (commute)]()
- 77Less than 5 minutes
- 615 to 9 minutes
- 16510 to 14 minutes
- 42115 to 19 minutes
- 41020 to 24 minutes
- 20025 to 29 minutes
- 56730 to 34 minutes
- 9335 to 39 minutes
- 7240 to 44 minutes
- 14745 to 59 minutes
- 25660 to 89 minutes
- 12390 or more minutes

Means of transportation to work
![Means of transportation to work]()
- 18.5%616Drove a car alone
- 4.7%155Carpooled
- 11.0%366Bus
- 12.5%417Subway or elevated rail
- 6.3%211Long-distance train or commuter rail
- 3.0%101Light rail, streetcar or trolley
- 5.3%176Taxi
- 3.4%113Motorcycle
- 11.6%386Bicycle
- 10.7%355Walked
- 3.2%108Other means
- 27.5%915Worked at home

Time leaving home to go to work
![Time leaving home to go to work]()
- 3912:00 a.m. to 4:59 a.m.
- 1716:00 a.m. to 6:29 a.m.
- 906:30 a.m. to 6:59 a.m.
- 1377:00 a.m. to 7:29 a.m.
- 3547:30 a.m. to 7:59 a.m.
- 5278:00 a.m. to 8:29 a.m.
- 3338:30 a.m. to 8:59 a.m.
- 6029:00 a.m. to 9:59 a.m.
- 14010:00 a.m. to 10:59 a.m.
- 8212:00 p.m. to 3:59 p.m.
- 774:00 p.m. to 11:59 p.m.

Occupations of males:
- Percentage of males in management occupations (except farmers):
Here: 18.9% city: 17.2%
- Percentage of males in business and financial operations occupations:
Here: 14.9% city: 8.9%
- Percentage of males in computer and mathematical occupations:
Here: 24.8% city: 14.6%
- Percentage of males in architecture and engineering occupations:
Here: 2.9% city: 4.0%
- Percentage of males in life, physical, and social science occupations:
Here: 3.6% city: 2.4%
- Percentage of males in legal occupations:
Here: 3.0% city: 2.5%
- Percentage of males in education, training, and library occupations:
Here: 7.0% city: 3.4%
- Percentage of males in arts, design, entertainment, sports, and media occupations:
Here: 6.3% city: 4.9%
- Percentage of males in healthcare practitioners and technical occupations:
Here: 2.1% city: 3.2%
- Percentage of males in service occupations:
Here: 4.8% city: 11.8%
- Percentage of males in sales and office occupations:
Here: 5.1% city: 13.5%
- Percentage of males in transportation occupations:
Here: 3.4% city: 3.4%
Occupations of females:
- Percentage of females in management occupations (except farmers):
Here: 11.2% city: 15.8%
- Percentage of females in business and financial operations occupations:
Here: 15.5% city: 11.5%
- Percentage of females in computer and mathematical occupations:
Here: 8.0% city: 5.1%
- Percentage of females in life, physical, and social science occupations:
Here: 3.9% city: 2.9%
- Percentage of females in legal occupations:
Here: 2.7% city: 3.0%
- Percentage of females in education, training, and library occupations:
Here: 9.2% city: 7.1%
- Percentage of females in arts, design, entertainment, sports, and media occupations:
Here: 11.4% city: 5.1%
- Percentage of females in healthcare practitioners and technical occupations:
Here: 2.6% city: 8.4%
- Percentage of females in service occupations:
Here: 8.6% city: 15.4%
- Percentage of females in sales and office occupations:
Here: 23.9% city: 19.3%
- Percentage of females in production occupations:
Here: 1.8% city: 1.5%
Percentage of people 16-64 in Armed Forces:
| Hayes Valley: | 2.0% |
| San Francisco: | 0.1% |
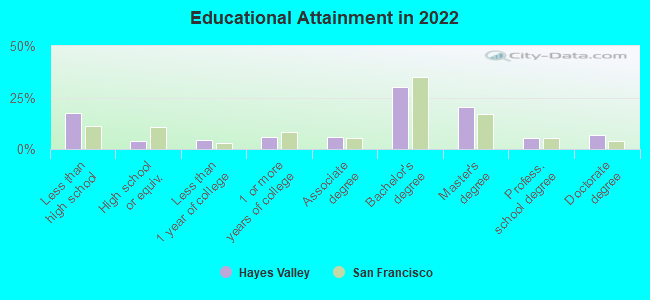
Education in this neighborhood (subdivision or community):
- Percentage of people 3 years and older in K-12 schools:
Hayes Valley: 9.8% San Francisco: 9.7%
- Percentage of people 3 years and older in undergraduate colleges:
Hayes Valley: 9.1% San Francisco: 4.8%
- Percentage of people 3 years and older in grad. or professional schools:
Hayes Valley: 20.8% San Francisco: 2.6%
- Percentage of students K-12 enrolled in private schools:
Hayes Valley: 23.3% San Francisco: 36.5%
Percentage of population below poverty level:
| Hayes Valley: | 11.3% |
| San Francisco: | 10.4% |
Median year renter moved in (as recorded in 2022):
| Hayes Valley: | 2014 |
| San Francisco: | 2019 |
Percentage of married-couple families with both working:
| Hayes Valley: | 115.1% |
| San Francisco: | 75.9% |
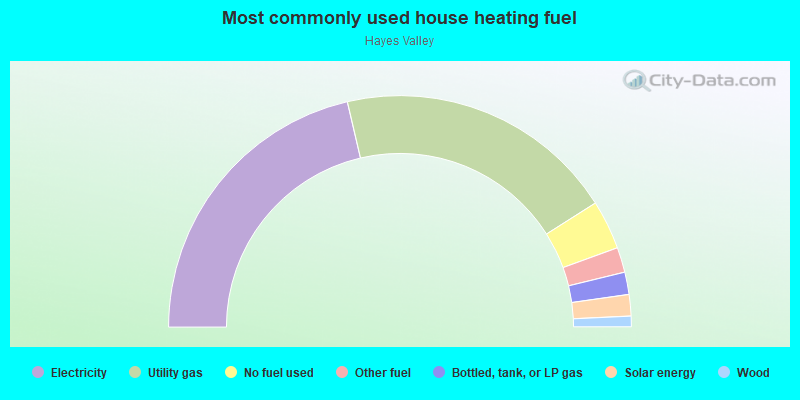
- 42.7%Electricity
- 39.3%Utility gas
- 6.9%No fuel used
- 3.5%Other fuel
- 3.1%Bottled, tank, or LP gas
- 3.0%Solar energy
- 1.5%Wood
Roads and streets:
Hickory St
Length: 0.57 miles
Direction: E-W
Address range: 201 to 599
Direction: E-W
Address range: 201 to 599
Linden St
Length: 0.57 miles
Direction: E-W
Address range: 200 to 687
Direction: E-W
Address range: 200 to 687
Hayes St
Length: 0.57 miles
Direction: E-W
Address range: 300 to 799
Direction: E-W
Address range: 300 to 799
Oak St
Length: 0.57 miles
Direction: E-W
Address range: 100 to 599
Direction: E-W
Address range: 100 to 599
Fell St
Length: 0.57 miles
Direction: E-W
Address range: 200 to 699
Direction: E-W
Address range: 200 to 699
Ivy St
Length: 0.57 miles
Direction: E-W
Address range: 200 to 699
Direction: E-W
Address range: 200 to 699
Grove St
Length: 0.57 miles
Direction: E-W
Address range: 300 to 799
Direction: E-W
Address range: 300 to 799
Webster St
Length: 0.24 miles
Directions: N-S, SE-NW, SW-NE
Address range: 400 to 699
Directions: N-S, SE-NW, SW-NE
Address range: 400 to 699
Laguna St
Length: 0.23 miles
Direction: N-S
Address range: 400 to 750
Direction: N-S
Address range: 400 to 750
Octavia St
Length: 0.23 miles
Direction: N-S
Address range: 300 to 649
Direction: N-S
Address range: 300 to 649
Buchanan St
Length: 0.23 miles
Direction: N-S
Address range: 500 to 849
Direction: N-S
Address range: 500 to 849
Birch St
Length: 0.21 miles
Direction: E-W
Address range: 500 to 699
Direction: E-W
Address range: 500 to 699
Gough St
Length: 0.20 miles
Direction: N-S
Address range: 200 to 499
Direction: N-S
Address range: 200 to 499
Franklin St
Length: 0.20 miles
Direction: N-S
Address range: 100 to 399
Direction: N-S
Address range: 100 to 399