Heritage District neighborhood in Maywood, Illinois (IL), 60153 detailed profile
Settings
X


Business Search - 14 Million verified businesses
Area: 0.381 square miles
Population: 3,735
Population density:
| Heritage District: | 9,804 people per square mile |
| Maywood: | 8,636 people per square mile |

- 2,05754.3%Black
- 1,39536.8%Hispanic or Latino
- 1594.2%White
- 1143.0%Two or more races
- 240.6%American Indian
- 240.6%Asian
- 180.5%Some other race

Distribution of median household income
![Distribution of median household income]()
- 80Less than $10,000
- 104$10,000 to $19,999
- 68$20,000 to $29,999
- 91$30,000 to $39,999
- 190$40,000 to $49,999
- 121$50,000 to $59,999
- 129$60,000 to $74,999
- 181$75,000 to $99,999
- 85$100,000 to $124,999
- 70$125,000 to $149,999
- 82$150,000 to $199,999
- 59$200,000 or more

Distribution of owner-occupied house/condo value
![Distribution of owner-occupied house/condo value]()
- 59Less than $50,000
- 74$50,000 to $99,999
- 141$100,000 to $149,999
- 291$150,000 to $199,999
- 126$200,000 to $249,999
- 95$250,000 to $299,999
- 46$300,000 to $399,999
- 37$1,000,000 or more

Distribution of rent paid by renters
![Distribution of rent paid by renters]()
- 43$100 to $199
- 39$200 to $299
- 26$300 to $399
- 29$400 to $499
- 22$500 to $599
- 188$600 to $699
- 23$700 to $799
- 77$800 to $899
- 157$900 to $999
- 107$1,000 to $1,249
- 70$1,250 to $1,499
- 35$1,500 to $1,999

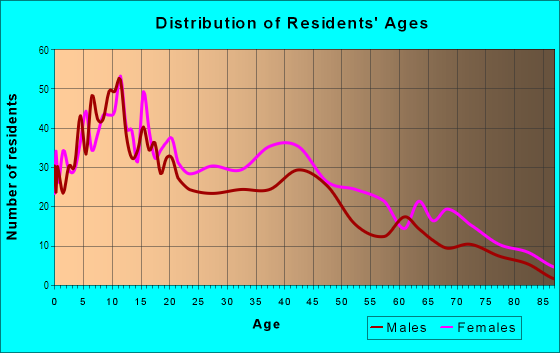
| Males: | 1,882 |
| Females: | 1,852 |
Males:
| This neighborhood: | 34.3 years |
| Whole city: | 34.8 years |
| This neighborhood: | 37.0 years |
| Whole city: | 40.6 years |
Average household size:
| Heritage District: | 3.2 people |
| Maywood: | 33.0 people |
Percentage of family households:
| Heritage District: | 53.0% |
| Maywood: | 47.2% |
| Here: | 37.3% |
| Maywood: | 36.1% |
Percentage of married-couple families with children (among all households):
| Heritage District: | 15.4% |
| Maywood: | 15.9% |
Percentage of single-mother households (among all households):
| Heritage District: | 10.6% |
| Maywood: | 13.6% |
Percentage of never married males 15 years old and over:
Percentage of never married females 15 years old and over:
| Heritage District: | 23.6% |
| Maywood: | 22.4% |
Percentage of never married females 15 years old and over:
| Heritage District: | 25.1% |
| village: | 22.9% |
Percentage of people that speak English not well or not at all:
| Heritage District: | 5.8% |
| Maywood: | 6.1% |
Percentage of people born in this state:
Percentage of people born in another U.S. state:
Percentage of native residents but born outside the U.S.:
Percentage of foreign born residents:
| Here: | 72.4% |
| Maywood: | 69.5% |
Percentage of people born in another U.S. state:
| Heritage District: | 10.5% |
| Maywood: | 14.9% |
Percentage of native residents but born outside the U.S.:
| Here: | 3.1% |
| village: | 2.4% |
Percentage of foreign born residents:
| Here: | 14.1% |
| Maywood: | 13.2% |

Owner-occupied
Renter-occupied


- Rooms in owner-occupied houses and condos in Heritage District
- 01 room
- 1422 rooms
- 03 rooms
- 744 rooms
- 1785 rooms
- 1346 rooms
- 1157 rooms
- 1078 rooms
- 889+ rooms

- Rooms in renter-occupied apartments in Heritage District
- 101 room
- 422 rooms
- 1223 rooms
- 1744 rooms
- 1175 rooms
- 856 rooms
- 437 rooms
- 08 rooms
- 839+ rooms
Owner-occupied
Renter-occupied

- Bedrooms in owner-occupied houses and condos in Heritage District
- 0no bedroom
- 901 bedroom
- 1462 bedrooms
- 3033 bedrooms
- 1034 bedrooms
- 715+ bedrooms

- Bedrooms in renter-occupied apartments in Heritage District
- 18no bedroom
- 351 bedroom
- 2402 bedrooms
- 1543 bedrooms
- 814 bedrooms
- 395+ bedrooms
Average number of cars or other vehicles available in houses/condos:
Average number of cars or other vehicles available in apartments:
| This neighborhood: | 2.2 |
| Maywood: | 2.1 |
Average number of cars or other vehicles available in apartments:
| Here: | |
| village: |
Percentage of units with a mortgage:
| Heritage District: | 75.0% |
| Maywood: | 66.9% |
Housing prices:
- Average estimated value of detached houses in 2022 (63.7% of all units):
Heritage District: $180,905 Illinois: $310,164
- Average estimated value of townhouses or other attached units in 2022 (2.8% of all units):
This neighborhood: $235,040 Illinois: $286,230
- Average estimated value of housing units in 2-unit structures in 2022 (19.9% of all units):
This neighborhood: $180,297 Illinois: $299,638

- Year house built in Heritage District
- 02020 or later
- 52010 to 2019
- 622000 to 2009
- 141990 to 1999
- 501980 to 1989
- 1611970 to 1979
- 1691960 to 1969
- 1041950 to 1959
- 961940 to 1949
- 8421939 or earlier

City-data.com crime index for village in 2020 (higher means more crime):
| City: | 501.0 |
| U.S. average: | 219.5 |
Travel time to work (commute)
![Travel time to work (commute)]()
- 365 to 9 minutes
- 11710 to 14 minutes
- 11715 to 19 minutes
- 20120 to 24 minutes
- 8025 to 29 minutes
- 25230 to 34 minutes
- 4335 to 39 minutes
- 9540 to 44 minutes
- 14145 to 59 minutes
- 32160 to 89 minutes
- 9590 or more minutes

Means of transportation to work
![Means of transportation to work]()
- 74.7%1,152Drove a car alone
- 8.8%135Carpooled
- 4.1%63Bus
- 0.6%10Subway or elevated rail
- 4.7%72Long-distance train or commuter rail
- 1.7%26Walked
- 0.8%12Other means
- 8.7%134Worked at home

Time leaving home to go to work
![Time leaving home to go to work]()
- 7512:00 a.m. to 4:59 a.m.
- 1535:00 a.m. to 5:29 a.m.
- 335:30 a.m. to 5:59 a.m.
- 1446:00 a.m. to 6:29 a.m.
- 1386:30 a.m. to 6:59 a.m.
- 2927:00 a.m. to 7:29 a.m.
- 1407:30 a.m. to 7:59 a.m.
- 928:00 a.m. to 8:29 a.m.
- 458:30 a.m. to 8:59 a.m.
- 439:00 a.m. to 9:59 a.m.
- 1610:00 a.m. to 10:59 a.m.
- 6311:00 a.m. to 11:59 a.m.
- 9812:00 p.m. to 3:59 p.m.
- 1264:00 p.m. to 11:59 p.m.

Occupations of males:
- Percentage of males in management occupations (except farmers):
Here: 8.6% village: 4.7%
- Percentage of males in business and financial operations occupations:
Here: 1.6% village: 1.9%
- Percentage of males in computer and mathematical occupations:
Here: 5.1% village: 2.8%
- Percentage of males in architecture and engineering occupations:
Here: 5.1% village: 3.2%
- Percentage of males in education, training, and library occupations:
Here: 1.6% village: 1.2%
- Percentage of males in arts, design, entertainment, sports, and media occupations:
Here: 1.4% village: 0.7%
- Percentage of males in healthcare practitioners and technical occupations:
Here: 1.7% village: 1.3%
- Percentage of males in service occupations:
Here: 22.5% village: 16.7%
- Percentage of males in sales and office occupations:
Here: 12.1% village: 14.7%
- Percentage of males in construction, extraction, and maintenance occupations:
Here: 3.3% village: 11.3%
- Percentage of males in production occupations:
Here: 17.7% village: 16.3%
- Percentage of males in transportation occupations:
Here: 8.8% village: 8.0%
- Percentage of males in material moving occupations:
Here: 4.3% village: 9.1%
Occupations of females:
- Percentage of females in management occupations (except farmers):
Here: 1.5% village: 3.1%
- Percentage of females in business and financial operations occupations:
Here: 11.6% village: 8.2%
- Percentage of females in architecture and engineering occupations:
Here: 1.1% village: 0.8%
- Percentage of females in community and social services occupations:
Here: 5.1% village: 4.3%
- Percentage of females in legal occupations:
Here: 1.9% village: 0.3%
- Percentage of females in education, training, and library occupations:
Here: 2.5% village: 3.9%
- Percentage of females in healthcare practitioners and technical occupations:
Here: 5.0% village: 6.3%
- Percentage of females in service occupations:
Here: 21.0% village: 19.9%
- Percentage of females in sales and office occupations:
Here: 38.2% village: 35.6%
- Percentage of females in production occupations:
Here: 7.3% village: 9.2%
- Percentage of females in transportation occupations:
Here: 1.8% village: 2.6%
- Percentage of females in material moving occupations:
Here: 1.9% village: 2.9%
Percentage of people 16-64 in Armed Forces:
| Heritage District: | 0.1% |
| Maywood: | 0.1% |
Education in this neighborhood (subdivision or community):
- Percentage of people 3 years and older in K-12 schools:
Heritage District: 24.8% Maywood: 18.4%
- Percentage of people 3 years and older in undergraduate colleges:
Heritage District: 8.0% Maywood: 6.6%
- Percentage of people 3 years and older in grad. or professional schools:
Heritage District: 0.7% Maywood: 0.9%
- Percentage of students K-12 enrolled in private schools:
Heritage District: 51.2% Maywood: 8.9%
Percentage of population below poverty level:
| Heritage District: | 18.0% |
| Maywood: | 15.2% |
Median year owner moved in (as recorded in 2022):
| Heritage District: | 2002 |
| Maywood: | 2000 |
Percentage of married-couple families with both working:
| Heritage District: | 80.8% |
| Maywood: | 73.0% |

- 77.0%Utility gas
- 14.4%Electricity
- 5.8%Other fuel
- 2.2%Bottled, tank, or LP gas
- 0.5%No fuel used
Roads and streets:
Madison St
Length: 0.77 miles
Direction: E-W
Address range: 800 to 1698
Direction: E-W
Address range: 800 to 1698
Warren Ave (Warren St)
Length: 0.74 miles
Direction: E-W
Address range: 800 to 1651
Direction: E-W
Address range: 800 to 1651
Oak St
Length: 0.73 miles
Direction: E-W
Address range: 800 to 1649
Direction: E-W
Address range: 800 to 1649
Randolph St
Length: 0.73 miles
Direction: E-W
Address range: 800 to 1649
Direction: E-W
Address range: 800 to 1649
Washington Blvd
Length: 0.69 miles
Direction: E-W
Address range: 800 to 1599
Direction: E-W
Address range: 800 to 1599
S 16th Ave
Length: 0.65 miles
Direction: N-S
Address range: 100 to 949
Direction: N-S
Address range: 100 to 949
S 15th Ave
Length: 0.65 miles
Direction: N-S
Address range: 100 to 899
Direction: N-S
Address range: 100 to 899
S 12th Ave
Length: 0.64 miles
Direction: N-S
Address range: 100 to 939
Direction: N-S
Address range: 100 to 939
S 11th Ave
Length: 0.64 miles
Direction: N-S
Address range: 100 to 981
Direction: N-S
Address range: 100 to 981
S 10th Ave
Length: 0.63 miles
Direction: N-S
Address range: 100 to 999
Direction: N-S
Address range: 100 to 999
S 9th Ave
Length: 0.63 miles
Direction: N-S
Address range: 100 to 999
Direction: N-S
Address range: 100 to 999
S 8th Ave
Length: 0.63 miles
Direction: N-S
Address range: 100 to 999
Direction: N-S
Address range: 100 to 999
S 14th Ave
Length: 0.61 miles
Direction: N-S
Address range: 122 to 939
Direction: N-S
Address range: 122 to 939
S 13th Ave
Length: 0.61 miles
Direction: N-S
Address range: 122 to 939
Direction: N-S
Address range: 122 to 939
St Charles Rd
Length: 0.43 miles
Direction: E-W
Address range: 800 to 1599
Direction: E-W
Address range: 800 to 1599
School St
Length: 0.30 miles
Directions: E-W, SW-NE
Address range: 800 to 1699
Directions: E-W, SW-NE
Address range: 800 to 1699
Pine St
Length: 0.26 miles
Direction: E-W
Address range: 800 to 1099
Direction: E-W
Address range: 800 to 1099
Maple St
Length: 0.26 miles
Direction: E-W
Address range: 800 to 1099
Direction: E-W
Address range: 800 to 1099
Walnut St
Length: 0.17 miles
Direction: E-W
Address range: 800 to 999
Direction: E-W
Address range: 800 to 999