Hidden Creek neighborhood in Hatboro, Pennsylvania (PA), 19040 detailed profile
Settings
X


Business Search - 14 Million verified businesses
Area: 0.139 square miles
Population: 429
Population density:
| Hidden Creek: | 3,075 people per square mile |
| Hatboro: | 5,770 people per square mile |

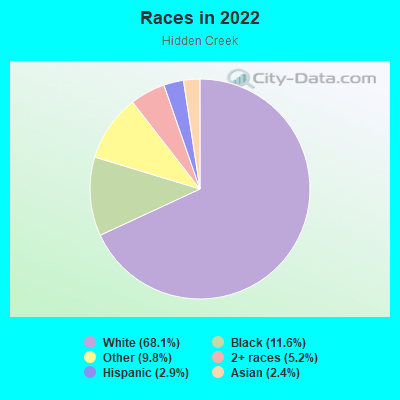
- 37068.1%White
- 6311.6%Black
- 539.8%Some other race
- 285.2%Two or more races
- 162.9%Hispanic or Latino
- 132.4%Asian
Median household income in 2022:
| Hidden Creek: | $135,620 |
| Hatboro: | $106,318 |
Distribution of median household income
![Distribution of median household income]()
- 14Less than $10,000
- 4$10,000 to $19,999
- 6$20,000 to $29,999
- 2$30,000 to $39,999
- 5$40,000 to $49,999
- 6$50,000 to $59,999
- 3$60,000 to $74,999
- 8$75,000 to $99,999
- 19$100,000 to $124,999
- 18$125,000 to $149,999
- 44$150,000 to $199,999
- 33$200,000 or more

Distribution of owner-occupied house/condo value
![Distribution of owner-occupied house/condo value]()
- 17Less than $50,000
- 5$50,000 to $99,999
- 3$150,000 to $199,999
- 6$200,000 to $249,999
- 13$250,000 to $299,999
- 34$300,000 to $399,999
- 54$400,000 to $499,999
- 12$500,000 to $749,999
- 6$750,000 to $999,999
- 9$1,000,000 or more

Distribution of rent paid by renters
![Distribution of rent paid by renters]()
- 37$700 to $799
- 42$900 to $999
- 91$1,000 to $1,249
- 2$1,250 to $1,499
- 6$1,500 to $1,999
- 2$2,000 or more

Median rent in 2022:
| Hidden Creek: | $1,726 |
| Hatboro: | $1,588 |
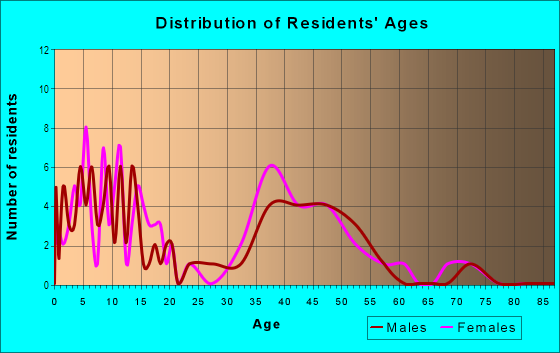
| Males: | 202 |
| Females: | 226 |
Males:
| This neighborhood: | 35.5 years |
| Whole city: | 36.6 years |
| This neighborhood: | 34.1 years |
| Whole city: | 35.7 years |
Average household size:
| Hidden Creek: | 3.2 people |
| Hatboro: | 2.6 people |
Percentage of family households:
| Hidden Creek: | 51.2% |
| Hatboro: | 49.3% |
| Here: | 74.4% |
| Hatboro: | 50.7% |
Percentage of married-couple families with children (among all households):
| Hidden Creek: | 26.0% |
| Hatboro: | 29.3% |
Percentage of single-mother households (among all households):
| Hidden Creek: | 5.8% |
| Hatboro: | 5.0% |
Percentage of never married males 15 years old and over:
Percentage of never married females 15 years old and over:
| Hidden Creek: | 15.6% |
| Hatboro: | 17.5% |
Percentage of never married females 15 years old and over:
| Hidden Creek: | 17.7% |
| borough: | 17.6% |
Percentage of people that speak English not well or not at all:
| Hidden Creek: | 1.8% |
| Hatboro: | 2.7% |
Percentage of people born in this state:
Percentage of people born in another U.S. state:
Percentage of native residents but born outside the U.S.:
Percentage of foreign born residents:
| Here: | 76.8% |
| Hatboro: | 76.8% |
Percentage of people born in another U.S. state:
| Hidden Creek: | 8.6% |
| Hatboro: | 13.9% |
Percentage of native residents but born outside the U.S.:
| Here: | 0.7% |
| borough: | 0.7% |
Percentage of foreign born residents:
| Here: | 13.9% |
| Hatboro: | 8.5% |
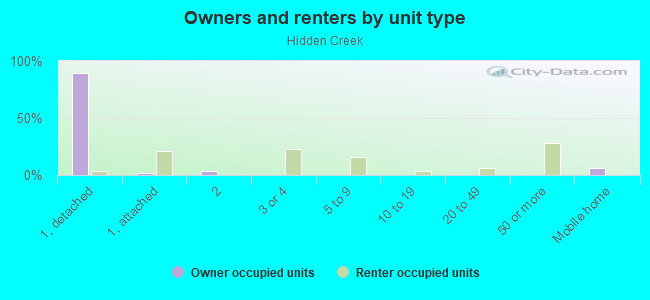
Owner-occupied
Renter-occupied

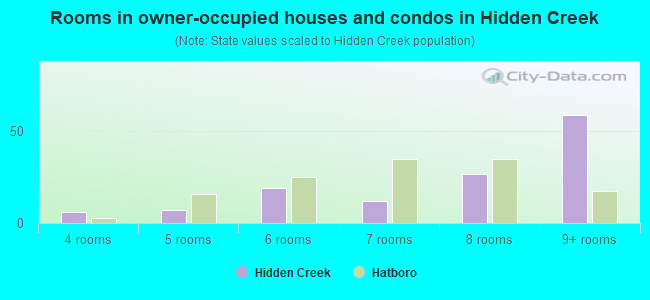
- Rooms in owner-occupied houses and condos in Hidden Creek
- 01 room
- 02 rooms
- 03 rooms
- 64 rooms
- 75 rooms
- 196 rooms
- 127 rooms
- 278 rooms
- 599+ rooms
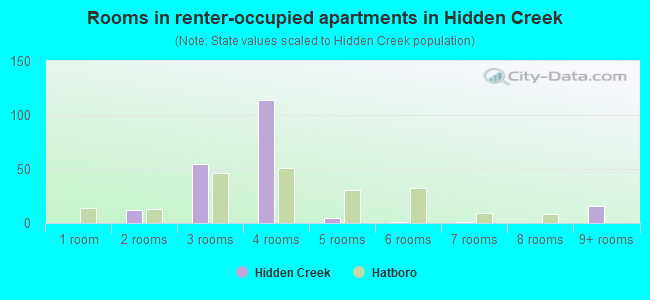
- Rooms in renter-occupied apartments in Hidden Creek
- 01 room
- 122 rooms
- 553 rooms
- 1144 rooms
- 55 rooms
- 16 rooms
- 17 rooms
- 08 rooms
- 169+ rooms
Owner-occupied
Renter-occupied
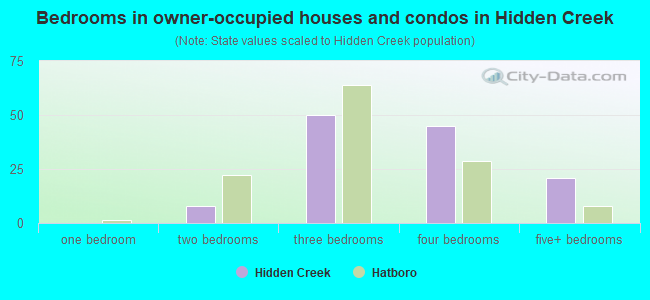
- Bedrooms in owner-occupied houses and condos in Hidden Creek
- 0no bedroom
- 01 bedroom
- 82 bedrooms
- 503 bedrooms
- 454 bedrooms
- 215+ bedrooms
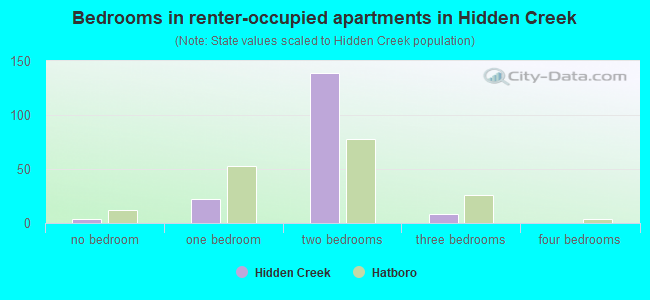
- Bedrooms in renter-occupied apartments in Hidden Creek
- 4no bedroom
- 221 bedroom
- 1392 bedrooms
- 83 bedrooms
- 04 bedrooms
- 05+ bedrooms
Average number of cars or other vehicles available in houses/condos:
Average number of cars or other vehicles available in apartments:
| This neighborhood: | 2.4 |
| Hatboro: | 2.3 |
Average number of cars or other vehicles available in apartments:
| Here: | 1.2 |
| borough: | 1.5 |
Percentage of units with a mortgage:
| Hidden Creek: | 65.5% |
| Hatboro: | 83.6% |
Average estimated value of detached houses in 2022 (97.0% of all units):
| Hidden Creek: | $304,881 |
| Pennsylvania: | $317,202 |
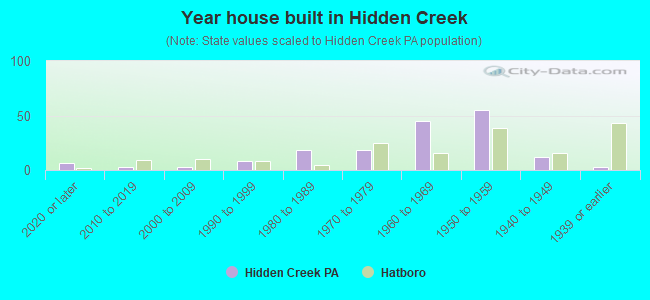
- Year house built in Hidden Creek
- 62020 or later
- 32010 to 2019
- 32000 to 2009
- 81990 to 1999
- 181980 to 1989
- 181970 to 1979
- 451960 to 1969
- 551950 to 1959
- 121940 to 1949
- 31939 or earlier
City-data.com crime index for borough in 2020 (higher means more crime):
| City: | 20.0 |
| U.S. average: | 219.5 |
Travel time to work (commute)
![Travel time to work (commute)]()
- 4Less than 5 minutes
- 225 to 9 minutes
- 1510 to 14 minutes
- 3815 to 19 minutes
- 2020 to 24 minutes
- 925 to 29 minutes
- 2030 to 34 minutes
- 1135 to 39 minutes
- 1440 to 44 minutes
- 1745 to 59 minutes
- 2560 to 89 minutes
- 290 or more minutes

Means of transportation to work
![Means of transportation to work]()
- 73.2%186Drove a car alone
- 6.7%17Carpooled
- 15.7%40Bus
- 0.8%2Subway or elevated rail
- 4.7%12Long-distance train or commuter rail
- 0.4%1Bicycle
- 14.9%38Worked at home

Time leaving home to go to work
![Time leaving home to go to work]()
- 412:00 a.m. to 4:59 a.m.
- 105:00 a.m. to 5:29 a.m.
- 165:30 a.m. to 5:59 a.m.
- 196:00 a.m. to 6:29 a.m.
- 176:30 a.m. to 6:59 a.m.
- 487:00 a.m. to 7:29 a.m.
- 217:30 a.m. to 7:59 a.m.
- 148:00 a.m. to 8:29 a.m.
- 138:30 a.m. to 8:59 a.m.
- 59:00 a.m. to 9:59 a.m.
- 1010:00 a.m. to 10:59 a.m.
- 111:00 a.m. to 11:59 a.m.
- 912:00 p.m. to 3:59 p.m.
- 64:00 p.m. to 11:59 p.m.

Occupations of males:
- Percentage of males in management occupations (except farmers):
Here: 10.0% borough: 11.2%
- Percentage of males in business and financial operations occupations:
Here: 15.9% borough: 4.5%
- Percentage of males in computer and mathematical occupations:
Here: 11.9% borough: 5.6%
- Percentage of males in architecture and engineering occupations:
Here: 2.2% borough: 0.4%
- Percentage of males in healthcare practitioners and technical occupations:
Here: 1.9% borough: 4.1%
- Percentage of males in service occupations:
Here: 1.8% borough: 12.8%
- Percentage of males in sales and office occupations:
Here: 20.1% borough: 18.0%
- Percentage of males in construction, extraction, and maintenance occupations:
Here: 11.4% borough: 7.1%
- Percentage of males in production occupations:
Here: 10.5% borough: 3.1%
- Percentage of males in transportation occupations:
Here: 9.6% borough: 5.3%
Occupations of females:
- Percentage of females in management occupations (except farmers):
Here: 12.8% borough: 8.0%
- Percentage of females in business and financial operations occupations:
Here: 9.8% borough: 9.0%
- Percentage of females in computer and mathematical occupations:
Here: 2.1% borough: 2.5%
- Percentage of females in architecture and engineering occupations:
Here: 3.1% borough: 1.8%
- Percentage of females in life, physical, and social science occupations:
Here: 6.5% borough: 1.0%
- Percentage of females in community and social services occupations:
Here: 2.2% borough: 4.5%
- Percentage of females in legal occupations:
Here: 1.8% borough: 0.8%
- Percentage of females in education, training, and library occupations:
Here: 3.5% borough: 6.7%
- Percentage of females in arts, design, entertainment, sports, and media occupations:
Here: 1.2% borough: 1.8%
- Percentage of females in healthcare practitioners and technical occupations:
Here: 17.7% borough: 16.5%
- Percentage of females in service occupations:
Here: 11.7% borough: 15.8%
- Percentage of females in sales and office occupations:
Here: 27.1% borough: 28.7%
- Percentage of females in production occupations:
Here: 4.1% borough: 0.3%
- Percentage of females in transportation occupations:
Here: 6.0% borough: 0.0%
Percentage of people 16-64 in Armed Forces:
| Hidden Creek: | 0.1% |
| Hatboro: | 0.0% |
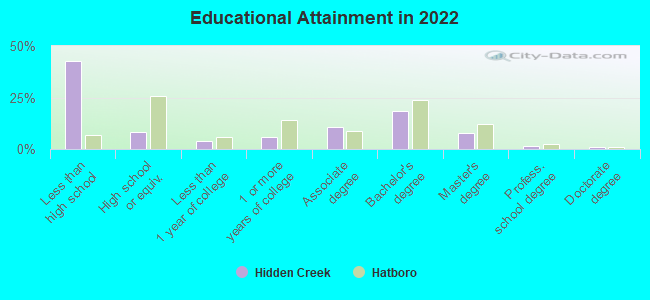
Education in this neighborhood (subdivision or community):
- Percentage of people 3 years and older in K-12 schools:
Hidden Creek: 15.7% Hatboro: 15.9%
- Percentage of people 3 years and older in undergraduate colleges:
Hidden Creek: 4.6% Hatboro: 3.4%
- Percentage of people 3 years and older in grad. or professional schools:
Hidden Creek: 3.9% Hatboro: 1.2%
- Percentage of students K-12 enrolled in private schools:
Hidden Creek: 16.9% Hatboro: 4.6%
Percentage of population below poverty level:
| Hidden Creek: | 1.4% |
| Hatboro: | 7.9% |
Median year owner moved in (as recorded in 2022):
Median year renter moved in (as recorded in 2022):
| Hidden Creek: | 2004 |
| Hatboro: | 2010 |
Median year renter moved in (as recorded in 2022):
| Hidden Creek: | 2013 |
| Hatboro: | 2017 |
Percentage of married-couple families with both working:
| Hidden Creek: | 66.3% |
| Hatboro: | 73.8% |
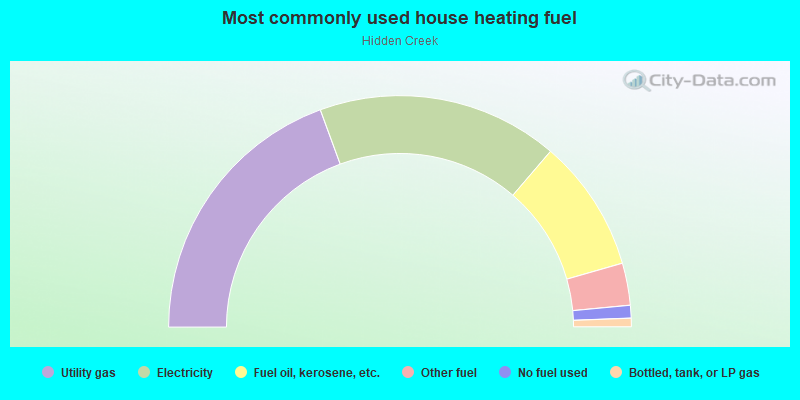
- 38.9%Utility gas
- 33.8%Electricity
- 18.6%Fuel oil, kerosene, etc.
- 5.9%Other fuel
- 1.8%No fuel used
- 1.2%Bottled, tank, or LP gas
Roads and streets:
Hidden Creek Dr
Length: 0.70 miles
Directions: E-W, N-S, SE-NW, SW-NE
Address range: 100 to 399
Directions: E-W, N-S, SE-NW, SW-NE
Address range: 100 to 399
Tamarack Cir
Length: 0.36 miles
Directions: E-W, N-S, SE-NW, SW-NE
Address range: 105 to 199
Directions: E-W, N-S, SE-NW, SW-NE
Address range: 105 to 199
Cypress Ln
Length: 0.30 miles
Directions: E-W, N-S, SE-NW, SW-NE
Address range: 204 to 299
Directions: E-W, N-S, SE-NW, SW-NE
Address range: 204 to 299
Aspen Ln
Length: 0.24 miles
Directions: E-W, N-S, SE-NW, SW-NE
Address range: 405 to 499
Directions: E-W, N-S, SE-NW, SW-NE
Address range: 405 to 499
Hemlock Dr
Length: 0.14 miles
Direction: SE-NW
Address range: 300 to 399
Direction: SE-NW
Address range: 300 to 399
W Moreland Ave
Length: 0.13 miles
Direction: SE-NW
Direction: SE-NW