Hidden Lake neighborhood in Westminster, Colorado (CO), 80030 detailed profile
Settings
X


Business Search - 14 Million verified businesses
Area: 0.109 square miles
Population: 613
Population density:
| Hidden Lake: | 5,649 people per square mile |
| Westminster: | 3,636 people per square mile |

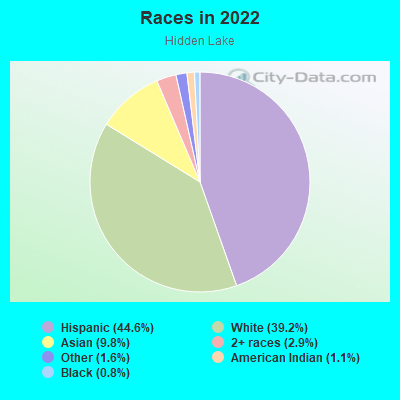
- 28144.6%Hispanic or Latino
- 24739.2%White
- 629.8%Asian
- 182.9%Two or more races
- 101.6%Some other race
- 71.1%American Indian
- 50.8%Black
Median household income in 2022:
| Hidden Lake: | $80,496 |
| Westminster: | $101,529 |
Distribution of median household income
![Distribution of median household income]()
- 15Less than $10,000
- 16$10,000 to $19,999
- 12$20,000 to $29,999
- 10$30,000 to $39,999
- 16$40,000 to $49,999
- 15$50,000 to $59,999
- 21$60,000 to $74,999
- 25$75,000 to $99,999
- 23$100,000 to $124,999
- 38$125,000 to $149,999
- 22$150,000 to $199,999
- 21$200,000 or more

Distribution of owner-occupied house/condo value
![Distribution of owner-occupied house/condo value]()
- 25Less than $50,000
- 8$50,000 to $99,999
- 2$200,000 to $249,999
- 5$250,000 to $299,999
- 59$300,000 to $399,999
- 51$400,000 to $499,999
- 47$500,000 to $749,999
- 6$750,000 to $999,999
- 7$1,000,000 or more

Distribution of rent paid by renters
![Distribution of rent paid by renters]()
- 2$200 to $299
- 3$300 to $399
- 5$400 to $499
- 2$500 to $599
- 2$600 to $699
- 1$800 to $899
- 12$900 to $999
- 14$1,000 to $1,249
- 14$1,250 to $1,499
- 5$1,500 to $1,999
- 22$2,000 or more

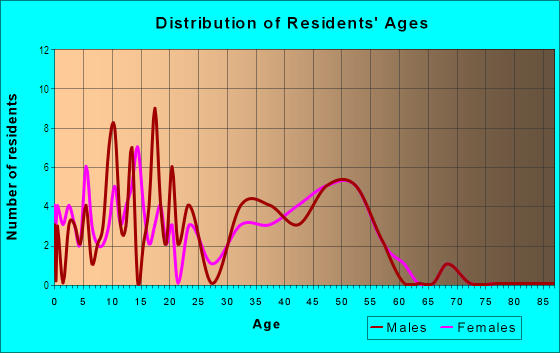
| Males: | 352 |
| Females: | 261 |
Males:
| This neighborhood: | 42.0 years |
| Whole city: | 36.3 years |
| This neighborhood: | 41.4 years |
| Whole city: | 38.1 years |
Average household size:
| Hidden Lake: | 2.5 people |
| Westminster: | 2.4 people |
Percentage of family households:
| Hidden Lake: | 39.4% |
| Westminster: | 47.0% |
| Here: | 54.6% |
| Westminster: | 48.3% |
Percentage of married-couple families with children (among all households):
| Hidden Lake: | 33.9% |
| Westminster: | 29.4% |
Percentage of single-mother households (among all households):
| Hidden Lake: | 1.9% |
| Westminster: | 7.5% |
Percentage of never married males 15 years old and over:
Percentage of never married females 15 years old and over:
| Hidden Lake: | 21.4% |
| Westminster: | 19.5% |
Percentage of never married females 15 years old and over:
| Hidden Lake: | 13.4% |
| city: | 13.2% |
Percentage of people that speak English not well or not at all:
| Hidden Lake: | 2.6% |
| Westminster: | 2.4% |
Percentage of people born in this state:
Percentage of people born in another U.S. state:
Percentage of native residents but born outside the U.S.:
Percentage of foreign born residents:
| Here: | 56.0% |
| Westminster: | 48.5% |
Percentage of people born in another U.S. state:
| Hidden Lake: | 27.7% |
| Westminster: | 40.2% |
Percentage of native residents but born outside the U.S.:
| Here: | 1.2% |
| city: | 1.6% |
Percentage of foreign born residents:
| Here: | 15.2% |
| Westminster: | 9.7% |
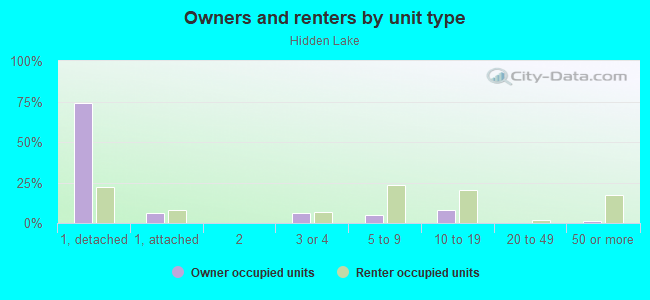
Owner-occupied
Renter-occupied

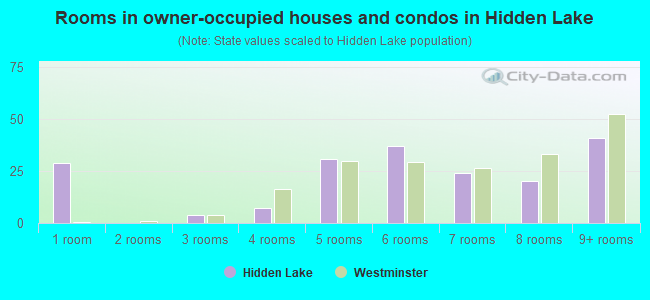
- Rooms in owner-occupied houses and condos in Hidden Lake
- 291 room
- 02 rooms
- 43 rooms
- 74 rooms
- 315 rooms
- 376 rooms
- 247 rooms
- 208 rooms
- 419+ rooms
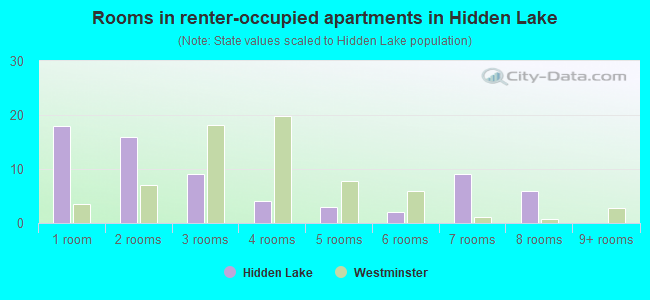
- Rooms in renter-occupied apartments in Hidden Lake
- 181 room
- 162 rooms
- 93 rooms
- 44 rooms
- 35 rooms
- 26 rooms
- 97 rooms
- 68 rooms
- 09+ rooms
Owner-occupied
Renter-occupied
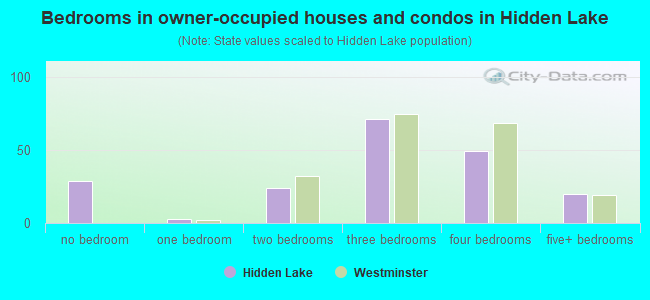
- Bedrooms in owner-occupied houses and condos in Hidden Lake
- 29no bedroom
- 31 bedroom
- 242 bedrooms
- 713 bedrooms
- 494 bedrooms
- 205+ bedrooms
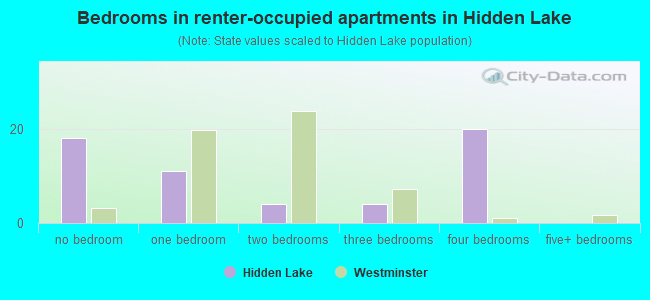
- Bedrooms in renter-occupied apartments in Hidden Lake
- 18no bedroom
- 111 bedroom
- 42 bedrooms
- 43 bedrooms
- 204 bedrooms
- 05+ bedrooms
Average number of cars or other vehicles available in houses/condos:
Average number of cars or other vehicles available in apartments:
| This neighborhood: | 2.4 |
| Westminster: | 2.2 |
Average number of cars or other vehicles available in apartments:
| Here: | 1.3 |
| city: | 1.5 |
Percentage of units with a mortgage:
| Hidden Lake: | 68.2% |
| Westminster: | 78.8% |
Average estimated value of detached houses in 2022 (86.5% of all units):
| Hidden Lake: | $461,374 |
| Colorado: | $676,667 |
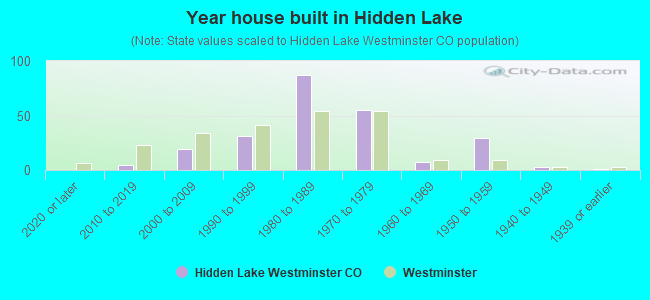
- Year house built in Hidden Lake
- 02020 or later
- 52010 to 2019
- 192000 to 2009
- 311990 to 1999
- 871980 to 1989
- 551970 to 1979
- 71960 to 1969
- 291950 to 1959
- 31940 to 1949
- 11939 or earlier
City-data.com crime index for city in 2020 (higher means more crime):
| City: | 292.5 |
| U.S. average: | 219.5 |
Travel time to work (commute)
![Travel time to work (commute)]()
- 5Less than 5 minutes
- 115 to 9 minutes
- 2310 to 14 minutes
- 2815 to 19 minutes
- 4120 to 24 minutes
- 1925 to 29 minutes
- 2130 to 34 minutes
- 935 to 39 minutes
- 1140 to 44 minutes
- 1945 to 59 minutes
- 660 to 89 minutes
- 490 or more minutes

Means of transportation to work
![Means of transportation to work]()
- 55.9%158Drove a car alone
- 13.5%38Carpooled
- 0.7%2Bus
- 2.5%7Light rail, streetcar or trolley
- 0.7%2Taxi
- 0.4%1Motorcycle
- 0.4%1Bicycle
- 2.5%7Walked
- 8.1%23Other means
- 21.2%60Worked at home

Time leaving home to go to work
![Time leaving home to go to work]()
- 1412:00 a.m. to 4:59 a.m.
- 135:00 a.m. to 5:29 a.m.
- 75:30 a.m. to 5:59 a.m.
- 146:00 a.m. to 6:29 a.m.
- 196:30 a.m. to 6:59 a.m.
- 277:00 a.m. to 7:29 a.m.
- 277:30 a.m. to 7:59 a.m.
- 198:00 a.m. to 8:29 a.m.
- 48:30 a.m. to 8:59 a.m.
- 119:00 a.m. to 9:59 a.m.
- 210:00 a.m. to 10:59 a.m.
- 111:00 a.m. to 11:59 a.m.
- 912:00 p.m. to 3:59 p.m.
- 254:00 p.m. to 11:59 p.m.

Occupations of males:
- Percentage of males in management occupations (except farmers):
Here: 3.6% city: 12.6%
- Percentage of males in business and financial operations occupations:
Here: 7.6% city: 5.3%
- Percentage of males in computer and mathematical occupations:
Here: 7.8% city: 8.8%
- Percentage of males in architecture and engineering occupations:
Here: 12.3% city: 5.6%
- Percentage of males in community and social services occupations:
Here: 1.4% city: 1.2%
- Percentage of males in education, training, and library occupations:
Here: 1.7% city: 1.9%
- Percentage of males in healthcare practitioners and technical occupations:
Here: 1.6% city: 2.3%
- Percentage of males in service occupations:
Here: 13.2% city: 10.8%
- Percentage of males in sales and office occupations:
Here: 6.7% city: 19.0%
- Percentage of males in farming, fishing, and forestry occupations:
Here: 1.1% city: 0.3%
- Percentage of males in construction, extraction, and maintenance occupations:
Here: 10.9% city: 8.4%
- Percentage of males in production occupations:
Here: 15.7% city: 5.8%
- Percentage of males in transportation occupations:
Here: 5.6% city: 4.7%
- Percentage of males in material moving occupations:
Here: 8.2% city: 4.7%
Occupations of females:
- Percentage of females in management occupations (except farmers):
Here: 16.6% city: 11.1%
- Percentage of females in business and financial operations occupations:
Here: 5.7% city: 8.5%
- Percentage of females in architecture and engineering occupations:
Here: 1.4% city: 1.0%
- Percentage of females in community and social services occupations:
Here: 2.5% city: 2.9%
- Percentage of females in education, training, and library occupations:
Here: 7.2% city: 7.7%
- Percentage of females in healthcare practitioners and technical occupations:
Here: 6.9% city: 8.8%
- Percentage of females in service occupations:
Here: 10.8% city: 19.4%
- Percentage of females in sales and office occupations:
Here: 38.7% city: 25.9%
- Percentage of females in construction, extraction, and maintenance occupations:
Here: 2.8% city: 0.7%
- Percentage of females in production occupations:
Here: 2.0% city: 2.4%
- Percentage of females in transportation occupations:
Here: 5.5% city: 1.5%
- Percentage of females in material moving occupations:
Here: 1.5% city: 1.9%
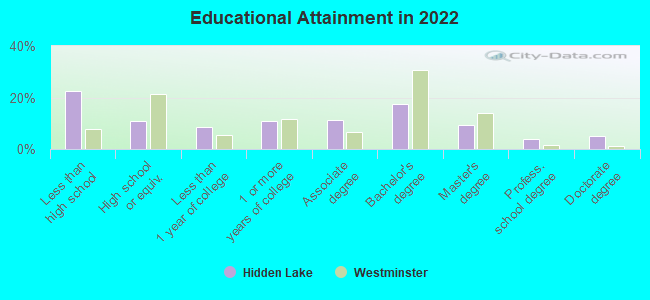
Education in this neighborhood (subdivision or community):
- Percentage of people 3 years and older in K-12 schools:
Hidden Lake: 16.9% Westminster: 14.3%
- Percentage of people 3 years and older in undergraduate colleges:
Hidden Lake: 2.8% Westminster: 2.9%
- Percentage of people 3 years and older in grad. or professional schools:
Hidden Lake: 3.3% Westminster: 2.1%
- Percentage of students K-12 enrolled in private schools:
Hidden Lake: 13.4% Westminster: 9.3%
Percentage of population below poverty level:
| Hidden Lake: | 9.1% |
| Westminster: | 7.4% |
Median year owner moved in (as recorded in 2022):
Median year renter moved in (as recorded in 2022):
| Hidden Lake: | 2007 |
| Westminster: | 2013 |
Median year renter moved in (as recorded in 2022):
| Hidden Lake: | 2018 |
| Westminster: | 2020 |
Percentage of married-couple families with both working:
| Hidden Lake: | 86.9% |
| Westminster: | 77.8% |
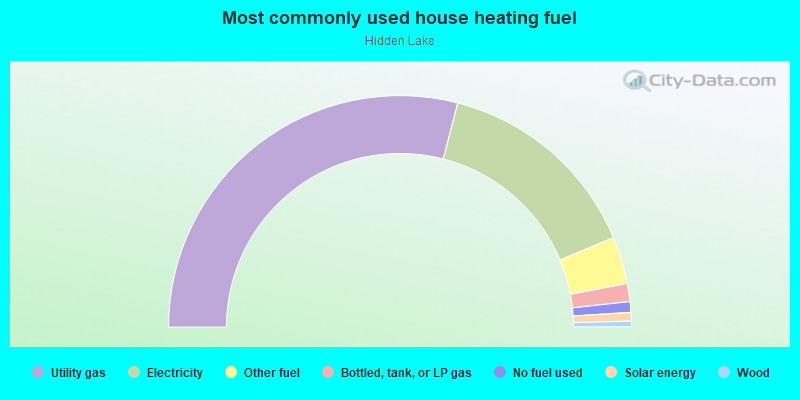
- 58.0%Utility gas
- 29.3%Electricity
- 6.6%Other fuel
- 2.5%Bottled, tank, or LP gas
- 1.5%No fuel used
- 1.2%Solar energy
- 0.8%Wood
Roads and streets:
W 69th Ave
Length: 0.60 miles
Directions: E-W, SE-NW, SW-NE
Address range: 4400 to 5199
Directions: E-W, SE-NW, SW-NE
Address range: 4400 to 5199
W 69th Dr
Length: 0.29 miles
Directions: E-W, N-S, SE-NW, SW-NE
Address range: 4501 to 4829
Directions: E-W, N-S, SE-NW, SW-NE
Address range: 4501 to 4829
W 69th Loop
Length: 0.29 miles
Directions: E-W, N-S, SE-NW, SW-NE
Address range: 5000 to 5199
Directions: E-W, N-S, SE-NW, SW-NE
Address range: 5000 to 5199
Wyman Way
Length: 0.17 miles
Directions: E-W, N-S, SE-NW, SW-NE
Address range: 6853 to 6899
Directions: E-W, N-S, SE-NW, SW-NE
Address range: 6853 to 6899
Wolff St
Length: 0.12 miles
Directions: E-W, N-S, SE-NW
Address range: 6900 to 6959
Directions: E-W, N-S, SE-NW
Address range: 6900 to 6959
W 69th Pl
Length: 0.06 miles
Direction: E-W
Address range: 5100 to 5199
Direction: E-W
Address range: 5100 to 5199
W 69th Ct
Length: 0.04 miles
Direction: SW-NE
Address range: 4900 to 4999
Direction: SW-NE
Address range: 4900 to 4999