Historic District (Centralia Downtown Historic Distric) neighborhood in Centralia, Washington (WA), 98531 detailed profile
Settings
X


Business Search - 14 Million verified businesses
Area: 0.252 square miles
Population: 957
Population density:
| Historic District (Centralia Downtown Historic Distric): | 3,790 people per square mile |
| Centralia: | 2,462 people per square mile |

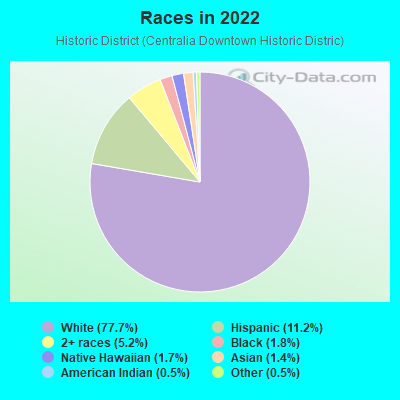
- 77277.7%White
- 11111.2%Hispanic or Latino
- 525.2%Two or more races
- 181.8%Black
- 171.7%Native Hawaiian and Other
Pacific Islander - 141.4%Asian
- 50.5%American Indian
- 50.5%Some other race
Distribution of median household income
![Distribution of median household income]()
- 23Less than $10,000
- 58$10,000 to $19,999
- 50$20,000 to $29,999
- 92$30,000 to $39,999
- 22$40,000 to $49,999
- 36$50,000 to $59,999
- 37$60,000 to $74,999
- 53$75,000 to $99,999
- 35$100,000 to $124,999
- 26$125,000 to $149,999
- 26$150,000 to $199,999
- 19$200,000 or more

Distribution of owner-occupied house/condo value
![Distribution of owner-occupied house/condo value]()
- 29Less than $50,000
- 29$50,000 to $99,999
- 34$100,000 to $149,999
- 68$150,000 to $199,999
- 30$200,000 to $249,999
- 44$250,000 to $299,999
- 54$300,000 to $399,999
- 31$400,000 to $499,999
- 12$500,000 to $749,999
- 9$750,000 to $999,999
- 13$1,000,000 or more

Distribution of rent paid by renters
![Distribution of rent paid by renters]()
- 1Less than $100
- 6$100 to $199
- 56$200 to $299
- 11$300 to $399
- 31$400 to $499
- 132$500 to $599
- 27$600 to $699
- 38$700 to $799
- 19$800 to $899
- 27$900 to $999
- 25$1,000 to $1,249
- 16$1,250 to $1,499
- 16$1,500 to $1,999
- 3$2,000 or more

Median rent in 2022:
| Historic District (Centralia Downtown Historic Distric): | $740 |
| Centralia: | $830 |
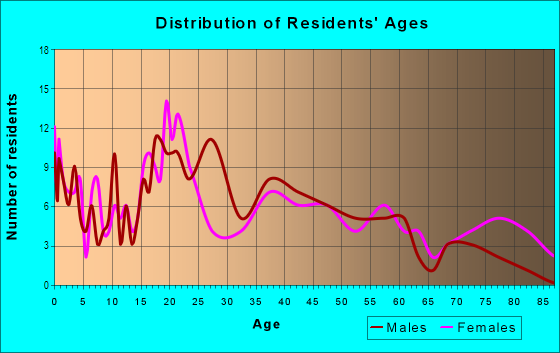
| Males: | 482 |
| Females: | 474 |
Males:
| This neighborhood: | 38.4 years |
| Whole city: | 35.4 years |
| This neighborhood: | 37.0 years |
| Whole city: | 42.2 years |
Average household size:
| Historic District (Centralia Downtown Historic Distric): | 10.1 people |
| Centralia: | 2.4 people |
Percentage of family households:
| Historic District (Centralia Downtown Historic Distric): | 33.7% |
| Centralia: | 37.4% |
| Here: | 28.7% |
| Centralia: | 31.1% |
Percentage of married-couple families with children (among all households):
| Historic District (Centralia Downtown Historic Distric): | 26.3% |
| Centralia: | 21.0% |
Percentage of single-mother households (among all households):
| Historic District (Centralia Downtown Historic Distric): | 12.8% |
| Centralia: | 12.7% |
Percentage of never married males 15 years old and over:
Percentage of never married females 15 years old and over:
| Historic District (Centralia Downtown Historic Distric): | 19.8% |
| Centralia: | 18.1% |
Percentage of never married females 15 years old and over:
| Historic District (Centralia Downtown Historic Distric): | 18.5% |
| city: | 14.5% |
Percentage of people that speak English not well or not at all:
| Historic District (Centralia Downtown Historic Distric): | 2.0% |
| Centralia: | 2.8% |
Percentage of people born in this state:
Percentage of people born in another U.S. state:
Percentage of native residents but born outside the U.S.:
Percentage of foreign born residents:
| Here: | 63.5% |
| Centralia: | 58.6% |
Percentage of people born in another U.S. state:
| Historic District (Centralia Downtown Historic Distric): | 30.5% |
| Centralia: | 33.3% |
Percentage of native residents but born outside the U.S.:
| Here: | 0.9% |
| city: | 0.8% |
Percentage of foreign born residents:
| Here: | 5.1% |
| Centralia: | 7.3% |
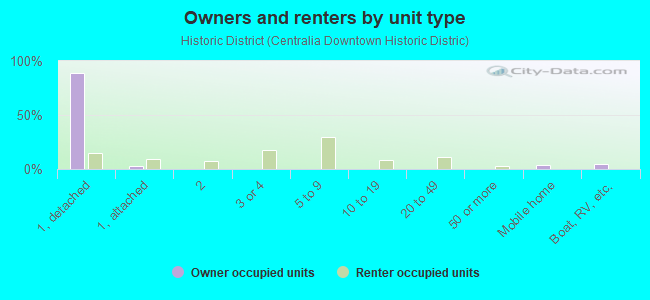
Owner-occupied
Renter-occupied

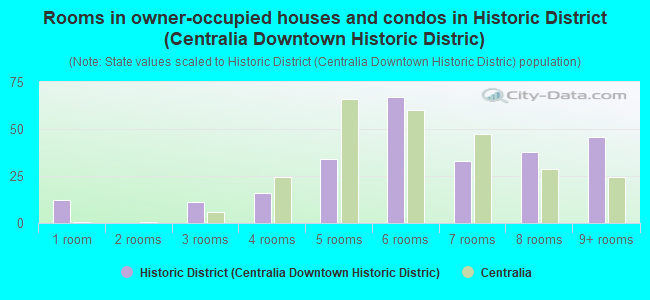
- Rooms in owner-occupied houses and condos in Historic District <
> - 121 room
- 02 rooms
- 113 rooms
- 164 rooms
- 345 rooms
- 676 rooms
- 337 rooms
- 388 rooms
- 469+ rooms
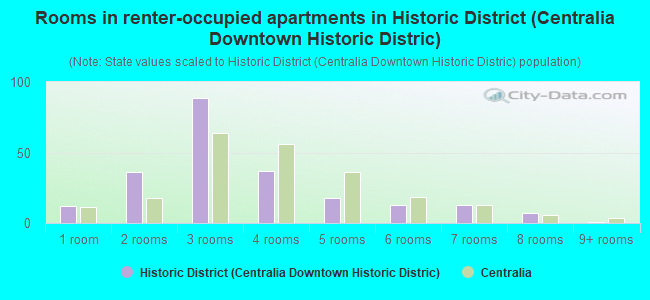
- Rooms in renter-occupied apartments in Historic District <
> - 121 room
- 362 rooms
- 893 rooms
- 374 rooms
- 185 rooms
- 136 rooms
- 137 rooms
- 78 rooms
- 19+ rooms
Owner-occupied
Renter-occupied
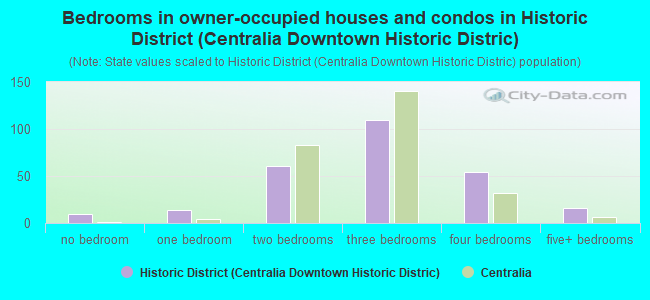
- Bedrooms in owner-occupied houses and condos in Historic District <
> - 10no bedroom
- 141 bedroom
- 612 bedrooms
- 1103 bedrooms
- 544 bedrooms
- 165+ bedrooms
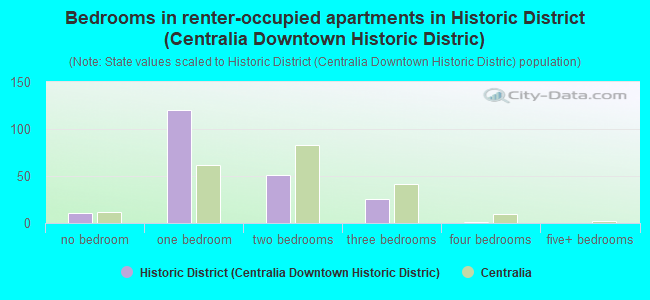
- Bedrooms in renter-occupied apartments in Historic District <
> - 11no bedroom
- 1201 bedroom
- 512 bedrooms
- 263 bedrooms
- 14 bedrooms
- 05+ bedrooms
Average number of cars or other vehicles available in houses/condos:
Average number of cars or other vehicles available in apartments:
| This neighborhood: | 2.2 |
| Centralia: | 2.1 |
Average number of cars or other vehicles available in apartments:
| Here: | 1.1 |
| city: | 1.4 |
Percentage of units with a mortgage:
| Historic District (Centralia Downtown Historic Distric): | 70.4% |
| Centralia: | 60.6% |
Average estimated value of detached houses in 2022 (60.0% of all units):
| Historic District (Centralia Downtown Historic Distric): | $278,532 |
| Washington: | $734,307 |
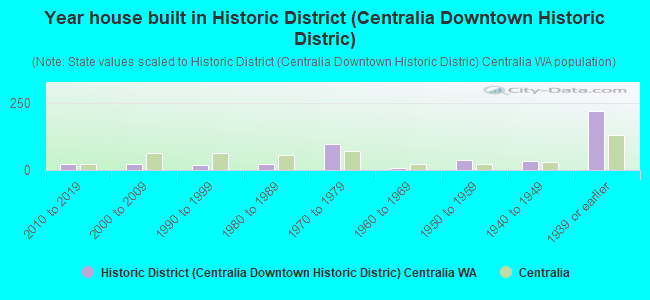
- Year house built in Historic District <
> - 12020 or later
- 212010 to 2019
- 222000 to 2009
- 181990 to 1999
- 231980 to 1989
- 981970 to 1979
- 61960 to 1969
- 391950 to 1959
- 331940 to 1949
- 2181939 or earlier
City-data.com crime index for city in 2020 (higher means more crime):
| City: | 257.3 |
| U.S. average: | 219.5 |
Travel time to work (commute)
![Travel time to work (commute)]()
- 13Less than 5 minutes
- 955 to 9 minutes
- 8610 to 14 minutes
- 8615 to 19 minutes
- 4720 to 24 minutes
- 3525 to 29 minutes
- 2930 to 34 minutes
- 835 to 39 minutes
- 1340 to 44 minutes
- 1245 to 59 minutes
- 760 to 89 minutes
- 2190 or more minutes

Means of transportation to work
![Means of transportation to work]()
- 75.8%324Drove a car alone
- 10.8%46Carpooled
- 0.5%2Bus
- 3.7%16Motorcycle
- 1.2%5Bicycle
- 5.4%23Walked
- 1.4%6Other means
- 8.0%34Worked at home

Time leaving home to go to work
![Time leaving home to go to work]()
- 4512:00 a.m. to 4:59 a.m.
- 145:00 a.m. to 5:29 a.m.
- 155:30 a.m. to 5:59 a.m.
- 146:00 a.m. to 6:29 a.m.
- 506:30 a.m. to 6:59 a.m.
- 357:00 a.m. to 7:29 a.m.
- 457:30 a.m. to 7:59 a.m.
- 568:00 a.m. to 8:29 a.m.
- 258:30 a.m. to 8:59 a.m.
- 449:00 a.m. to 9:59 a.m.
- 2110:00 a.m. to 10:59 a.m.
- 511:00 a.m. to 11:59 a.m.
- 5112:00 p.m. to 3:59 p.m.
- 234:00 p.m. to 11:59 p.m.

Occupations of males:
- Percentage of males in management occupations (except farmers):
Here: 6.8% city: 5.2%
- Percentage of males in business and financial operations occupations:
Here: 2.6% city: 6.2%
- Percentage of males in computer and mathematical occupations:
Here: 6.4% city: 3.2%
- Percentage of males in architecture and engineering occupations:
Here: 1.6% city: 0.4%
- Percentage of males in education, training, and library occupations:
Here: 3.4% city: 2.9%
- Percentage of males in healthcare practitioners and technical occupations:
Here: 2.6% city: 1.2%
- Percentage of males in service occupations:
Here: 18.6% city: 15.4%
- Percentage of males in sales and office occupations:
Here: 12.8% city: 12.8%
- Percentage of males in farming, fishing, and forestry occupations:
Here: 1.1% city: 3.7%
- Percentage of males in construction, extraction, and maintenance occupations:
Here: 9.7% city: 17.1%
- Percentage of males in production occupations:
Here: 15.7% city: 9.8%
- Percentage of males in transportation occupations:
Here: 7.4% city: 5.0%
- Percentage of males in material moving occupations:
Here: 6.0% city: 6.3%
Occupations of females:
- Percentage of females in management occupations (except farmers):
Here: 11.9% city: 9.4%
- Percentage of females in business and financial operations occupations:
Here: 1.7% city: 5.3%
- Percentage of females in computer and mathematical occupations:
Here: 1.0% city: 0.7%
- Percentage of females in legal occupations:
Here: 1.5% city: 0.6%
- Percentage of females in education, training, and library occupations:
Here: 13.1% city: 3.9%
- Percentage of females in healthcare practitioners and technical occupations:
Here: 1.9% city: 8.9%
- Percentage of females in service occupations:
Here: 23.6% city: 33.4%
- Percentage of females in sales and office occupations:
Here: 35.8% city: 23.9%
- Percentage of females in production occupations:
Here: 2.8% city: 2.4%
- Percentage of females in transportation occupations:
Here: 2.4% city: 1.9%
- Percentage of females in material moving occupations:
Here: 2.9% city: 1.6%
Percentage of people 16-64 in Armed Forces:
| Historic District (Centralia Downtown Historic Distric): | 0.7% |
| Centralia: | 0.3% |
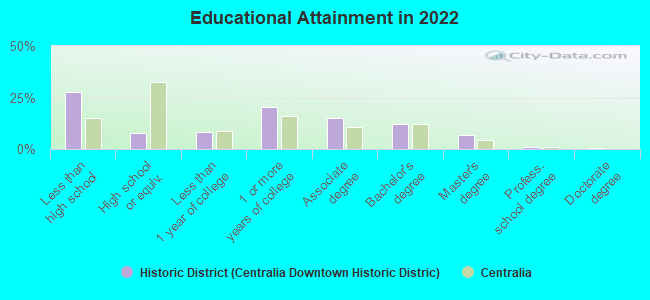
Education in this neighborhood (subdivision or community):
- Percentage of people 3 years and older in K-12 schools:
Historic District (Centralia Downtown Historic Distric): 15.5% Centralia: 15.2%
- Percentage of people 3 years and older in undergraduate colleges:
Historic District (Centralia Downtown Historic Distric): 13.6% Centralia: 4.3%
- Percentage of people 3 years and older in grad. or professional schools:
Historic District (Centralia Downtown Historic Distric): 4.3% Centralia: 0.5%
- Percentage of students K-12 enrolled in private schools:
Historic District (Centralia Downtown Historic Distric): 18.6% Centralia: 5.6%
Percentage of population below poverty level:
| Historic District (Centralia Downtown Historic Distric): | 15.9% |
| Centralia: | 21.6% |
Median year owner moved in (as recorded in 2022):
Median year renter moved in (as recorded in 2022):
| Historic District (Centralia Downtown Historic Distric): | 2012 |
| Centralia: | 2012 |
Median year renter moved in (as recorded in 2022):
| Historic District (Centralia Downtown Historic Distric): | 2016 |
| Centralia: | 2015 |
Percentage of married-couple families with both working:
| Historic District (Centralia Downtown Historic Distric): | 90.0% |
| Centralia: | 66.6% |
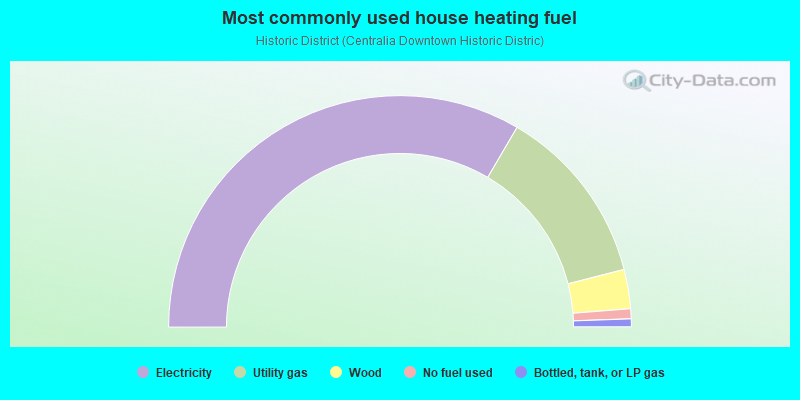
- 66.9%Electricity
- 25.1%Utility gas
- 5.5%Wood
- 1.4%No fuel used
- 1.1%Bottled, tank, or LP gas
Highways in this neighborhood:
State Rte 507 (N Tower Ave)
Length: 0.40 miles
Directions: N-S, SW-NE
Address range: 100 to 599
Directions: N-S, SW-NE
Address range: 100 to 599
N Pearl St (State Rte 507)
Length: 0.39 miles
Directions: N-S, SW-NE
Address range: 100 to 599
Directions: N-S, SW-NE
Address range: 100 to 599
State Rte 507 (S Pearl St)
Length: 0.15 miles
Direction: SW-NE
Address range: 100 to 299
Direction: SW-NE
Address range: 100 to 299
S Tower Ave (State Rte 507)
Length: 0.15 miles
Direction: SW-NE
Address range: 100 to 299
Direction: SW-NE
Address range: 100 to 299
Roads and streets:
Railroad Ave
Length: 0.49 miles
Directions: N-S, SW-NE
Address range: 500 to 599
Directions: N-S, SW-NE
Address range: 500 to 599
W Hanson St
Length: 0.48 miles
Direction: E-W
Address range: 200 to 417
Direction: E-W
Address range: 200 to 417
W Main St
Length: 0.41 miles
Direction: E-W
Address range: 100 to 599
Direction: E-W
Address range: 100 to 599
W Pine St
Length: 0.41 miles
Direction: E-W
Address range: 100 to 599
Direction: E-W
Address range: 100 to 599
W Locust St
Length: 0.41 miles
Direction: E-W
Address range: 200 to 599
Direction: E-W
Address range: 200 to 599
W Maple St
Length: 0.41 miles
Direction: E-W
Address range: 100 to 299
Direction: E-W
Address range: 100 to 299
W Center St
Length: 0.41 miles
Direction: E-W
Address range: 200 to 599
Direction: E-W
Address range: 200 to 599
N Iron St
Length: 0.36 miles
Directions: N-S, SW-NE
Address range: 100 to 529
Directions: N-S, SW-NE
Address range: 100 to 529
N Rock St
Length: 0.34 miles
Direction: SW-NE
Address range: 200 to 526
Direction: SW-NE
Address range: 200 to 526
W Magnolia St
Length: 0.32 miles
Direction: E-W
Address range: 100 to 423
Direction: E-W
Address range: 100 to 423
W Walnut St
Length: 0.32 miles
Direction: E-W
Address range: 100 to 399
Direction: E-W
Address range: 100 to 399
N Oak St
Length: 0.32 miles
Directions: N-S, SW-NE
Address range: 100 to 516
Directions: N-S, SW-NE
Address range: 100 to 516
S Rock St
Length: 0.15 miles
Direction: SW-NE
Address range: 100 to 199
Direction: SW-NE
Address range: 100 to 199
S Silver St
Length: 0.15 miles
Direction: SW-NE
Address range: 101 to 299
Direction: SW-NE
Address range: 101 to 299
S Iron St
Length: 0.15 miles
Direction: SW-NE
Address range: 200 to 308
Direction: SW-NE
Address range: 200 to 308
E Maple St
Length: 0.12 miles
Direction: E-W
Direction: E-W
N Silver St
Length: 0.10 miles
Direction: SW-NE
Address range: 115 to 125
Direction: SW-NE
Address range: 115 to 125
Hill-Kress Ave (Hillkress)
Length: 0.10 miles
Direction: N-S
Address range: 500 to 535
Direction: N-S
Address range: 500 to 535
W 1st St
Length: 0.10 miles
Direction: E-W
Address range: 300 to 398
Direction: E-W
Address range: 300 to 398
E St
Length: 0.07 miles
Direction: N-S
Address range: 600 to 699
Direction: N-S
Address range: 600 to 699
F St
Length: 0.07 miles
Direction: N-S
Address range: 600 to 699
Direction: N-S
Address range: 600 to 699
E Magnolia St
Length: 0.07 miles
Direction: E-W
Address range: 100 to 199
Direction: E-W
Address range: 100 to 199
S Oak St
Length: 0.07 miles
Direction: SW-NE
Address range: 101 to 123
Direction: SW-NE
Address range: 101 to 123
E Main St
Length: 0.07 miles
Direction: E-W
Address range: 100 to 199
Direction: E-W
Address range: 100 to 199
E Locust St
Length: 0.07 miles
Direction: E-W
Direction: E-W
E Pine St
Length: 0.06 miles
Direction: E-W
Address range: 100 to 199
Direction: E-W
Address range: 100 to 199
E Hanson St
Length: 0.06 miles
Direction: E-W
Address range: 101 to 199
Direction: E-W
Address range: 101 to 199
E Center St
Length: 0.05 miles
Direction: E-W
Address range: 100 to 199
Direction: E-W
Address range: 100 to 199
Railroad features:
Burlington Northern Santa Fe Rlwy (Union Pacific RR)
Length: 0.68 miles
Direction: SW-NE
Direction: SW-NE
Burlington Northern Santa Fe Rlwy
Length: 0.09 miles
Direction: N-S
Direction: N-S
Other features:
China Crk
Length: 0.13 miles
Directions: E-W, SW-NE
Directions: E-W, SW-NE