Historic Farmington (Historic) neighborhood in Farmington, Michigan (MI), 48335, 48336 detailed profile
Settings
X


Business Search - 14 Million verified businesses
Area: 0.285 square miles
Population: 1,581
Population density:
| Historic Farmington (Historic): | 5,539 people per square mile |
| Farmington: | 4,303 people per square mile |

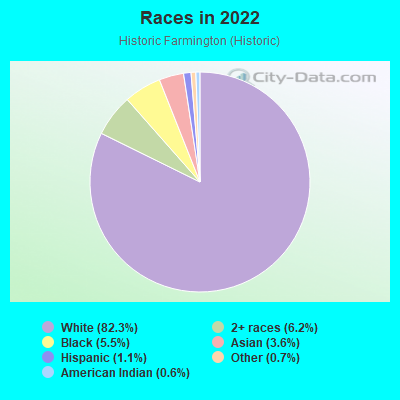
- 1,31882.3%White
- 996.2%Two or more races
- 885.5%Black
- 583.6%Asian
- 181.1%Hispanic or Latino
- 110.7%Some other race
- 90.6%American Indian
Median household income in 2022:
| Historic Farmington (Historic): | $122,822 |
| Farmington: | $92,128 |
Distribution of median household income
![Distribution of median household income]()
- 21Less than $10,000
- 55$10,000 to $19,999
- 106$20,000 to $29,999
- 55$30,000 to $39,999
- 49$40,000 to $49,999
- 46$50,000 to $59,999
- 42$60,000 to $74,999
- 111$75,000 to $99,999
- 36$100,000 to $124,999
- 35$125,000 to $149,999
- 86$150,000 to $199,999
- 115$200,000 or more

Distribution of owner-occupied house/condo value
![Distribution of owner-occupied house/condo value]()
- 41Less than $50,000
- 55$50,000 to $99,999
- 24$100,000 to $149,999
- 39$150,000 to $199,999
- 132$200,000 to $249,999
- 224$250,000 to $299,999
- 85$300,000 to $399,999
- 57$400,000 to $499,999
- 23$500,000 to $749,999
- 3$750,000 to $999,999
- 4$1,000,000 or more

Distribution of rent paid by renters
![Distribution of rent paid by renters]()
- 2$100 to $199
- 45$200 to $299
- 15$300 to $399
- 29$500 to $599
- 2$600 to $699
- 24$700 to $799
- 12$800 to $899
- 6$900 to $999
- 22$1,000 to $1,249
- 9$1,250 to $1,499
- 53$1,500 to $1,999
- 2$2,000 or more

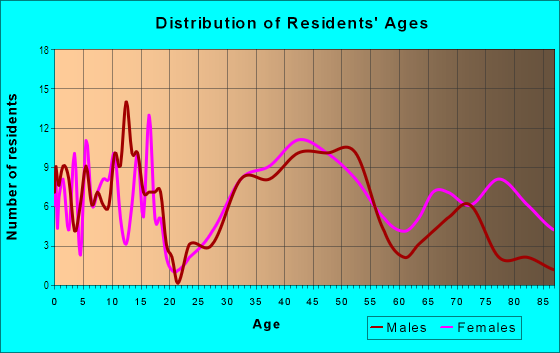
| Males: | 660 |
| Females: | 921 |
Males:
| This neighborhood: | 48.6 years |
| Whole city: | 35.3 years |
| This neighborhood: | 50.2 years |
| Whole city: | 42.4 years |
Average household size:
| Historic Farmington (Historic): | 2.2 people |
| Farmington: | 2.2 people |
Percentage of family households:
| Historic Farmington (Historic): | 35.0% |
| Farmington: | 41.0% |
| Here: | 54.6% |
| Farmington: | 45.5% |
Percentage of married-couple families with children (among all households):
| Historic Farmington (Historic): | 41.3% |
| Farmington: | 40.7% |
Percentage of single-mother households (among all households):
| Historic Farmington (Historic): | 3.2% |
| Farmington: | 4.2% |
Percentage of never married males 15 years old and over:
Percentage of never married females 15 years old and over:
| Historic Farmington (Historic): | 7.9% |
| Farmington: | 16.1% |
Percentage of never married females 15 years old and over:
| Historic Farmington (Historic): | 13.5% |
| city: | 15.2% |
Percentage of people that speak English not well or not at all:
| Historic Farmington (Historic): | 0.9% |
| Farmington: | 0.7% |
Percentage of people born in this state:
Percentage of people born in another U.S. state:
Percentage of native residents but born outside the U.S.:
Percentage of foreign born residents:
| Here: | 69.2% |
| Farmington: | 63.1% |
Percentage of people born in another U.S. state:
| Historic Farmington (Historic): | 20.0% |
| Farmington: | 16.3% |
Percentage of native residents but born outside the U.S.:
| Here: | 0.7% |
| city: | 0.8% |
Percentage of foreign born residents:
| Here: | 10.0% |
| Farmington: | 19.8% |
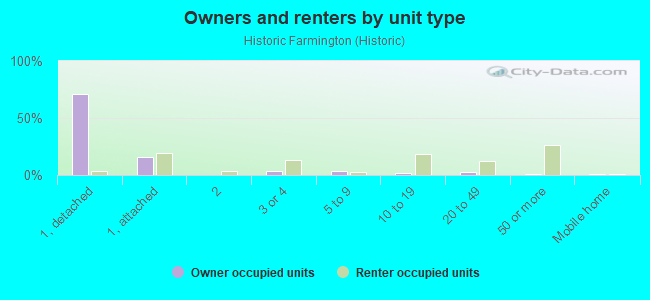
Owner-occupied
Renter-occupied

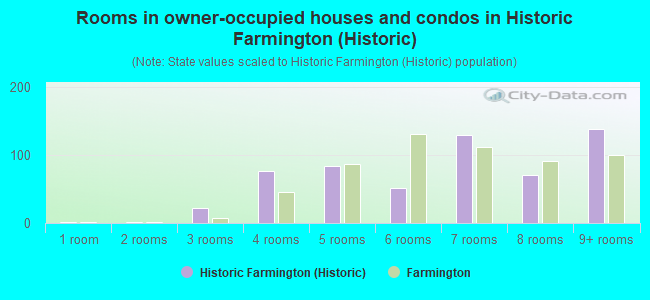
- Rooms in owner-occupied houses and condos in Historic Farmington <
> - 21 room
- 12 rooms
- 223 rooms
- 774 rooms
- 845 rooms
- 526 rooms
- 1297 rooms
- 708 rooms
- 1389+ rooms
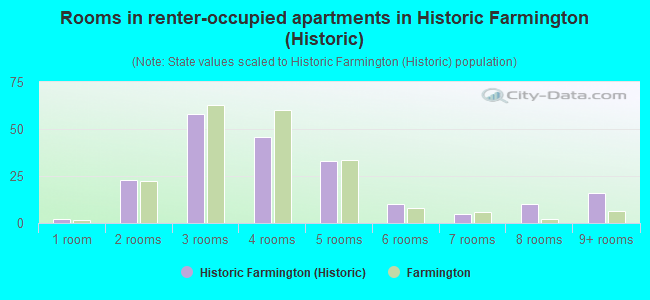
- Rooms in renter-occupied apartments in Historic Farmington <
> - 21 room
- 232 rooms
- 583 rooms
- 464 rooms
- 335 rooms
- 106 rooms
- 57 rooms
- 108 rooms
- 169+ rooms
Owner-occupied
Renter-occupied
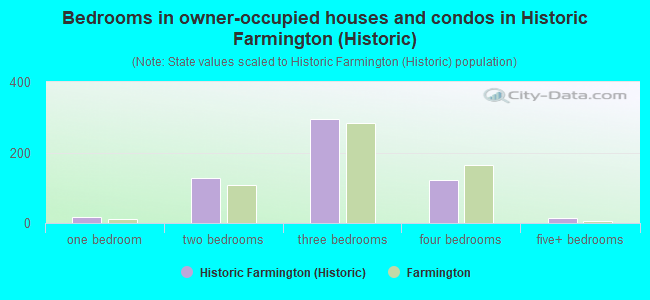
- Bedrooms in owner-occupied houses and condos in Historic Farmington <
> - 2no bedroom
- 171 bedroom
- 1292 bedrooms
- 2943 bedrooms
- 1224 bedrooms
- 145+ bedrooms
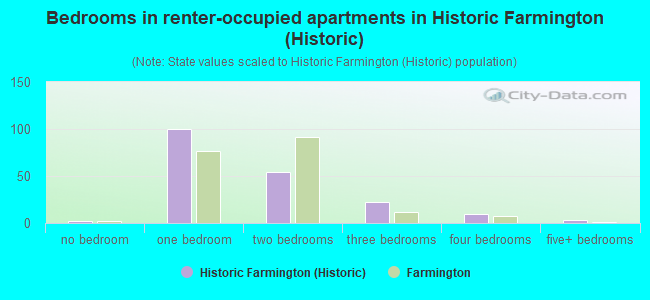
- Bedrooms in renter-occupied apartments in Historic Farmington <
> - 2no bedroom
- 1001 bedroom
- 542 bedrooms
- 223 bedrooms
- 104 bedrooms
- 35+ bedrooms
Average number of cars or other vehicles available in houses/condos:
Average number of cars or other vehicles available in apartments:
| This neighborhood: | 1.2 |
| Farmington: | 1.9 |
Average number of cars or other vehicles available in apartments:
| Here: | |
| city: |
Percentage of units with a mortgage:
| Historic Farmington (Historic): | 42.8% |
| Farmington: | 63.7% |
Average estimated value of detached houses in 2022 (64.5% of all units):
| Historic Farmington (Historic): | $303,937 |
| Farmington: | $284,023 |
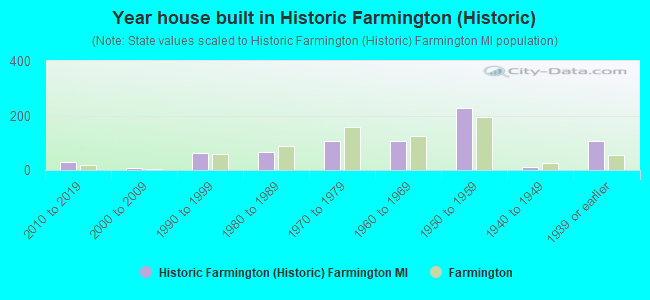
- Year house built in Historic Farmington <
> - 02020 or later
- 282010 to 2019
- 82000 to 2009
- 631990 to 1999
- 661980 to 1989
- 1061970 to 1979
- 1071960 to 1969
- 2291950 to 1959
- 101940 to 1949
- 1061939 or earlier
City-data.com crime index for city in 2020 (higher means more crime):
| City: | 33.2 |
| U.S. average: | 219.5 |
Travel time to work (commute)
![Travel time to work (commute)]()
- 9Less than 5 minutes
- 515 to 9 minutes
- 5310 to 14 minutes
- 7815 to 19 minutes
- 7220 to 24 minutes
- 3625 to 29 minutes
- 6030 to 34 minutes
- 2935 to 39 minutes
- 3540 to 44 minutes
- 4345 to 59 minutes
- 1460 to 89 minutes
- 590 or more minutes

Means of transportation to work
![Means of transportation to work]()
- 73.2%488Drove a car alone
- 2.2%15Carpooled
- 0.6%4Bus
- 0.4%3Bicycle
- 3.3%22Walked
- 1.6%11Other means
- 21.9%146Worked at home

Time leaving home to go to work
![Time leaving home to go to work]()
- 712:00 a.m. to 4:59 a.m.
- 125:00 a.m. to 5:29 a.m.
- 145:30 a.m. to 5:59 a.m.
- 256:00 a.m. to 6:29 a.m.
- 516:30 a.m. to 6:59 a.m.
- 787:00 a.m. to 7:29 a.m.
- 727:30 a.m. to 7:59 a.m.
- 1048:00 a.m. to 8:29 a.m.
- 398:30 a.m. to 8:59 a.m.
- 449:00 a.m. to 9:59 a.m.
- 510:00 a.m. to 10:59 a.m.
- 1611:00 a.m. to 11:59 a.m.
- 2212:00 p.m. to 3:59 p.m.
- 224:00 p.m. to 11:59 p.m.

Occupations of males:
- Percentage of males in management occupations (except farmers):
Here: 21.7% city: 10.6%
- Percentage of males in business and financial operations occupations:
Here: 8.3% city: 8.7%
- Percentage of males in computer and mathematical occupations:
Here: 6.9% city: 21.4%
- Percentage of males in architecture and engineering occupations:
Here: 9.0% city: 13.8%
- Percentage of males in life, physical, and social science occupations:
Here: 2.5% city: 0.8%
- Percentage of males in education, training, and library occupations:
Here: 3.6% city: 1.9%
- Percentage of males in healthcare practitioners and technical occupations:
Here: 2.7% city: 2.6%
- Percentage of males in service occupations:
Here: 9.7% city: 5.6%
- Percentage of males in sales and office occupations:
Here: 23.3% city: 14.6%
- Percentage of males in construction, extraction, and maintenance occupations:
Here: 2.0% city: 4.2%
- Percentage of males in production occupations:
Here: 1.1% city: 4.4%
- Percentage of males in transportation occupations:
Here: 4.9% city: 3.1%
Occupations of females:
- Percentage of females in management occupations (except farmers):
Here: 9.2% city: 9.9%
- Percentage of females in business and financial operations occupations:
Here: 4.7% city: 8.6%
- Percentage of females in computer and mathematical occupations:
Here: 1.2% city: 4.4%
- Percentage of females in architecture and engineering occupations:
Here: 2.2% city: 3.2%
- Percentage of females in life, physical, and social science occupations:
Here: 1.5% city: 0.6%
- Percentage of females in legal occupations:
Here: 1.1% city: 1.2%
- Percentage of females in education, training, and library occupations:
Here: 7.0% city: 7.1%
- Percentage of females in arts, design, entertainment, sports, and media occupations:
Here: 1.3% city: 2.1%
- Percentage of females in healthcare practitioners and technical occupations:
Here: 22.5% city: 11.4%
- Percentage of females in service occupations:
Here: 30.5% city: 16.3%
- Percentage of females in sales and office occupations:
Here: 14.4% city: 24.6%
- Percentage of females in production occupations:
Here: 3.3% city: 5.7%
- Percentage of females in material moving occupations:
Here: 1.1% city: 1.5%
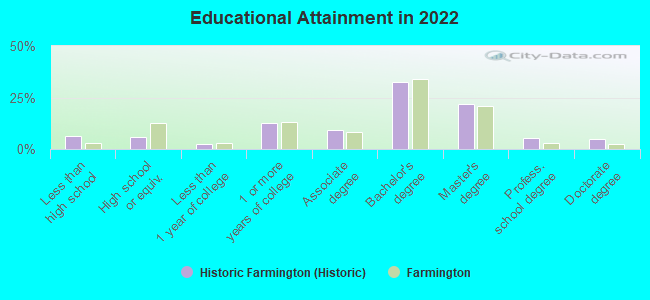
Education in this neighborhood (subdivision or community):
- Percentage of people 3 years and older in K-12 schools:
Historic Farmington (Historic): 21.7% Farmington: 12.2%
- Percentage of people 3 years and older in undergraduate colleges:
Historic Farmington (Historic): 4.7% Farmington: 4.3%
- Percentage of people 3 years and older in grad. or professional schools:
Historic Farmington (Historic): 1.7% Farmington: 1.0%
- Percentage of students K-12 enrolled in private schools:
Historic Farmington (Historic): 71.5% Farmington: 17.8%
Percentage of population below poverty level:
| Historic Farmington (Historic): | 5.7% |
| Farmington: | 4.9% |
Median year owner moved in (as recorded in 2022):
| Historic Farmington (Historic): | 2009 |
| Farmington: | 2010 |
Percentage of married-couple families with both working:
| Historic Farmington (Historic): | 79.3% |
| Farmington: | 61.1% |
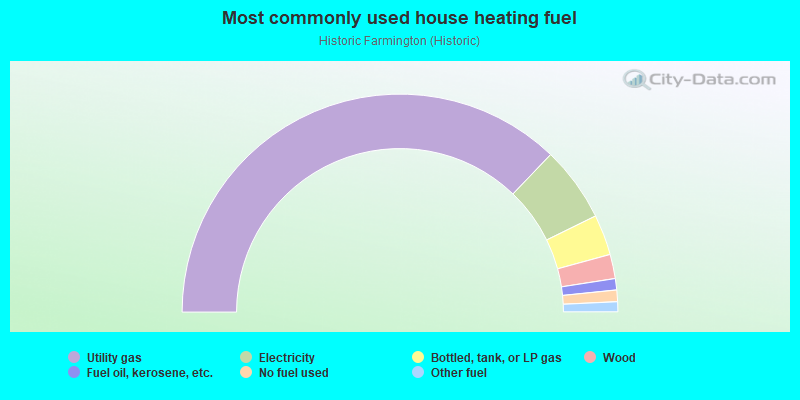
- 74.3%Utility gas
- 11.2%Electricity
- 6.0%Bottled, tank, or LP gas
- 3.6%Wood
- 1.7%Fuel oil, kerosene, etc.
- 1.7%No fuel used
- 1.5%Other fuel
Roads and streets:
Shiawassee Rd
Length: 0.93 miles
Direction: E-W
Address range: 33041 to 34399
Direction: E-W
Address range: 33041 to 34399
Grand River Ave
Length: 0.90 miles
Directions: E-W, SE-NW
Address range: 33114 to 34299
Directions: E-W, SE-NW
Address range: 33114 to 34299
Oakland St
Length: 0.88 miles
Direction: E-W
Address range: 33200 to 34399
Direction: E-W
Address range: 33200 to 34399
State St
Length: 0.67 miles
Direction: E-W
Address range: 33400 to 34399
Direction: E-W
Address range: 33400 to 34399
Farmington Rd
Length: 0.41 miles
Directions: E-W, N-S, SE-NW
Address range: 23404 to 24099
Directions: E-W, N-S, SE-NW
Address range: 23404 to 24099
Gill Rd
Length: 0.36 miles
Direction: N-S
Address range: 23600 to 24099
Direction: N-S
Address range: 23600 to 24099
Glenview Dr
Length: 0.33 miles
Directions: E-W, N-S, SE-NW, SW-NE
Address range: 33700 to 34099
Directions: E-W, N-S, SE-NW, SW-NE
Address range: 33700 to 34099
Wilmarth St
Length: 0.30 miles
Direction: N-S
Address range: 23500 to 23999
Direction: N-S
Address range: 23500 to 23999
Hillcrest St
Length: 0.25 miles
Directions: E-W, N-S, SE-NW, SW-NE
Address range: 33600 to 33699
Directions: E-W, N-S, SE-NW, SW-NE
Address range: 33600 to 33699
Warner St
Length: 0.25 miles
Directions: E-W, N-S, SE-NW, SW-NE
Address range: 23500 to 23748
Directions: E-W, N-S, SE-NW, SW-NE
Address range: 23500 to 23748
Cass St
Length: 0.22 miles
Direction: N-S
Address range: 23600 to 23999
Direction: N-S
Address range: 23600 to 23999
Cortland St
Length: 0.20 miles
Directions: E-W, N-S, SE-NW
Address range: 34100 to 34299
Directions: E-W, N-S, SE-NW
Address range: 34100 to 34299
Thomas St
Length: 0.20 miles
Directions: E-W, SE-NW
Address range: 33151 to 33399
Directions: E-W, SE-NW
Address range: 33151 to 33399
Pickett St
Length: 0.19 miles
Directions: N-S, SW-NE
Address range: 23800 to 24099
Directions: N-S, SW-NE
Address range: 23800 to 24099
Macomb St
Length: 0.19 miles
Direction: E-W
Address range: 33700 to 33999
Direction: E-W
Address range: 33700 to 33999
Adams St
Length: 0.15 miles
Direction: E-W
Address range: 33400 to 33699
Direction: E-W
Address range: 33400 to 33699
Liberty St
Length: 0.12 miles
Directions: N-S, SW-NE
Address range: 23600 to 23699
Directions: N-S, SW-NE
Address range: 23600 to 23699
Grace
Length: 0.12 miles
Direction: N-S
Address range: 23900 to 23999
Direction: N-S
Address range: 23900 to 23999
Earl Ct
Length: 0.04 miles
Direction: E-W
Address range: 23948 to 24099
Direction: E-W
Address range: 23948 to 24099
Glenview Ct
Length: 0.03 miles
Direction: SW-NE
Address range: 33700 to 33899
Direction: SW-NE
Address range: 33700 to 33899
Other features:
Upper Rouge Riv
Length: 0.22 miles
Directions: E-W, N-S
Directions: E-W, N-S