Historic Fort Collins neighborhood in Fort Collins, Colorado (CO), 80524 detailed profile
Settings
X


Business Search - 14 Million verified businesses
Area: 0.268 square miles
Population: 1,060
Population density:
| Historic Fort Collins: | 3,948 people per square mile |
| Fort Collins: | 3,636 people per square mile |

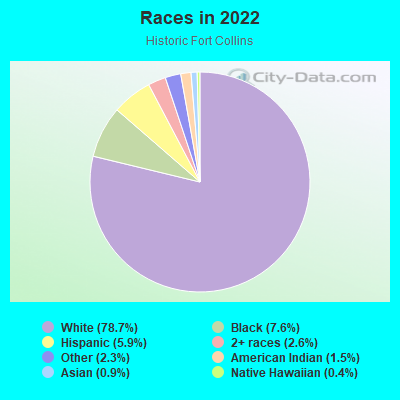
- 92178.7%White
- 897.6%Black
- 695.9%Hispanic or Latino
- 312.6%Two or more races
- 272.3%Some other race
- 181.5%American Indian
- 100.9%Asian
- 50.4%Native Hawaiian and Other
Pacific Islander
Distribution of median household income
![Distribution of median household income]()
- 19Less than $10,000
- 32$10,000 to $19,999
- 24$20,000 to $29,999
- 78$30,000 to $39,999
- 24$40,000 to $49,999
- 32$50,000 to $59,999
- 55$60,000 to $74,999
- 114$75,000 to $99,999
- 32$100,000 to $124,999
- 38$125,000 to $149,999
- 33$150,000 to $199,999
- 63$200,000 or more

Distribution of owner-occupied house/condo value
![Distribution of owner-occupied house/condo value]()
- 15Less than $50,000
- 10$100,000 to $149,999
- 6$150,000 to $199,999
- 8$200,000 to $249,999
- 10$250,000 to $299,999
- 28$300,000 to $399,999
- 13$400,000 to $499,999
- 95$500,000 to $749,999
- 53$750,000 to $999,999
- 18$1,000,000 or more

Distribution of rent paid by renters
![Distribution of rent paid by renters]()
- 4$400 to $499
- 8$500 to $599
- 10$600 to $699
- 17$700 to $799
- 68$800 to $899
- 9$900 to $999
- 52$1,000 to $1,249
- 86$1,250 to $1,499
- 87$1,500 to $1,999
- 47$2,000 or more

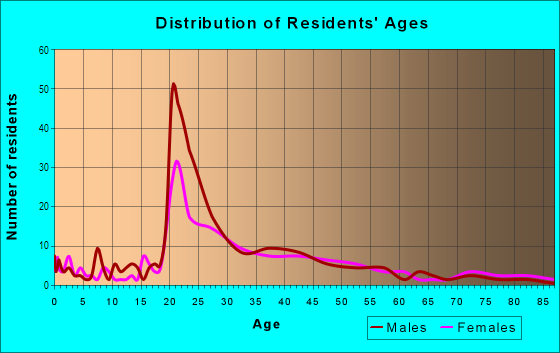
| Males: | 561 |
| Females: | 499 |
Males:
| This neighborhood: | 25.0 years |
| Whole city: | 30.2 years |
| This neighborhood: | 27.3 years |
| Whole city: | 30.8 years |
Percentage of family households:
| Historic Fort Collins: | 25.5% |
| Fort Collins: | 37.9% |
| Here: | 34.4% |
| Fort Collins: | 40.8% |
Percentage of married-couple families with children (among all households):
| Historic Fort Collins: | 30.4% |
| Fort Collins: | 31.7% |
Percentage of single-mother households (among all households):
| Historic Fort Collins: | 13.7% |
| Fort Collins: | 8.9% |
Percentage of never married males 15 years old and over:
Percentage of never married females 15 years old and over:
| Historic Fort Collins: | 31.1% |
| Fort Collins: | 24.1% |
Percentage of never married females 15 years old and over:
| Historic Fort Collins: | 23.9% |
| city: | 21.4% |
Percentage of people that speak English not well or not at all:
| Historic Fort Collins: | 0.6% |
| Fort Collins: | 0.8% |
Percentage of people born in this state:
Percentage of people born in another U.S. state:
Percentage of native residents but born outside the U.S.:
Percentage of foreign born residents:
| Here: | 31.2% |
| Fort Collins: | 36.7% |
Percentage of people born in another U.S. state:
| Historic Fort Collins: | 64.4% |
| Fort Collins: | 56.5% |
Percentage of native residents but born outside the U.S.:
| Here: | 1.4% |
| city: | 1.1% |
Percentage of foreign born residents:
| Here: | 2.9% |
| Fort Collins: | 5.7% |
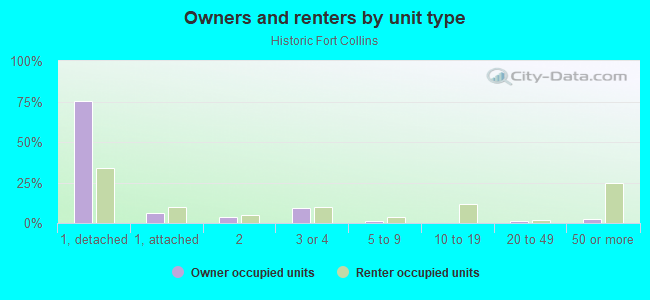
Owner-occupied
Renter-occupied

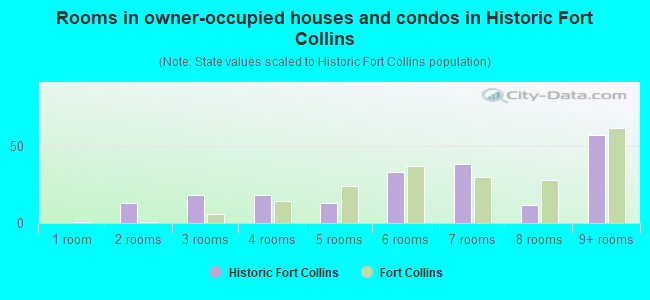
- Rooms in owner-occupied houses and condos in Historic Fort Collins
- 01 room
- 132 rooms
- 183 rooms
- 184 rooms
- 135 rooms
- 336 rooms
- 387 rooms
- 128 rooms
- 579+ rooms
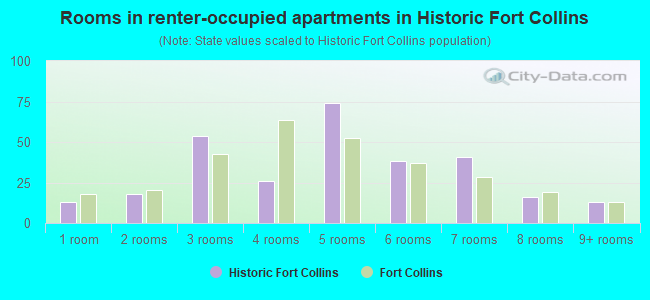
- Rooms in renter-occupied apartments in Historic Fort Collins
- 131 room
- 182 rooms
- 543 rooms
- 264 rooms
- 745 rooms
- 386 rooms
- 417 rooms
- 168 rooms
- 139+ rooms
Owner-occupied
Renter-occupied
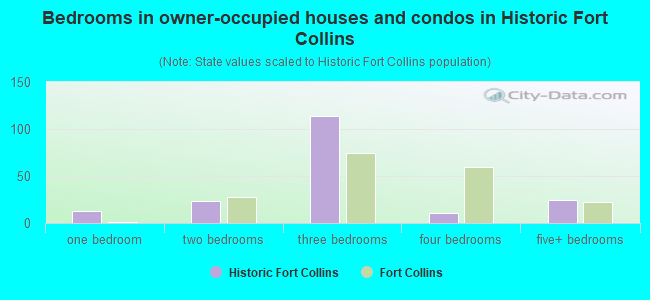
- Bedrooms in owner-occupied houses and condos in Historic Fort Collins
- 0no bedroom
- 131 bedroom
- 232 bedrooms
- 1143 bedrooms
- 114 bedrooms
- 255+ bedrooms
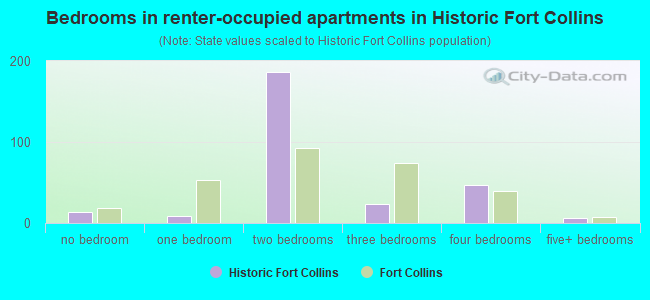
- Bedrooms in renter-occupied apartments in Historic Fort Collins
- 13no bedroom
- 91 bedroom
- 1862 bedrooms
- 243 bedrooms
- 474 bedrooms
- 65+ bedrooms
Average number of cars or other vehicles available in houses/condos:
Average number of cars or other vehicles available in apartments:
| This neighborhood: | |
| Fort Collins: |
Average number of cars or other vehicles available in apartments:
| Here: | |
| city: |
Percentage of units with a mortgage:
| Historic Fort Collins: | 69.1% |
| Fort Collins: | 66.9% |
Average estimated value of detached houses in 2022 (64.8% of all units):
| Historic Fort Collins: | $622,329 |
| Fort Collins: | $637,436 |
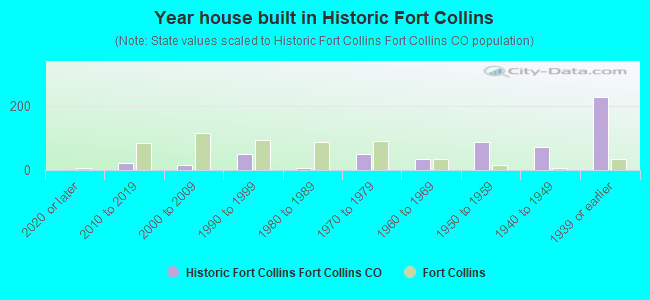
- Year house built in Historic Fort Collins
- 02020 or later
- 212010 to 2019
- 162000 to 2009
- 491990 to 1999
- 61980 to 1989
- 511970 to 1979
- 341960 to 1969
- 881950 to 1959
- 731940 to 1949
- 2261939 or earlier
City-data.com crime index for city in 2020 (higher means more crime):
| City: | 139.0 |
| U.S. average: | 219.5 |
Travel time to work (commute)
![Travel time to work (commute)]()
- 15Less than 5 minutes
- 925 to 9 minutes
- 10710 to 14 minutes
- 12815 to 19 minutes
- 3820 to 24 minutes
- 2625 to 29 minutes
- 3030 to 34 minutes
- 240 to 44 minutes
- 1945 to 59 minutes
- 460 to 89 minutes
- 290 or more minutes

Means of transportation to work
![Means of transportation to work]()
- 59.4%365Drove a car alone
- 2.6%16Carpooled
- 1.5%9Bus
- 0.5%3Motorcycle
- 12.2%75Bicycle
- 12.4%76Walked
- 2.3%14Other means
- 15.6%96Worked at home

Time leaving home to go to work
![Time leaving home to go to work]()
- 2412:00 a.m. to 4:59 a.m.
- 65:00 a.m. to 5:29 a.m.
- 146:00 a.m. to 6:29 a.m.
- 326:30 a.m. to 6:59 a.m.
- 607:00 a.m. to 7:29 a.m.
- 897:30 a.m. to 7:59 a.m.
- 568:00 a.m. to 8:29 a.m.
- 608:30 a.m. to 8:59 a.m.
- 529:00 a.m. to 9:59 a.m.
- 910:00 a.m. to 10:59 a.m.
- 911:00 a.m. to 11:59 a.m.
- 5712:00 p.m. to 3:59 p.m.
- 174:00 p.m. to 11:59 p.m.

Occupations of males:
- Percentage of males in management occupations (except farmers):
Here: 18.6% city: 13.4%
- Percentage of males in business and financial operations occupations:
Here: 4.7% city: 4.9%
- Percentage of males in computer and mathematical occupations:
Here: 2.5% city: 7.7%
- Percentage of males in architecture and engineering occupations:
Here: 2.1% city: 6.2%
- Percentage of males in life, physical, and social science occupations:
Here: 11.1% city: 3.5%
- Percentage of males in community and social services occupations:
Here: 4.3% city: 1.4%
- Percentage of males in education, training, and library occupations:
Here: 9.7% city: 5.7%
- Percentage of males in arts, design, entertainment, sports, and media occupations:
Here: 4.0% city: 2.7%
- Percentage of males in healthcare practitioners and technical occupations:
Here: 5.4% city: 3.5%
- Percentage of males in service occupations:
Here: 3.1% city: 13.3%
- Percentage of males in sales and office occupations:
Here: 25.5% city: 15.5%
- Percentage of males in production occupations:
Here: 7.1% city: 4.0%
- Percentage of males in transportation occupations:
Here: 1.8% city: 4.2%
Occupations of females:
- Percentage of females in management occupations (except farmers):
Here: 5.2% city: 9.7%
- Percentage of females in business and financial operations occupations:
Here: 4.9% city: 6.9%
- Percentage of females in computer and mathematical occupations:
Here: 5.8% city: 2.5%
- Percentage of females in architecture and engineering occupations:
Here: 2.2% city: 1.5%
- Percentage of females in life, physical, and social science occupations:
Here: 17.5% city: 2.6%
- Percentage of females in education, training, and library occupations:
Here: 21.5% city: 12.1%
- Percentage of females in healthcare practitioners and technical occupations:
Here: 3.4% city: 8.9%
- Percentage of females in service occupations:
Here: 24.6% city: 20.9%
- Percentage of females in sales and office occupations:
Here: 14.9% city: 23.2%
- Percentage of females in production occupations:
Here: 1.2% city: 0.9%
- Percentage of females in transportation occupations:
Here: 1.4% city: 0.8%
Percentage of people 16-64 in Armed Forces:
| Historic Fort Collins: | 0.8% |
| Fort Collins: | 0.9% |
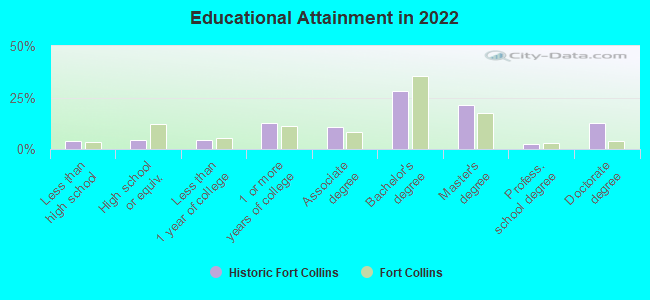
Education in this neighborhood (subdivision or community):
- Percentage of people 3 years and older in K-12 schools:
Historic Fort Collins: 13.0% Fort Collins: 14.1%
- Percentage of people 3 years and older in undergraduate colleges:
Historic Fort Collins: 15.4% Fort Collins: 16.7%
- Percentage of people 3 years and older in grad. or professional schools:
Historic Fort Collins: 6.5% Fort Collins: 4.2%
- Percentage of students K-12 enrolled in private schools:
Historic Fort Collins: 4.4% Fort Collins: 7.2%
Percentage of population below poverty level:
| Historic Fort Collins: | 10.3% |
| Fort Collins: | 18.1% |
Percentage of married-couple families with both working:
| Historic Fort Collins: | 83.4% |
| Fort Collins: | 76.1% |
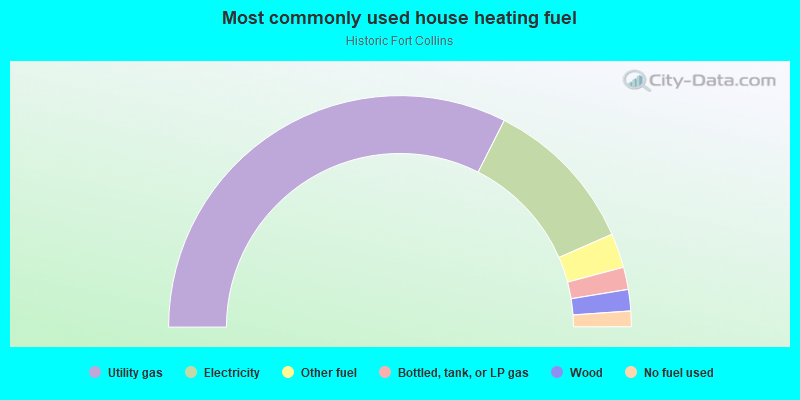
- 64.9%Utility gas
- 22.0%Electricity
- 4.8%Other fuel
- 3.1%Bottled, tank, or LP gas
- 3.0%Wood
- 2.2%No fuel used
Roads and streets:
E Pitkin St
Length: 0.65 miles
Direction: E-W
Address range: 152 to 699
Direction: E-W
Address range: 152 to 699
E Prospect Rd
Length: 0.64 miles
Direction: E-W
Address range: 148 to 799
Direction: E-W
Address range: 148 to 799
E Lake St
Length: 0.62 miles
Direction: E-W
Address range: 100 to 699
Direction: E-W
Address range: 100 to 699
Edwards St
Length: 0.62 miles
Direction: E-W
Address range: 150 to 657
Direction: E-W
Address range: 150 to 657
Garfield St
Length: 0.58 miles
Direction: E-W
Address range: 150 to 699
Direction: E-W
Address range: 150 to 699
Circle Dr
Length: 0.55 miles
Directions: E-W, N-S
Address range: 1 to 499
Directions: E-W, N-S
Address range: 1 to 499
Whedbee St
Length: 0.46 miles
Directions: N-S, SW-NE
Address range: 1050 to 1599
Directions: N-S, SW-NE
Address range: 1050 to 1599
Peterson St
Length: 0.46 miles
Direction: N-S
Address range: 1048 to 1599
Direction: N-S
Address range: 1048 to 1599
Remington St
Length: 0.43 miles
Directions: N-S, SE-NW
Address range: 1100 to 1599
Directions: N-S, SE-NW
Address range: 1100 to 1599
Mathews St
Length: 0.30 miles
Direction: N-S
Address range: 1048 to 1599
Direction: N-S
Address range: 1048 to 1599
Stover St
Length: 0.27 miles
Direction: N-S
Address range: 1300 to 1599
Direction: N-S
Address range: 1300 to 1599
Smith St
Length: 0.22 miles
Direction: N-S
Address range: 1100 to 1499
Direction: N-S
Address range: 1100 to 1499
Buckeye St
Length: 0.17 miles
Direction: E-W
Address range: 100 to 499
Direction: E-W
Address range: 100 to 499