Holland neighborhood in Minneapolis, Minnesota (MN), 55418 detailed profile
Settings
X

Business Search - 14 Million verified businesses
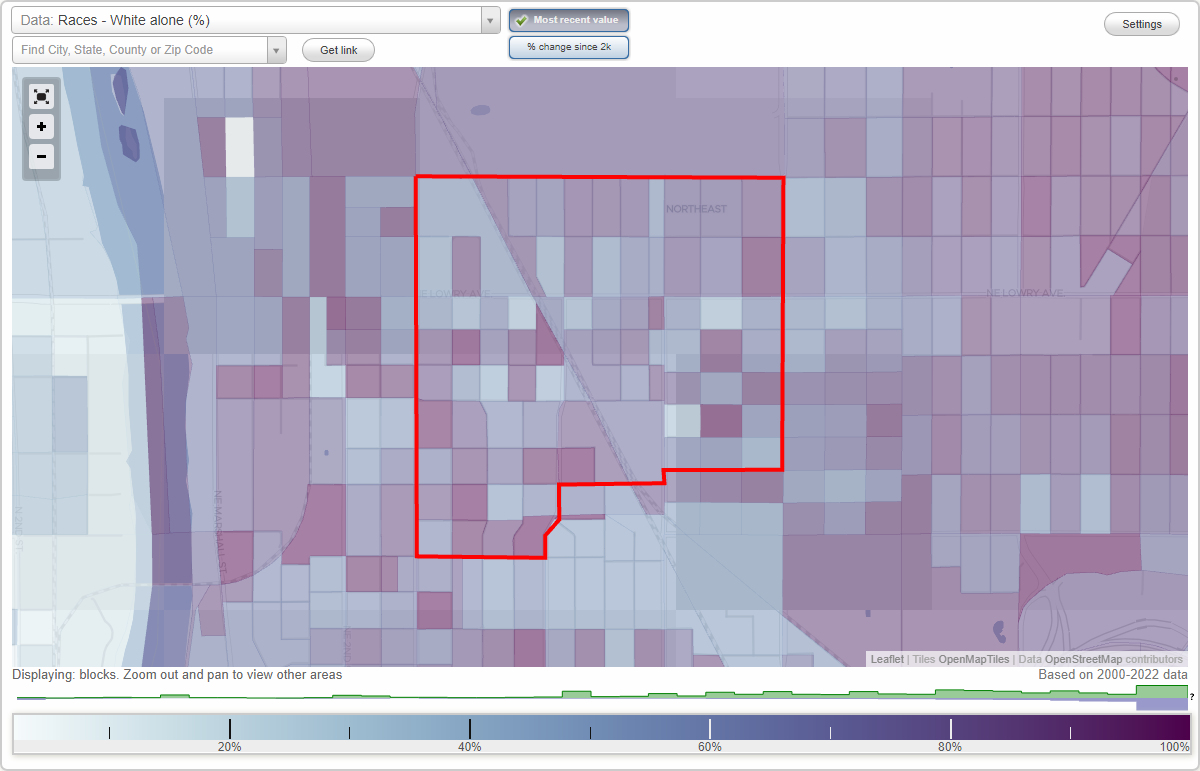
Area: 0.531 square miles
Population: 4,674
Population density:
| Holland: | 8,803 people per square mile |
| Minneapolis: | 7,744 people per square mile |

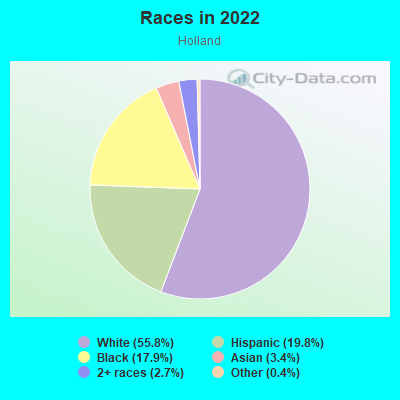
- 2,67055.8%White
- 94719.8%Hispanic or Latino
- 85417.9%Black
- 1613.4%Asian
- 1302.7%Two or more races
- 170.4%Some other race
- 20.04%American Indian
Distribution of median household income
![Distribution of median household income]()
- 122Less than $10,000
- 415$10,000 to $19,999
- 175$20,000 to $29,999
- 186$30,000 to $39,999
- 144$40,000 to $49,999
- 136$50,000 to $59,999
- 275$60,000 to $74,999
- 178$75,000 to $99,999
- 137$100,000 to $124,999
- 185$125,000 to $149,999
- 235$150,000 to $199,999
- 146$200,000 or more

Distribution of owner-occupied house/condo value
![Distribution of owner-occupied house/condo value]()
- 67Less than $50,000
- 161$50,000 to $99,999
- 218$100,000 to $149,999
- 117$150,000 to $199,999
- 68$200,000 to $249,999
- 255$250,000 to $299,999
- 377$300,000 to $399,999
- 46$400,000 to $499,999
- 28$500,000 to $749,999
- 72$750,000 to $999,999
- 46$1,000,000 or more

Distribution of rent paid by renters
![Distribution of rent paid by renters]()
- 15Less than $100
- 17$100 to $199
- 17$200 to $299
- 99$300 to $399
- 94$400 to $499
- 75$500 to $599
- 190$600 to $699
- 188$700 to $799
- 54$800 to $899
- 120$900 to $999
- 277$1,000 to $1,249
- 223$1,250 to $1,499
- 167$1,500 to $1,999
- 140$2,000 or more

Median rent in 2022:
| Holland: | $1,253 |
| Minneapolis: | $1,159 |
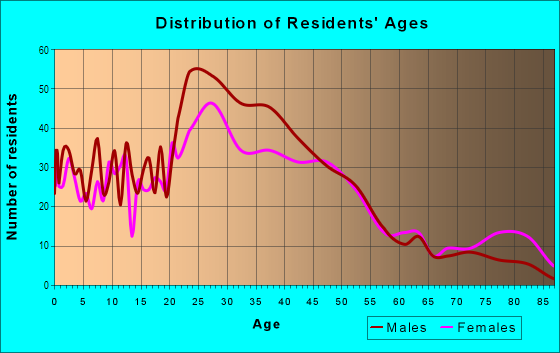
| Males: | 2,591 |
| Females: | 2,082 |
Males:
| This neighborhood: | 32.4 years |
| Whole city: | 33.3 years |
| This neighborhood: | 32.5 years |
| Whole city: | 33.2 years |
Average household size:
| Holland: | 3.4 people |
| Minneapolis: | 2.1 people |
Percentage of family households:
| Holland: | 38.9% |
| Minneapolis: | 34.1% |
| Here: | 35.7% |
| Minneapolis: | 29.8% |
Percentage of married-couple families with children (among all households):
| Holland: | 35.0% |
| Minneapolis: | 31.8% |
Percentage of single-mother households (among all households):
| Holland: | 10.2% |
| Minneapolis: | 10.5% |
Percentage of never married males 15 years old and over:
Percentage of never married females 15 years old and over:
| Holland: | 33.0% |
| Minneapolis: | 27.0% |
Percentage of never married females 15 years old and over:
| Holland: | 15.9% |
| city: | 25.4% |
Percentage of people that speak English not well or not at all:
| Holland: | 13.1% |
| Minneapolis: | 3.8% |
Percentage of people born in this state:
Percentage of people born in another U.S. state:
Percentage of native residents but born outside the U.S.:
Percentage of foreign born residents:
| Here: | 48.3% |
| Minneapolis: | 51.9% |
Percentage of people born in another U.S. state:
| Holland: | 23.8% |
| Minneapolis: | 31.8% |
Percentage of native residents but born outside the U.S.:
| Here: | 2.2% |
| city: | 1.5% |
Percentage of foreign born residents:
| Here: | 25.7% |
| Minneapolis: | 14.7% |
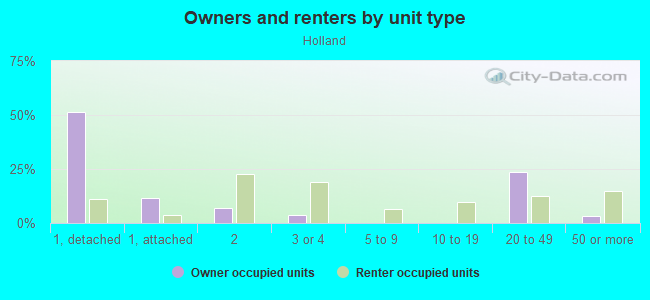
Owner-occupied
Renter-occupied

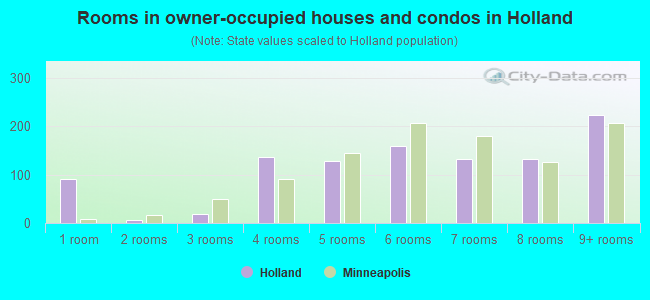
- Rooms in owner-occupied houses and condos in Holland
- 911 room
- 72 rooms
- 193 rooms
- 1364 rooms
- 1285 rooms
- 1596 rooms
- 1337 rooms
- 1328 rooms
- 2239+ rooms
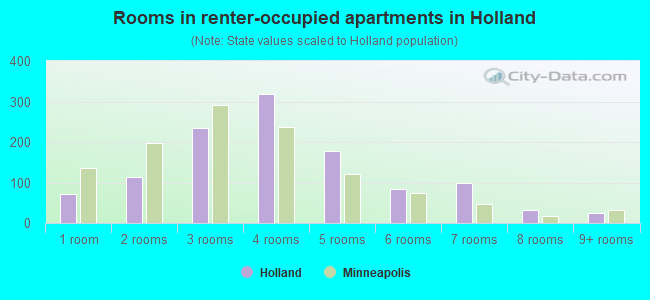
- Rooms in renter-occupied apartments in Holland
- 721 room
- 1132 rooms
- 2353 rooms
- 3194 rooms
- 1775 rooms
- 836 rooms
- 1007 rooms
- 328 rooms
- 249+ rooms
Owner-occupied
Renter-occupied
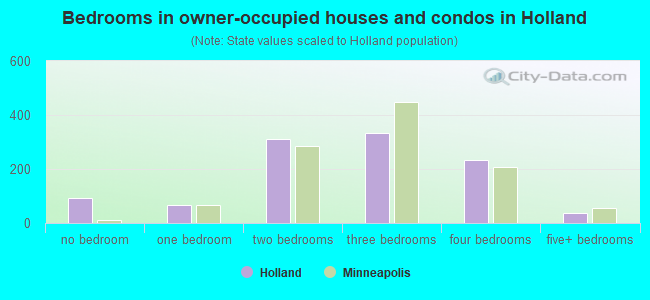
- Bedrooms in owner-occupied houses and condos in Holland
- 91no bedroom
- 651 bedroom
- 3112 bedrooms
- 3323 bedrooms
- 2354 bedrooms
- 375+ bedrooms
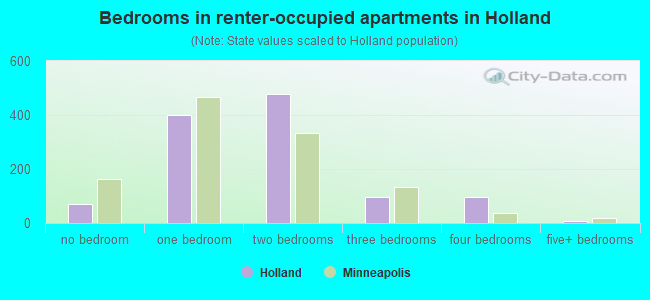
- Bedrooms in renter-occupied apartments in Holland
- 72no bedroom
- 3991 bedroom
- 4762 bedrooms
- 983 bedrooms
- 984 bedrooms
- 95+ bedrooms
Average number of cars or other vehicles available in houses/condos:
Average number of cars or other vehicles available in apartments:
| This neighborhood: | 1.9 |
| Minneapolis: | 1.6 |
Average number of cars or other vehicles available in apartments:
| Here: | 1.2 |
| city: | 1.1 |
Percentage of units with a mortgage:
| Holland: | 67.1% |
| Minneapolis: | 71.8% |
Average estimated value of detached houses in 2022 (38.3% of all units):
| Holland: | $301,409 |
| Minnesota: | $374,552 |
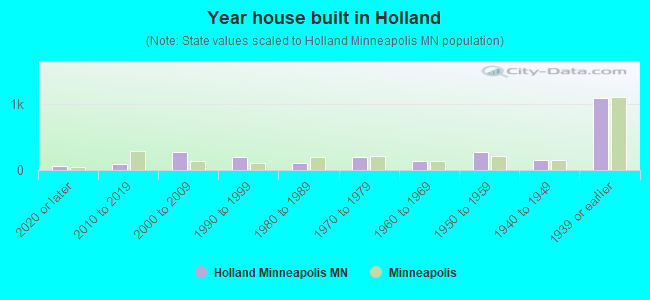
- Year house built in Holland
- 542020 or later
- 982010 to 2019
- 2692000 to 2009
- 1891990 to 1999
- 991980 to 1989
- 1931970 to 1979
- 1431960 to 1969
- 2761950 to 1959
- 1531940 to 1949
- 1,0881939 or earlier
City-data.com crime index for city in 2020 (higher means more crime):
| City: | 600.2 |
| U.S. average: | 219.5 |
Travel time to work (commute)
![Travel time to work (commute)]()
- 28Less than 5 minutes
- 1845 to 9 minutes
- 44410 to 14 minutes
- 57015 to 19 minutes
- 60720 to 24 minutes
- 13525 to 29 minutes
- 39230 to 34 minutes
- 6435 to 39 minutes
- 15340 to 44 minutes
- 9645 to 59 minutes
- 9160 to 89 minutes
- 2490 or more minutes

Means of transportation to work
![Means of transportation to work]()
- 63.9%1,713Drove a car alone
- 11.2%299Carpooled
- 7.2%192Bus
- 1.5%41Light rail, streetcar or trolley
- 0.5%14Taxi
- 2.6%71Motorcycle
- 3.8%101Bicycle
- 1.3%35Walked
- 2.1%56Other means
- 16.0%429Worked at home

Time leaving home to go to work
![Time leaving home to go to work]()
- 14112:00 a.m. to 4:59 a.m.
- 1005:00 a.m. to 5:29 a.m.
- 735:30 a.m. to 5:59 a.m.
- 2056:00 a.m. to 6:29 a.m.
- 826:30 a.m. to 6:59 a.m.
- 3357:00 a.m. to 7:29 a.m.
- 3477:30 a.m. to 7:59 a.m.
- 2568:00 a.m. to 8:29 a.m.
- 2108:30 a.m. to 8:59 a.m.
- 3299:00 a.m. to 9:59 a.m.
- 10010:00 a.m. to 10:59 a.m.
- 8611:00 a.m. to 11:59 a.m.
- 35112:00 p.m. to 3:59 p.m.
- 1244:00 p.m. to 11:59 p.m.

Occupations of males:
- Percentage of males in management occupations (except farmers):
Here: 12.0% city: 12.1%
- Percentage of males in business and financial operations occupations:
Here: 4.3% city: 9.1%
- Percentage of males in computer and mathematical occupations:
Here: 1.9% city: 8.4%
- Percentage of males in architecture and engineering occupations:
Here: 3.6% city: 4.6%
- Percentage of males in life, physical, and social science occupations:
Here: 1.7% city: 2.0%
- Percentage of males in community and social services occupations:
Here: 2.5% city: 1.8%
- Percentage of males in education, training, and library occupations:
Here: 3.3% city: 5.2%
- Percentage of males in arts, design, entertainment, sports, and media occupations:
Here: 8.8% city: 4.0%
- Percentage of males in service occupations:
Here: 18.2% city: 12.6%
- Percentage of males in sales and office occupations:
Here: 9.1% city: 15.3%
- Percentage of males in farming, fishing, and forestry occupations:
Here: 1.3% city: 0.3%
- Percentage of males in construction, extraction, and maintenance occupations:
Here: 10.6% city: 3.3%
- Percentage of males in production occupations:
Here: 9.2% city: 5.8%
- Percentage of males in transportation occupations:
Here: 3.3% city: 4.1%
- Percentage of males in material moving occupations:
Here: 5.3% city: 3.6%
Occupations of females:
- Percentage of females in management occupations (except farmers):
Here: 10.9% city: 11.4%
- Percentage of females in business and financial operations occupations:
Here: 10.7% city: 9.8%
- Percentage of females in architecture and engineering occupations:
Here: 2.4% city: 1.2%
- Percentage of females in life, physical, and social science occupations:
Here: 1.2% city: 2.3%
- Percentage of females in legal occupations:
Here: 1.0% city: 2.3%
- Percentage of females in education, training, and library occupations:
Here: 6.6% city: 10.6%
- Percentage of females in arts, design, entertainment, sports, and media occupations:
Here: 22.2% city: 5.6%
- Percentage of females in healthcare practitioners and technical occupations:
Here: 6.4% city: 8.3%
- Percentage of females in service occupations:
Here: 13.2% city: 17.8%
- Percentage of females in sales and office occupations:
Here: 15.0% city: 18.7%
- Percentage of females in production occupations:
Here: 4.2% city: 2.7%
- Percentage of females in transportation occupations:
Here: 1.6% city: 0.9%
- Percentage of females in material moving occupations:
Here: 3.3% city: 1.5%
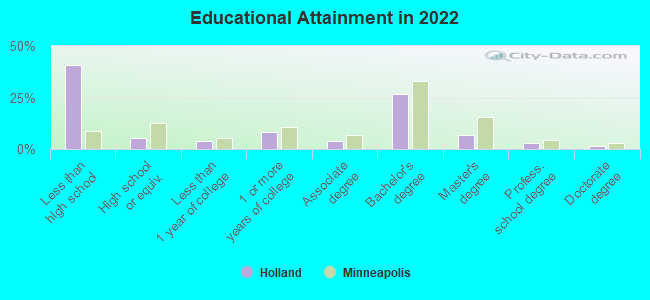
Education in this neighborhood (subdivision or community):
- Percentage of people 3 years and older in K-12 schools:
Holland: 19.4% Minneapolis: 14.0%
- Percentage of people 3 years and older in undergraduate colleges:
Holland: 3.8% Minneapolis: 8.6%
- Percentage of people 3 years and older in grad. or professional schools:
Holland: 2.7% Minneapolis: 2.9%
- Percentage of students K-12 enrolled in private schools:
Holland: 29.3% Minneapolis: 14.1%
Percentage of population below poverty level:
| Holland: | 20.7% |
| Minneapolis: | 17.2% |
Median year owner moved in (as recorded in 2022):
Median year renter moved in (as recorded in 2022):
| Holland: | 2003 |
| Minneapolis: | 2012 |
Median year renter moved in (as recorded in 2022):
| Holland: | 2011 |
| Minneapolis: | 2021 |
Percentage of married-couple families with both working:
| Holland: | 97.1% |
| Minneapolis: | 73.9% |
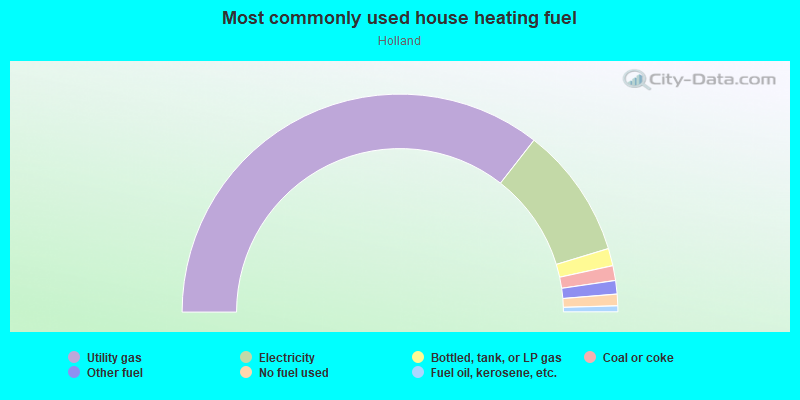
- 71.1%Utility gas
- 19.5%Electricity
- 2.6%Bottled, tank, or LP gas
- 2.2%Coal or coke
- 2.0%Other fuel
- 1.7%No fuel used
- 0.9%Fuel oil, kerosene, etc.
Roads and streets:
22nd Ave NE
Length: 0.98 miles
Direction: E-W
Address range: 400 to 929
Direction: E-W
Address range: 400 to 929
Lowry Ave NE (Co Rd 153)
Length: 0.98 miles
Direction: E-W
Address range: 400 to 929
Direction: E-W
Address range: 400 to 929
24th Ave NE
Length: 0.90 miles
Directions: E-W, N-S
Address range: 400 to 929
Directions: E-W, N-S
Address range: 400 to 929
26th Ave NE
Length: 0.90 miles
Direction: E-W
Address range: 422 to 929
Direction: E-W
Address range: 422 to 929
23rd Ave NE
Length: 0.90 miles
Direction: E-W
Address range: 400 to 931
Direction: E-W
Address range: 400 to 931
19th Ave NE
Length: 0.83 miles
Direction: E-W
Address range: 400 to 899
Direction: E-W
Address range: 400 to 899
20th Ave NE
Length: 0.77 miles
Direction: E-W
Address range: 400 to 930
Direction: E-W
Address range: 400 to 930
Washington St NE
Length: 0.70 miles
Directions: N-S, SE-NW, SW-NE
Address range: 1700 to 2599
Directions: N-S, SE-NW, SW-NE
Address range: 1700 to 2599
5th St NE
Length: 0.67 miles
Directions: N-S, SE-NW, SW-NE
Address range: 1700 to 2599
Directions: N-S, SE-NW, SW-NE
Address range: 1700 to 2599
4th St NE
Length: 0.67 miles
Direction: N-S
Address range: 1705 to 2591
Direction: N-S
Address range: 1705 to 2591
6th St NE
Length: 0.56 miles
Directions: N-S, SW-NE
Address range: 1700 to 2499
Directions: N-S, SW-NE
Address range: 1700 to 2499
Monroe St NE
Length: 0.51 miles
Directions: N-S, SE-NW
Address range: 1874 to 2599
Directions: N-S, SE-NW
Address range: 1874 to 2599
NE Jackson St
Length: 0.49 miles
Direction: N-S
Address range: 1900 to 2599
Direction: N-S
Address range: 1900 to 2599
Quincy St NE
Length: 0.49 miles
Direction: N-S
Address range: 1900 to 2599
Direction: N-S
Address range: 1900 to 2599
Jefferson St NE
Length: 0.45 miles
Directions: N-S, SW-NE
Address range: 1900 to 2599
Directions: N-S, SW-NE
Address range: 1900 to 2599
NE Madison St
Length: 0.41 miles
Direction: N-S
Address range: 2100 to 2599
Direction: N-S
Address range: 2100 to 2599
NE Howard St
Length: 0.34 miles
Directions: N-S, SW-NE
Address range: 2200 to 2599
Directions: N-S, SW-NE
Address range: 2200 to 2599
7th St NE
Length: 0.28 miles
Directions: N-S, SE-NW
Address range: 2200 to 2599
Directions: N-S, SE-NW
Address range: 2200 to 2599
18th Ave NE
Length: 0.10 miles
Direction: E-W
Address range: 400 to 499
Direction: E-W
Address range: 400 to 499
17th Ave NE
Length: 0.09 miles
Direction: E-W
Address range: 600 to 619
Direction: E-W
Address range: 600 to 619
Railroad features:
Burlington Northern Santa Fe Rlwy
Length: 0.60 miles
Directions: N-S, SE-NW
Directions: N-S, SE-NW
Abandoned RR
Length: 0.32 miles
Direction: E-W
Direction: E-W