Hollywood Park neighborhood in Lincoln Park, Michigan (MI), 48146, 48195 detailed profile
Settings
X


Business Search - 14 Million verified businesses
Area: 0.218 square miles
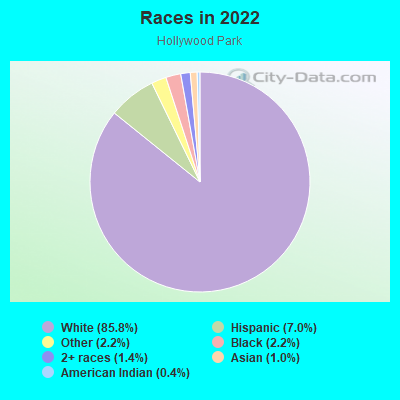
Population: 2,448
Population density:
| Hollywood Park: | 11,248 people per square mile |
| Lincoln Park: | 6,801 people per square mile |

- 2,16785.8%White
- 1767.0%Hispanic or Latino
- 552.2%Black
- 562.2%Some other race
- 361.4%Two or more races
- 261.0%Asian
- 90.4%American Indian
Median household income in 2022:
| Hollywood Park: | $57,636 |
| Lincoln Park: | $55,777 |
Distribution of median household income
![Distribution of median household income]()
- 54Less than $10,000
- 93$10,000 to $19,999
- 112$20,000 to $29,999
- 71$30,000 to $39,999
- 94$40,000 to $49,999
- 141$50,000 to $59,999
- 55$60,000 to $74,999
- 152$75,000 to $99,999
- 55$100,000 to $124,999
- 47$125,000 to $149,999
- 49$150,000 to $199,999
- 43$200,000 or more

Distribution of owner-occupied house/condo value
![Distribution of owner-occupied house/condo value]()
- 37Less than $50,000
- 230$50,000 to $99,999
- 355$100,000 to $149,999
- 114$150,000 to $199,999
- 39$200,000 to $249,999
- 11$250,000 to $299,999
- 13$300,000 to $399,999
- 9$400,000 to $499,999

Distribution of rent paid by renters
![Distribution of rent paid by renters]()
- 8$100 to $199
- 31$200 to $299
- 8$400 to $499
- 27$500 to $599
- 84$600 to $699
- 130$700 to $799
- 26$800 to $899
- 53$900 to $999
- 26$1,000 to $1,249
- 5$1,250 to $1,499
- 19$1,500 to $1,999

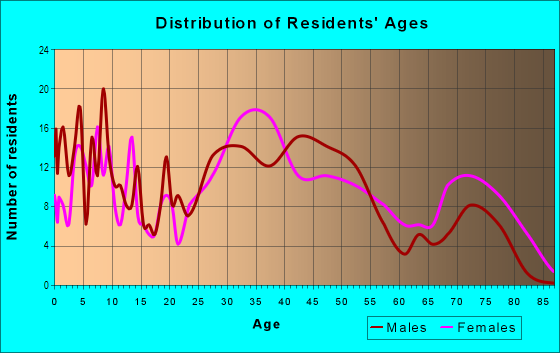
| Males: | 1,168 |
| Females: | 1,280 |
Males:
| This neighborhood: | 33.3 years |
| Whole city: | 33.8 years |
| This neighborhood: | 37.4 years |
| Whole city: | 35.4 years |
Average household size:
| Hollywood Park: | 2.4 people |
| Lincoln Park: | 2.6 people |
Percentage of family households:
| Hollywood Park: | 45.4% |
| Lincoln Park: | 44.6% |
| Here: | 40.9% |
| Lincoln Park: | 34.7% |
Percentage of married-couple families with children (among all households):
| Hollywood Park: | 19.4% |
| Lincoln Park: | 22.5% |
Percentage of single-mother households (among all households):
| Hollywood Park: | 6.5% |
| Lincoln Park: | 9.8% |
Percentage of never married males 15 years old and over:
Percentage of never married females 15 years old and over:
| Hollywood Park: | 18.3% |
| Lincoln Park: | 22.7% |
Percentage of never married females 15 years old and over:
| Hollywood Park: | 16.4% |
| city: | 18.0% |
Percentage of people that speak English not well or not at all:
| Hollywood Park: | 2.7% |
| Lincoln Park: | 3.5% |
Percentage of people born in this state:
Percentage of people born in another U.S. state:
Percentage of native residents but born outside the U.S.:
Percentage of foreign born residents:
| Here: | 88.6% |
| Lincoln Park: | 77.8% |
Percentage of people born in another U.S. state:
| Hollywood Park: | 9.2% |
| Lincoln Park: | 10.7% |
Percentage of native residents but born outside the U.S.:
| Here: | 0.2% |
| city: | 1.1% |
Percentage of foreign born residents:
| Here: | 2.2% |
| Lincoln Park: | 10.4% |
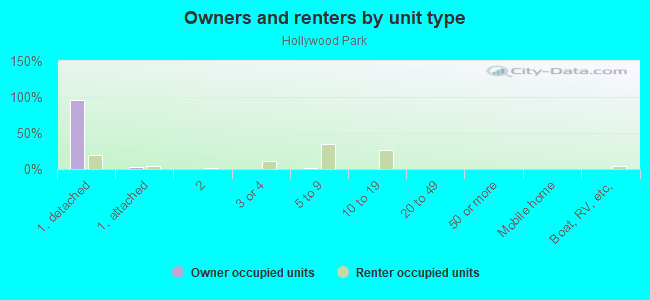
Owner-occupied
Renter-occupied

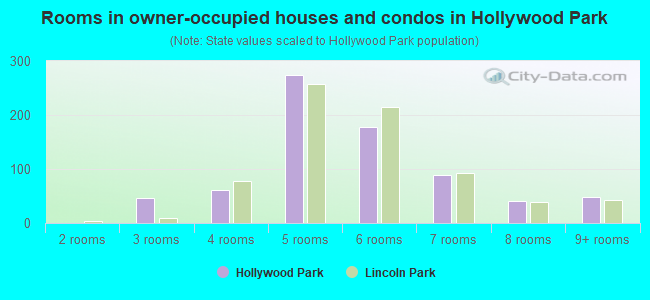
- Rooms in owner-occupied houses and condos in Hollywood Park
- 01 room
- 02 rooms
- 463 rooms
- 614 rooms
- 2745 rooms
- 1776 rooms
- 887 rooms
- 418 rooms
- 489+ rooms
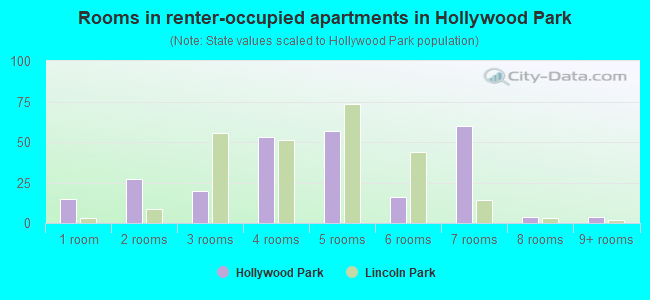
- Rooms in renter-occupied apartments in Hollywood Park
- 151 room
- 272 rooms
- 203 rooms
- 534 rooms
- 575 rooms
- 166 rooms
- 607 rooms
- 48 rooms
- 49+ rooms
Owner-occupied
Renter-occupied
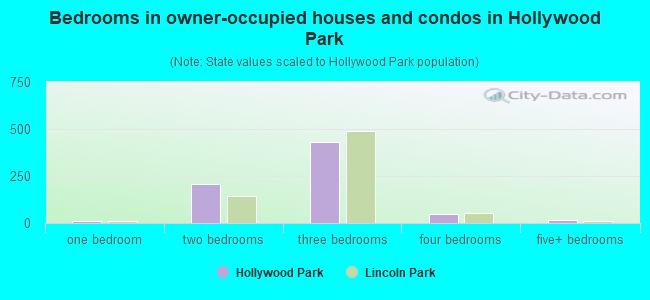
- Bedrooms in owner-occupied houses and condos in Hollywood Park
- 0no bedroom
- 131 bedroom
- 2062 bedrooms
- 4313 bedrooms
- 464 bedrooms
- 175+ bedrooms
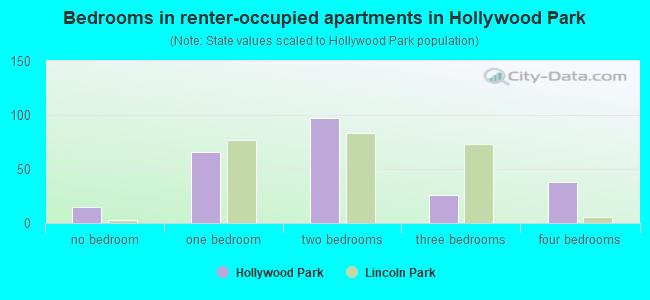
- Bedrooms in renter-occupied apartments in Hollywood Park
- 15no bedroom
- 661 bedroom
- 972 bedrooms
- 263 bedrooms
- 384 bedrooms
- 05+ bedrooms
Average number of cars or other vehicles available in houses/condos:
Average number of cars or other vehicles available in apartments:
| This neighborhood: | 1.8 |
| Lincoln Park: | 1.9 |
Average number of cars or other vehicles available in apartments:
| Here: | 1.5 |
| city: | 1.2 |
Percentage of units with a mortgage:
| Hollywood Park: | 56.6% |
| Lincoln Park: | 51.3% |
Average estimated value of detached houses in 2022 (84.4% of all units):
| Hollywood Park: | $127,668 |
| Michigan: | $280,038 |
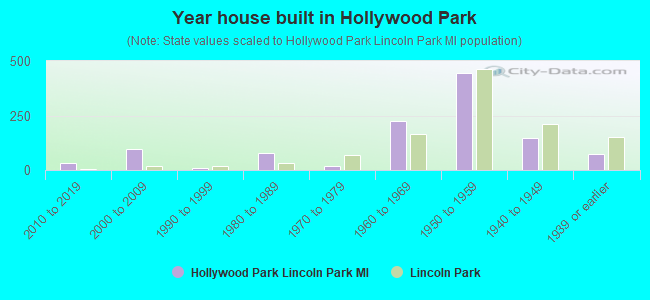
- Year house built in Hollywood Park
- 02020 or later
- 342010 to 2019
- 982000 to 2009
- 101990 to 1999
- 801980 to 1989
- 201970 to 1979
- 2261960 to 1969
- 4461950 to 1959
- 1451940 to 1949
- 751939 or earlier
City-data.com crime index for city in 2020 (higher means more crime):
| City: | 261.8 |
| U.S. average: | 219.5 |
Travel time to work (commute)
![Travel time to work (commute)]()
- 9Less than 5 minutes
- 825 to 9 minutes
- 7910 to 14 minutes
- 14715 to 19 minutes
- 7620 to 24 minutes
- 5725 to 29 minutes
- 12330 to 34 minutes
- 3935 to 39 minutes
- 2440 to 44 minutes
- 4345 to 59 minutes
- 2760 to 89 minutes
- 790 or more minutes

Means of transportation to work
![Means of transportation to work]()
- 89.2%783Drove a car alone
- 6.0%53Carpooled
- 0.6%5Bicycle
- 1.4%12Walked
- 1.5%13Other means
- 3.3%29Worked at home

Time leaving home to go to work
![Time leaving home to go to work]()
- 1712:00 a.m. to 4:59 a.m.
- 185:00 a.m. to 5:29 a.m.
- 595:30 a.m. to 5:59 a.m.
- 736:00 a.m. to 6:29 a.m.
- 496:30 a.m. to 6:59 a.m.
- 837:00 a.m. to 7:29 a.m.
- 947:30 a.m. to 7:59 a.m.
- 338:00 a.m. to 8:29 a.m.
- 708:30 a.m. to 8:59 a.m.
- 349:00 a.m. to 9:59 a.m.
- 2810:00 a.m. to 10:59 a.m.
- 1311:00 a.m. to 11:59 a.m.
- 6812:00 p.m. to 3:59 p.m.
- 664:00 p.m. to 11:59 p.m.

Occupations of males:
- Percentage of males in management occupations (except farmers):
Here: 5.8% city: 5.7%
- Percentage of males in business and financial operations occupations:
Here: 1.7% city: 2.7%
- Percentage of males in computer and mathematical occupations:
Here: 1.7% city: 0.8%
- Percentage of males in healthcare practitioners and technical occupations:
Here: 1.1% city: 2.1%
- Percentage of males in service occupations:
Here: 11.8% city: 11.6%
- Percentage of males in sales and office occupations:
Here: 14.1% city: 14.3%
- Percentage of males in construction, extraction, and maintenance occupations:
Here: 3.1% city: 12.1%
- Percentage of males in production occupations:
Here: 26.4% city: 15.5%
- Percentage of males in transportation occupations:
Here: 5.9% city: 8.1%
- Percentage of males in material moving occupations:
Here: 10.3% city: 13.4%
Occupations of females:
- Percentage of females in management occupations (except farmers):
Here: 15.2% city: 7.7%
- Percentage of females in business and financial operations occupations:
Here: 2.1% city: 5.3%
- Percentage of females in community and social services occupations:
Here: 3.5% city: 1.9%
- Percentage of females in legal occupations:
Here: 7.0% city: 0.6%
- Percentage of females in education, training, and library occupations:
Here: 2.0% city: 4.0%
- Percentage of females in arts, design, entertainment, sports, and media occupations:
Here: 1.3% city: 1.0%
- Percentage of females in healthcare practitioners and technical occupations:
Here: 3.8% city: 5.1%
- Percentage of females in service occupations:
Here: 22.7% city: 27.3%
- Percentage of females in sales and office occupations:
Here: 26.2% city: 31.0%
- Percentage of females in production occupations:
Here: 12.1% city: 6.3%
- Percentage of females in material moving occupations:
Here: 3.2% city: 5.7%
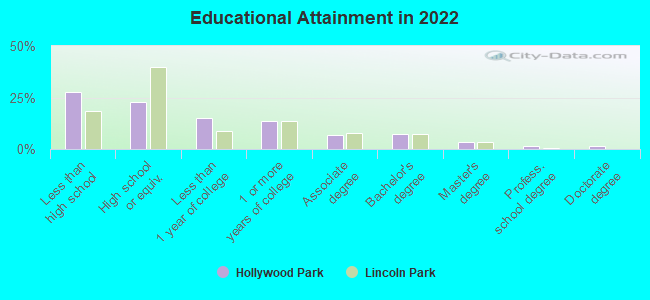
Education in this neighborhood (subdivision or community):
- Percentage of people 3 years and older in K-12 schools:
Hollywood Park: 23.8% Lincoln Park: 17.8%
- Percentage of people 3 years and older in undergraduate colleges:
Hollywood Park: 2.3% Lincoln Park: 4.3%
- Percentage of people 3 years and older in grad. or professional schools:
Hollywood Park: 2.2% Lincoln Park: 0.6%
- Percentage of students K-12 enrolled in private schools:
Hollywood Park: 29.1% Lincoln Park: 9.0%
Percentage of population below poverty level:
| Hollywood Park: | 13.8% |
| Lincoln Park: | 19.8% |
Median year owner moved in (as recorded in 2022):
Median year renter moved in (as recorded in 2022):
| Hollywood Park: | 2006 |
| Lincoln Park: | 2007 |
Median year renter moved in (as recorded in 2022):
| Hollywood Park: | 2015 |
| Lincoln Park: | 2016 |
Percentage of married-couple families with both working:
| Hollywood Park: | 95.2% |
| Lincoln Park: | 49.8% |
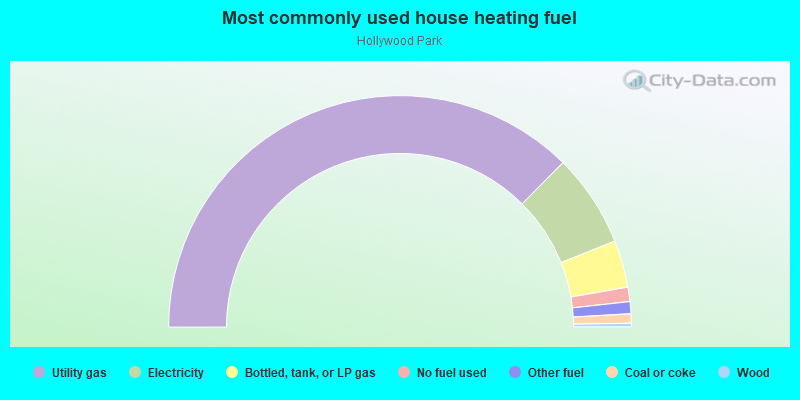
- 74.9%Utility gas
- 13.0%Electricity
- 6.6%Bottled, tank, or LP gas
- 2.0%No fuel used
- 1.7%Other fuel
- 1.3%Coal or coke
- 0.5%Wood
Highways in this neighborhood:
State Hwy 85 (Fort St)
Length: 0.66 miles
Direction: N-S
Direction: N-S
Roads and streets:
Goddard St
Length: 0.61 miles
Directions: E-W, SE-NW
Address range: 1100 to 1625
Directions: E-W, SE-NW
Address range: 1100 to 1625
Brest Ave (Brest St)
Length: 0.53 miles
Direction: E-W
Address range: 1200 to 13499
Direction: E-W
Address range: 1200 to 13499
Oakdale St
Length: 0.48 miles
Direction: E-W
Address range: 12700 to 13399
Direction: E-W
Address range: 12700 to 13399
Netherwood St
Length: 0.48 miles
Direction: E-W
Address range: 12700 to 13399
Direction: E-W
Address range: 12700 to 13399
Howard St
Length: 0.36 miles
Direction: N-S
Address range: 4078 to 12199
Direction: N-S
Address range: 4078 to 12199
Lafayette Blvd
Length: 0.28 miles
Direction: N-S
Address range: 4050 to 4299
Direction: N-S
Address range: 4050 to 4299
Abbott Ave
Length: 0.26 miles
Direction: N-S
Address range: 4062 to 4249
Direction: N-S
Address range: 4062 to 4249
Duplex Ave
Length: 0.24 miles
Direction: N-S
Address range: 4068 to 4249
Direction: N-S
Address range: 4068 to 4249
High St
Length: 0.24 miles
Direction: N-S
Address range: 4078 to 4249
Direction: N-S
Address range: 4078 to 4249
Brouseville Ave
Length: 0.23 miles
Direction: N-S
Address range: 4089 to 4249
Direction: N-S
Address range: 4089 to 4249
Hubbard Ave
Length: 0.19 miles
Direction: N-S
Address range: 4100 to 4249
Direction: N-S
Address range: 4100 to 4249
Drouillard St
Length: 0.15 miles
Direction: N-S
Address range: 4150 to 4249
Direction: N-S
Address range: 4150 to 4249
James Ave
Length: 0.12 miles
Direction: N-S
Address range: 12000 to 12199
Direction: N-S
Address range: 12000 to 12199
Barberry Ave (Barberry St)
Length: 0.12 miles
Direction: N-S
Address range: 12000 to 12199
Direction: N-S
Address range: 12000 to 12199
Cloverlawn Blvd
Length: 0.03 miles
Direction: E-W
Direction: E-W
Other features:
Ecorse River S Br
Length: 0.21 miles
Directions: E-W, SE-NW
Directions: E-W, SE-NW