Home Gardens neighborhood in Royal Oak, Michigan (MI), 48067 detailed profile
Settings
X


Business Search - 14 Million verified businesses
Area: 0.100 square miles
Population: 1,092
Population density:
| Home Gardens: | 10,939 people per square mile |
| Royal Oak: | 4,913 people per square mile |

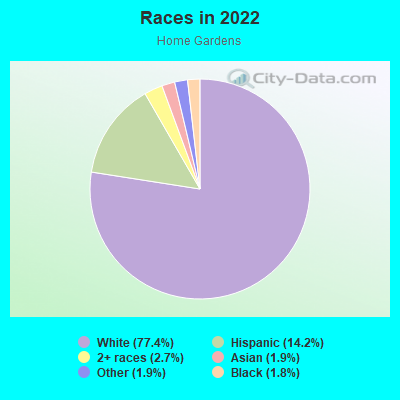
- 84877.4%White
- 15514.2%Hispanic or Latino
- 302.7%Two or more races
- 211.9%Asian
- 211.9%Some other race
- 201.8%Black
Median household income in 2022:
| Home Gardens: | $93,501 |
| Royal Oak: | $92,799 |
Distribution of median household income
![Distribution of median household income]()
- 10Less than $10,000
- 25$10,000 to $19,999
- 37$20,000 to $29,999
- 18$30,000 to $39,999
- 21$40,000 to $49,999
- 18$50,000 to $59,999
- 48$60,000 to $74,999
- 86$75,000 to $99,999
- 67$100,000 to $124,999
- 49$125,000 to $149,999
- 102$150,000 to $199,999
- 74$200,000 or more

Distribution of owner-occupied house/condo value
![Distribution of owner-occupied house/condo value]()
- 40Less than $50,000
- 45$100,000 to $149,999
- 41$150,000 to $199,999
- 112$200,000 to $249,999
- 115$250,000 to $299,999
- 93$300,000 to $399,999
- 10$400,000 to $499,999
- 31$500,000 to $749,999
- 8$750,000 to $999,999
- 13$1,000,000 or more

Distribution of rent paid by renters
![Distribution of rent paid by renters]()
- 11$100 to $199
- 29$200 to $299
- 12$400 to $499
- 97$500 to $599
- 20$700 to $799
- 18$800 to $899
- 13$900 to $999
- 14$1,000 to $1,249
- 24$1,250 to $1,499
- 48$1,500 to $1,999
- 21$2,000 or more

Median rent in 2022:
| Home Gardens: | $1,479 |
| Royal Oak: | $1,161 |
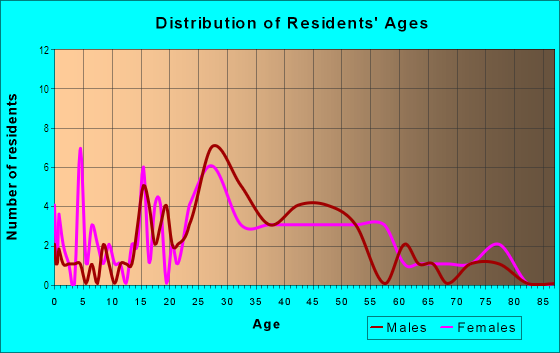
| Males: | 499 |
| Females: | 593 |
Males:
| This neighborhood: | 36.4 years |
| Whole city: | 35.3 years |
| This neighborhood: | 36.8 years |
| Whole city: | 36.8 years |
Average household size:
| Home Gardens: | 12.4 people |
| Royal Oak: | 2.0 people |
Percentage of family households:
| Home Gardens: | 36.9% |
| Royal Oak: | 33.6% |
| Here: | 30.6% |
| Royal Oak: | 34.6% |
Percentage of married-couple families with children (among all households):
| Home Gardens: | 38.7% |
| Royal Oak: | 38.7% |
Percentage of single-mother households (among all households):
| Home Gardens: | 8.4% |
| Royal Oak: | 9.4% |
Percentage of never married males 15 years old and over:
Percentage of never married females 15 years old and over:
| Home Gardens: | 27.1% |
| Royal Oak: | 25.0% |
Percentage of never married females 15 years old and over:
| Home Gardens: | 24.0% |
| city: | 18.3% |
Percentage of people that speak English not well or not at all:
| Home Gardens: | 0.8% |
| Royal Oak: | 0.6% |
Percentage of people born in this state:
Percentage of people born in another U.S. state:
Percentage of native residents but born outside the U.S.:
Percentage of foreign born residents:
| Here: | 73.7% |
| Royal Oak: | 75.9% |
Percentage of people born in another U.S. state:
| Home Gardens: | 19.6% |
| Royal Oak: | 16.2% |
Percentage of native residents but born outside the U.S.:
| Here: | 1.2% |
| city: | 1.3% |
Percentage of foreign born residents:
| Here: | 5.5% |
| Royal Oak: | 6.7% |
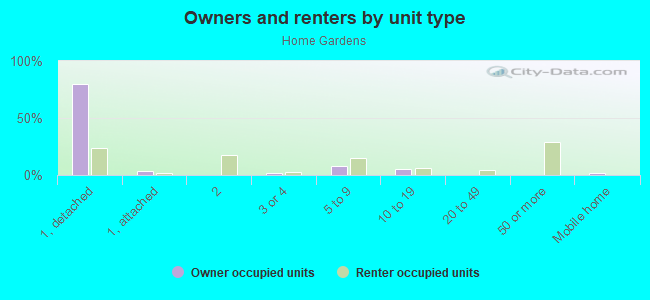
Owner-occupied
Renter-occupied

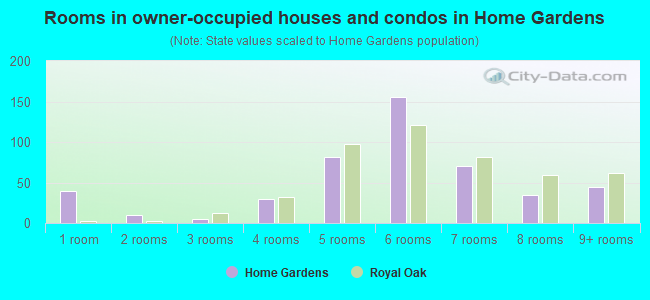
- Rooms in owner-occupied houses and condos in Home Gardens
- 391 room
- 102 rooms
- 53 rooms
- 304 rooms
- 815 rooms
- 1556 rooms
- 707 rooms
- 348 rooms
- 459+ rooms
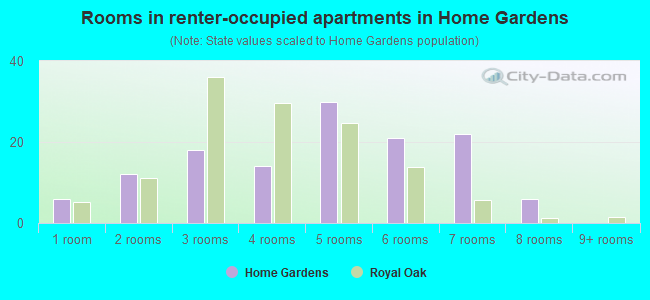
- Rooms in renter-occupied apartments in Home Gardens
- 61 room
- 122 rooms
- 183 rooms
- 144 rooms
- 305 rooms
- 216 rooms
- 227 rooms
- 68 rooms
- 09+ rooms
Owner-occupied
Renter-occupied
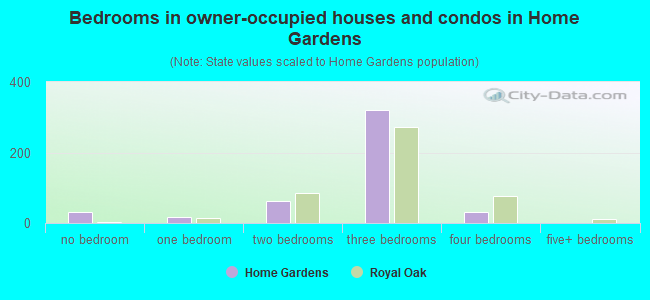
- Bedrooms in owner-occupied houses and condos in Home Gardens
- 30no bedroom
- 171 bedroom
- 612 bedrooms
- 3213 bedrooms
- 304 bedrooms
- 15+ bedrooms
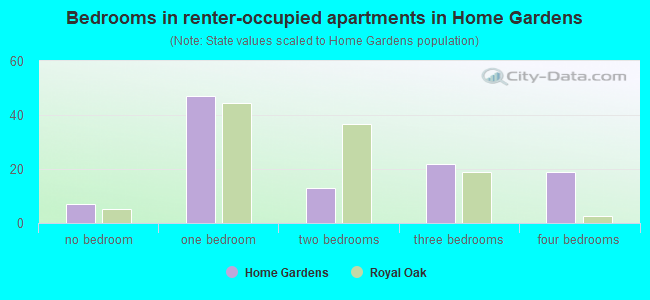
- Bedrooms in renter-occupied apartments in Home Gardens
- 7no bedroom
- 471 bedroom
- 132 bedrooms
- 223 bedrooms
- 194 bedrooms
- 05+ bedrooms
Average number of cars or other vehicles available in houses/condos:
Average number of cars or other vehicles available in apartments:
| This neighborhood: | 1.7 |
| Royal Oak: | 1.8 |
Average number of cars or other vehicles available in apartments:
| Here: | 1.5 |
| city: | 1.3 |
Percentage of units with a mortgage:
| Home Gardens: | 77.8% |
| Royal Oak: | 68.2% |
Average estimated value of detached houses in 2022 (87.4% of all units):
| Home Gardens: | $318,104 |
| Michigan: | $280,038 |
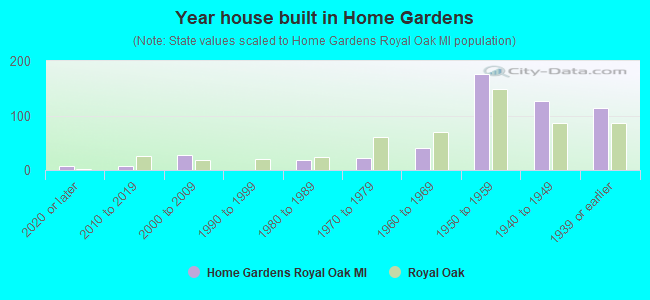
- Year house built in Home Gardens
- 72020 or later
- 72010 to 2019
- 282000 to 2009
- 01990 to 1999
- 191980 to 1989
- 221970 to 1979
- 401960 to 1969
- 1771950 to 1959
- 1261940 to 1949
- 1131939 or earlier
City-data.com crime index for city in 2020 (higher means more crime):
| City: | 57.4 |
| U.S. average: | 219.5 |
Travel time to work (commute)
![Travel time to work (commute)]()
- 6Less than 5 minutes
- 135 to 9 minutes
- 2910 to 14 minutes
- 6115 to 19 minutes
- 4720 to 24 minutes
- 2725 to 29 minutes
- 6230 to 34 minutes
- 1035 to 39 minutes
- 340 to 44 minutes
- 4845 to 59 minutes
- 660 to 89 minutes
- 1090 or more minutes

Means of transportation to work
![Means of transportation to work]()
- 65.5%480Drove a car alone
- 8.5%62Carpooled
- 1.0%7Long-distance train or commuter rail
- 0.8%6Bicycle
- 1.0%7Walked
- 1.0%7Other means
- 25.0%183Worked at home

Time leaving home to go to work
![Time leaving home to go to work]()
- 112:00 a.m. to 4:59 a.m.
- 85:00 a.m. to 5:29 a.m.
- 45:30 a.m. to 5:59 a.m.
- 46:00 a.m. to 6:29 a.m.
- 226:30 a.m. to 6:59 a.m.
- 567:00 a.m. to 7:29 a.m.
- 597:30 a.m. to 7:59 a.m.
- 408:00 a.m. to 8:29 a.m.
- 138:30 a.m. to 8:59 a.m.
- 409:00 a.m. to 9:59 a.m.
- 810:00 a.m. to 10:59 a.m.
- 211:00 a.m. to 11:59 a.m.
- 1812:00 p.m. to 3:59 p.m.
- 194:00 p.m. to 11:59 p.m.

Occupations of males:
- Percentage of males in management occupations (except farmers):
Here: 7.2% city: 14.0%
- Percentage of males in business and financial operations occupations:
Here: 21.8% city: 10.4%
- Percentage of males in computer and mathematical occupations:
Here: 7.8% city: 7.5%
- Percentage of males in architecture and engineering occupations:
Here: 16.7% city: 13.5%
- Percentage of males in legal occupations:
Here: 1.5% city: 2.6%
- Percentage of males in education, training, and library occupations:
Here: 5.1% city: 2.9%
- Percentage of males in healthcare practitioners and technical occupations:
Here: 5.5% city: 3.6%
- Percentage of males in service occupations:
Here: 3.6% city: 10.1%
- Percentage of males in sales and office occupations:
Here: 15.0% city: 13.9%
- Percentage of males in construction, extraction, and maintenance occupations:
Here: 2.1% city: 3.0%
- Percentage of males in production occupations:
Here: 6.3% city: 4.5%
- Percentage of males in material moving occupations:
Here: 1.3% city: 2.5%
Occupations of females:
- Percentage of females in management occupations (except farmers):
Here: 5.2% city: 13.6%
- Percentage of females in business and financial operations occupations:
Here: 26.3% city: 13.0%
- Percentage of females in architecture and engineering occupations:
Here: 2.1% city: 4.1%
- Percentage of females in life, physical, and social science occupations:
Here: 1.9% city: 1.6%
- Percentage of females in education, training, and library occupations:
Here: 7.9% city: 8.7%
- Percentage of females in arts, design, entertainment, sports, and media occupations:
Here: 3.5% city: 3.5%
- Percentage of females in healthcare practitioners and technical occupations:
Here: 5.9% city: 13.5%
- Percentage of females in service occupations:
Here: 12.1% city: 12.8%
- Percentage of females in sales and office occupations:
Here: 33.0% city: 18.1%
Percentage of people 16-64 in Armed Forces:
| Home Gardens: | 0.4% |
| Royal Oak: | 0.1% |
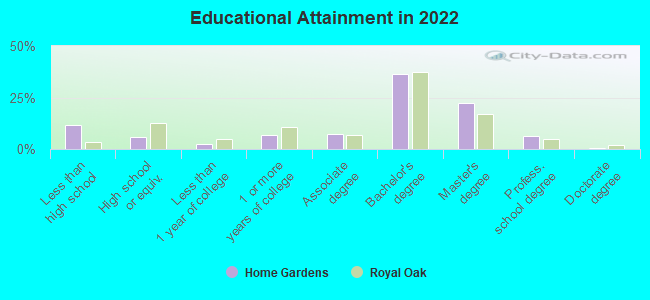
Education in this neighborhood (subdivision or community):
- Percentage of people 3 years and older in K-12 schools:
Home Gardens: 14.7% Royal Oak: 9.0%
- Percentage of people 3 years and older in undergraduate colleges:
Home Gardens: 5.4% Royal Oak: 3.7%
- Percentage of people 3 years and older in grad. or professional schools:
Home Gardens: 3.0% Royal Oak: 3.5%
- Percentage of students K-12 enrolled in private schools:
Home Gardens: 41.6% Royal Oak: 24.6%
Percentage of population below poverty level:
| Home Gardens: | 4.4% |
| Royal Oak: | 6.5% |
Median year owner moved in (as recorded in 2022):
Median year renter moved in (as recorded in 2022):
| Home Gardens: | 2011 |
| Royal Oak: | 2010 |
Median year renter moved in (as recorded in 2022):
| Home Gardens: | 2018 |
| Royal Oak: | 2018 |
Percentage of married-couple families with both working:
| Home Gardens: | 77.8% |
| Royal Oak: | 77.7% |
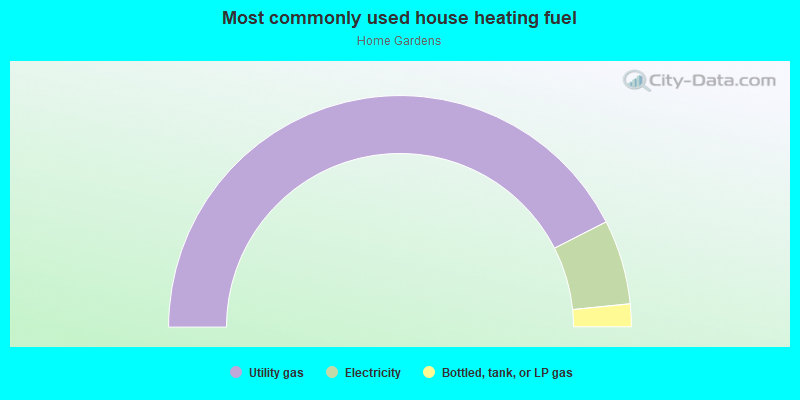
- 85.1%Utility gas
- 11.8%Electricity
- 3.2%Bottled, tank, or LP gas
Limited-access highways (interstate or state) in this neighborhood:
I- 75
Length: 0.28 miles
Direction: N-S
Direction: N-S
Roads and streets:
E 11 Mile Rd
Length: 0.52 miles
Direction: E-W
Address range: 1800 to 2499
Direction: E-W
Address range: 1800 to 2499
E 4th St
Length: 0.51 miles
Direction: E-W
Address range: 1801 to 2499
Direction: E-W
Address range: 1801 to 2499
S Stephenson Hwy
Length: 0.21 miles
Direction: N-S
Address range: 100 to 323
Direction: N-S
Address range: 100 to 323
S Kenwood Ave
Length: 0.20 miles
Direction: N-S
Address range: 100 to 299
Direction: N-S
Address range: 100 to 299
S Minerva Ave
Length: 0.20 miles
Direction: N-S
Address range: 100 to 353
Direction: N-S
Address range: 100 to 353
S Edgeworth Ave
Length: 0.20 miles
Direction: N-S
Address range: 100 to 299
Direction: N-S
Address range: 100 to 299
S Edison Ave
Length: 0.20 miles
Direction: N-S
Address range: 100 to 299
Direction: N-S
Address range: 100 to 299
S Dorchester Ave
Length: 0.20 miles
Direction: N-S
Address range: 100 to 299
Direction: N-S
Address range: 100 to 299
Helene Ave
Length: 0.20 miles
Direction: N-S
Address range: 100 to 349
Direction: N-S
Address range: 100 to 349
Middlesex Ave
Length: 0.11 miles
Direction: E-W
Address range: 2300 to 2399
Direction: E-W
Address range: 2300 to 2399
Dorchester Ct
Length: 0.07 miles
Direction: E-W
Address range: 1900 to 1999
Direction: E-W
Address range: 1900 to 1999