Howell neighborhood in Evansville, Indiana (IN), 47712 detailed profile
Settings
X


Business Search - 14 Million verified businesses
Area: 0.234 square miles
Population: 447
Population density:
| Howell: | 1,913 people per square mile |
| Evansville: | 2,912 people per square mile |

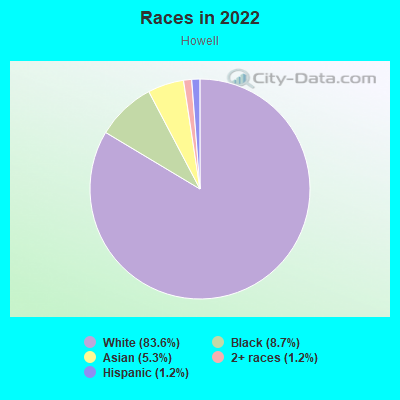
- 41383.6%White
- 438.7%Black
- 265.3%Asian
- 61.2%Two or more races
- 61.2%Hispanic or Latino
Median household income in 2022:
| Howell: | $48,957 |
| Evansville: | $48,127 |
Distribution of median household income
![Distribution of median household income]()
- 7Less than $10,000
- 19$10,000 to $19,999
- 20$20,000 to $29,999
- 45$30,000 to $39,999
- 13$40,000 to $49,999
- 19$50,000 to $59,999
- 36$60,000 to $74,999
- 12$75,000 to $99,999
- 19$100,000 to $124,999
- 3$125,000 to $149,999
- 25$150,000 to $199,999
- 9$200,000 or more

Distribution of owner-occupied house/condo value
![Distribution of owner-occupied house/condo value]()
- 23Less than $50,000
- 59$50,000 to $99,999
- 61$100,000 to $149,999
- 10$150,000 to $199,999
- 12$200,000 to $249,999
- 2$250,000 to $299,999
- 2$400,000 to $499,999
- 9$500,000 to $749,999
- 2$1,000,000 or more

Distribution of rent paid by renters
![Distribution of rent paid by renters]()
- 3$100 to $199
- 3$200 to $299
- 15$400 to $499
- 31$500 to $599
- 10$600 to $699
- 4$700 to $799
- 11$800 to $899
- 10$900 to $999
- 9$1,000 to $1,249
- 4$1,250 to $1,499
- 25$1,500 to $1,999

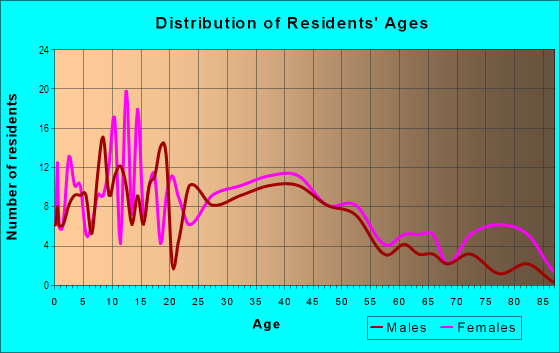
| Males: | 242 |
| Females: | 205 |
Males:
| This neighborhood: | 34.1 years |
| Whole city: | 36.6 years |
| This neighborhood: | 33.7 years |
| Whole city: | 38.9 years |
Average household size:
| Howell: | 2.1 people |
| Evansville: | 2.1 people |
Percentage of family households:
| Howell: | 47.5% |
| Evansville: | 38.3% |
| Here: | 37.0% |
| Evansville: | 33.7% |
Percentage of married-couple families with children (among all households):
| Howell: | 23.9% |
| Evansville: | 25.3% |
Percentage of single-mother households (among all households):
| Howell: | 6.5% |
| Evansville: | 15.6% |
Percentage of never married males 15 years old and over:
Percentage of never married females 15 years old and over:
| Howell: | 20.6% |
| Evansville: | 19.5% |
Percentage of never married females 15 years old and over:
| Howell: | 12.8% |
| city: | 17.0% |
Percentage of people that speak English not well or not at all:
| Howell: | 0.0% |
| Evansville: | 0.7% |
Percentage of people born in this state:
Percentage of people born in another U.S. state:
Percentage of native residents but born outside the U.S.:
Percentage of foreign born residents:
| Here: | 79.4% |
| Evansville: | 70.5% |
Percentage of people born in another U.S. state:
| Howell: | 19.5% |
| Evansville: | 25.5% |
Percentage of native residents but born outside the U.S.:
| Here: | 0.4% |
| city: | 0.8% |
Percentage of foreign born residents:
| Here: | 0.6% |
| Evansville: | 3.2% |
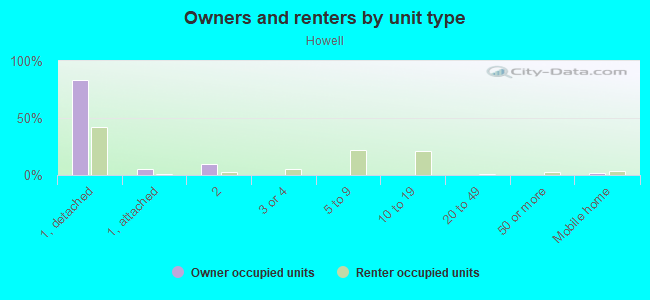
Owner-occupied
Renter-occupied

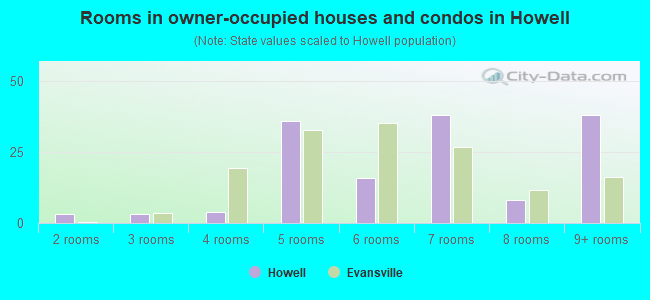
- Rooms in owner-occupied houses and condos in Howell
- 01 room
- 32 rooms
- 33 rooms
- 44 rooms
- 365 rooms
- 166 rooms
- 387 rooms
- 88 rooms
- 389+ rooms
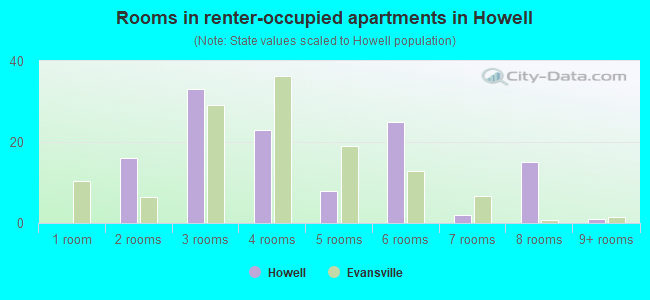
- Rooms in renter-occupied apartments in Howell
- 01 room
- 162 rooms
- 333 rooms
- 234 rooms
- 85 rooms
- 256 rooms
- 27 rooms
- 158 rooms
- 19+ rooms
Owner-occupied
Renter-occupied
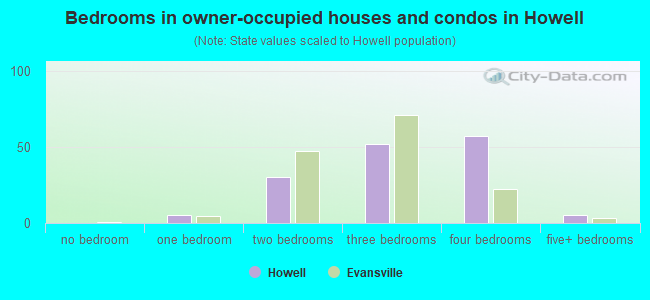
- Bedrooms in owner-occupied houses and condos in Howell
- 0no bedroom
- 51 bedroom
- 302 bedrooms
- 523 bedrooms
- 574 bedrooms
- 55+ bedrooms
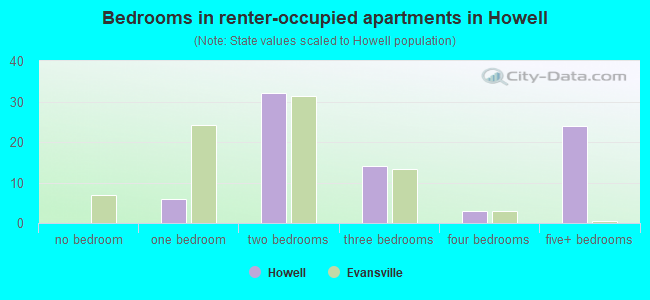
- Bedrooms in renter-occupied apartments in Howell
- 0no bedroom
- 61 bedroom
- 322 bedrooms
- 143 bedrooms
- 34 bedrooms
- 245+ bedrooms
Average number of cars or other vehicles available in houses/condos:
Average number of cars or other vehicles available in apartments:
| This neighborhood: | 1.8 |
| Evansville: | 1.8 |
Average number of cars or other vehicles available in apartments:
| Here: | 1.5 |
| city: | 1.1 |
Percentage of units with a mortgage:
| Howell: | 74.9% |
| Evansville: | 58.5% |
Average estimated value of detached houses in 2022 (91.5% of all units):
| Howell: | $121,044 |
| Indiana: | $257,916 |
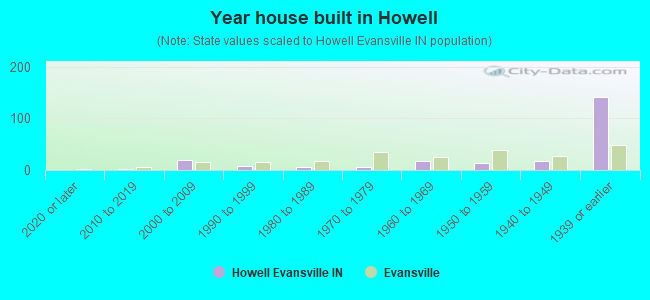
- Year house built in Howell
- 02020 or later
- 22010 to 2019
- 202000 to 2009
- 81990 to 1999
- 61980 to 1989
- 61970 to 1979
- 171960 to 1969
- 141950 to 1959
- 181940 to 1949
- 1411939 or earlier
City-data.com crime index for city in 2020 (higher means more crime):
| City: | 440.8 |
| U.S. average: | 219.5 |
Travel time to work (commute)
![Travel time to work (commute)]()
- 5Less than 5 minutes
- 235 to 9 minutes
- 5110 to 14 minutes
- 1815 to 19 minutes
- 2320 to 24 minutes
- 625 to 29 minutes
- 1230 to 34 minutes
- 240 to 44 minutes
- 2445 to 59 minutes
- 460 to 89 minutes
- 290 or more minutes

Means of transportation to work
![Means of transportation to work]()
- 95.8%137Drove a car alone
- 9.1%13Carpooled
- 2.8%4Bus
- 2.1%3Walked
- 1.4%2Other means

Time leaving home to go to work
![Time leaving home to go to work]()
- 612:00 a.m. to 4:59 a.m.
- 195:00 a.m. to 5:29 a.m.
- 85:30 a.m. to 5:59 a.m.
- 246:00 a.m. to 6:29 a.m.
- 76:30 a.m. to 6:59 a.m.
- 147:00 a.m. to 7:29 a.m.
- 167:30 a.m. to 7:59 a.m.
- 178:00 a.m. to 8:29 a.m.
- 78:30 a.m. to 8:59 a.m.
- 49:00 a.m. to 9:59 a.m.
- 710:00 a.m. to 10:59 a.m.
- 211:00 a.m. to 11:59 a.m.
- 1412:00 p.m. to 3:59 p.m.
- 84:00 p.m. to 11:59 p.m.

Occupations of males:
- Percentage of males in management occupations (except farmers):
Here: 16.8% city: 8.4%
- Percentage of males in computer and mathematical occupations:
Here: 5.6% city: 3.0%
- Percentage of males in architecture and engineering occupations:
Here: 7.2% city: 3.0%
- Percentage of males in education, training, and library occupations:
Here: 2.7% city: 2.7%
- Percentage of males in arts, design, entertainment, sports, and media occupations:
Here: 2.2% city: 1.4%
- Percentage of males in service occupations:
Here: 3.1% city: 15.9%
- Percentage of males in sales and office occupations:
Here: 2.7% city: 14.7%
- Percentage of males in construction, extraction, and maintenance occupations:
Here: 13.3% city: 7.3%
- Percentage of males in production occupations:
Here: 24.3% city: 14.9%
- Percentage of males in transportation occupations:
Here: 16.0% city: 7.3%
Occupations of females:
- Percentage of females in management occupations (except farmers):
Here: 9.3% city: 6.4%
- Percentage of females in business and financial operations occupations:
Here: 3.9% city: 4.6%
- Percentage of females in computer and mathematical occupations:
Here: 1.4% city: 1.4%
- Percentage of females in community and social services occupations:
Here: 8.4% city: 2.7%
- Percentage of females in education, training, and library occupations:
Here: 10.0% city: 5.7%
- Percentage of females in service occupations:
Here: 33.4% city: 26.1%
- Percentage of females in sales and office occupations:
Here: 24.0% city: 30.9%
- Percentage of females in construction, extraction, and maintenance occupations:
Here: 3.9% city: 0.3%
- Percentage of females in production occupations:
Here: 4.6% city: 5.3%
- Percentage of females in transportation occupations:
Here: 4.5% city: 1.3%
- Percentage of females in material moving occupations:
Here: 1.9% city: 3.1%
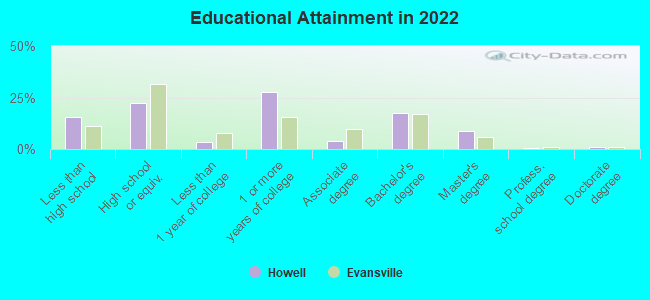
Education in this neighborhood (subdivision or community):
- Percentage of people 3 years and older in K-12 schools:
Howell: 35.0% Evansville: 15.5%
- Percentage of people 3 years and older in undergraduate colleges:
Howell: 1.7% Evansville: 5.1%
- Percentage of people 3 years and older in grad. or professional schools:
Howell: 0.7% Evansville: 0.8%
- Percentage of students K-12 enrolled in private schools:
Howell: 6.9% Evansville: 15.2%
Percentage of population below poverty level:
| Howell: | 17.0% |
| Evansville: | 19.3% |
Median year owner moved in (as recorded in 2022):
Median year renter moved in (as recorded in 2022):
| Howell: | 2007 |
| Evansville: | 2011 |
Median year renter moved in (as recorded in 2022):
| Howell: | 2018 |
| Evansville: | 2020 |
Percentage of married-couple families with both working:
| Howell: | 77.3% |
| Evansville: | 71.5% |
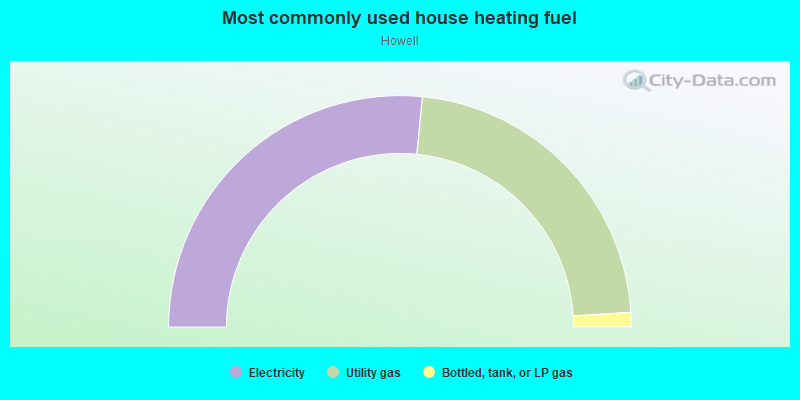
- 53.1%Electricity
- 44.9%Utility gas
- 2.0%Bottled, tank, or LP gas
Roads and streets:
Emerson St
Length: 0.62 miles
Direction: E-W
Address range: 2900 to 3499
Direction: E-W
Address range: 2900 to 3499
Delmar Ave
Length: 0.46 miles
Directions: N-S, SE-NW
Address range: 1200 to 1755
Directions: N-S, SE-NW
Address range: 1200 to 1755
Fremont Ave
Length: 0.46 miles
Direction: E-W
Address range: 3100 to 3499
Direction: E-W
Address range: 3100 to 3499
Broadway Ave
Length: 0.39 miles
Directions: E-W, SW-NE
Address range: 2975 to 3499
Directions: E-W, SW-NE
Address range: 2975 to 3499
Cumberland Ave
Length: 0.39 miles
Directions: N-S, SE-NW
Address range: 1100 to 1663
Directions: N-S, SE-NW
Address range: 1100 to 1663
Glendale Ave
Length: 0.37 miles
Directions: N-S, SE-NW
Address range: 1500 to 1999
Directions: N-S, SE-NW
Address range: 1500 to 1999
Stinson Ave
Length: 0.36 miles
Directions: E-W, N-S, SW-NE
Address range: 1400 to 1899
Directions: E-W, N-S, SW-NE
Address range: 1400 to 1899
Hollywood Ave
Length: 0.35 miles
Direction: N-S
Address range: 1500 to 1999
Direction: N-S
Address range: 1500 to 1999
Koressel Rd
Length: 0.34 miles
Directions: E-W, SW-NE
Address range: 3200 to 3499
Directions: E-W, SW-NE
Address range: 3200 to 3499
Dearborn St
Length: 0.34 miles
Direction: E-W
Address range: 2900 to 3199
Direction: E-W
Address range: 2900 to 3199
Ewing Ave
Length: 0.25 miles
Direction: N-S
Address range: 1400 to 1771
Direction: N-S
Address range: 1400 to 1771
Irvington Ave
Length: 0.24 miles
Direction: N-S
Address range: 1500 to 1799
Direction: N-S
Address range: 1500 to 1799
James Ave
Length: 0.24 miles
Directions: E-W, N-S, SE-NW
Address range: 3200 to 3499
Directions: E-W, N-S, SE-NW
Address range: 3200 to 3499
Arlington Ave
Length: 0.22 miles
Direction: SW-NE
Address range: 2900 to 3198
Direction: SW-NE
Address range: 2900 to 3198
Cambridge St
Length: 0.17 miles
Direction: E-W
Address range: 2900 to 3099
Direction: E-W
Address range: 2900 to 3099
S Barker Ave
Length: 0.17 miles
Directions: E-W, N-S, SW-NE
Address range: 1400 to 1599
Directions: E-W, N-S, SW-NE
Address range: 1400 to 1599
S Tekoppel Ave
Length: 0.14 miles
Directions: E-W, N-S
Address range: 1500 to 1799
Directions: E-W, N-S
Address range: 1500 to 1799
Drier Blvd
Length: 0.14 miles
Direction: N-S
Address range: 3900 to 3999
Direction: N-S
Address range: 3900 to 3999
Tieman Ave
Length: 0.09 miles
Directions: E-W, N-S, SE-NW, SW-NE
Address range: 3100 to 3124
Directions: E-W, N-S, SE-NW, SW-NE
Address range: 3100 to 3124
Railroad features:
Louisville and Nashville RR
Length: 0.48 miles
Direction: SW-NE
Direction: SW-NE