Hunters Point Estates neighborhood in Missouri City, Texas (TX), 77489 detailed profile
Settings
X


Business Search - 14 Million verified businesses
Area: 0.076 square miles
Population: 148
Population density:
| Hunters Point Estates: | 1,955 people per square mile |
| Missouri City: | 2,519 people per square mile |

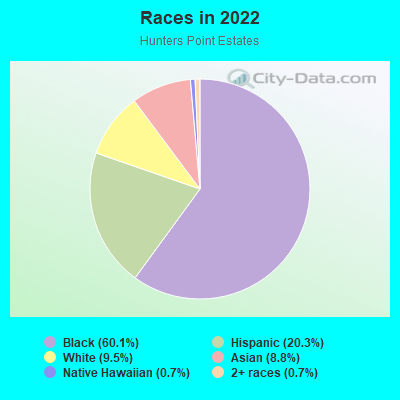
- 8960.1%Black
- 3020.3%Hispanic or Latino
- 149.5%White
- 138.8%Asian
- 10.7%Native Hawaiian and Other
Pacific Islander - 10.7%Two or more races
Median household income in 2022:
| Hunters Point Estates: | $93,669 |
| Missouri City: | $101,775 |
Distribution of median household income
![Distribution of median household income]()
- 1Less than $10,000
- 2$10,000 to $19,999
- 9$20,000 to $29,999
- 3$30,000 to $39,999
- 7$40,000 to $49,999
- 7$50,000 to $59,999
- 9$60,000 to $74,999
- 9$75,000 to $99,999
- 6$100,000 to $124,999
- 4$125,000 to $149,999
- 18$150,000 to $199,999
- 2$200,000 or more

Distribution of owner-occupied house/condo value
![Distribution of owner-occupied house/condo value]()
- 6Less than $50,000
- 6$100,000 to $149,999
- 7$150,000 to $199,999
- 16$200,000 to $249,999
- 16$250,000 to $299,999
- 2$300,000 to $399,999
- 5$400,000 to $499,999

Distribution of rent paid by renters
![Distribution of rent paid by renters]()
- 1$500 to $599
- 4$800 to $899
- 5$900 to $999
- 3$1,000 to $1,249
- 2$1,250 to $1,499
- 4$1,500 to $1,999

Median rent in 2022:
| Hunters Point Estates: | $948 |
| Missouri City: | $1,416 |
| Males: | 68 |
| Females: | 79 |
Males:
| This neighborhood: | 38.6 years |
| Whole city: | 38.5 years |
| This neighborhood: | 34.8 years |
| Whole city: | 40.1 years |
Average household size:
| Hunters Point Estates: | 2.5 people |
| Missouri City: | 2.5 people |
Percentage of family households:
| Hunters Point Estates: | 72.2% |
| Missouri City: | 48.0% |
| Here: | 62.6% |
| Missouri City: | 50.5% |
Percentage of married-couple families with children (among all households):
| Hunters Point Estates: | 28.4% |
| Missouri City: | 29.5% |
Percentage of single-mother households (among all households):
| Hunters Point Estates: | 9.1% |
| Missouri City: | 8.3% |
Percentage of never married males 15 years old and over:
Percentage of never married females 15 years old and over:
| Hunters Point Estates: | 15.4% |
| Missouri City: | 21.3% |
Percentage of never married females 15 years old and over:
| Hunters Point Estates: | 15.7% |
| city: | 14.3% |
Percentage of people that speak English not well or not at all:
| Hunters Point Estates: | 3.6% |
| Missouri City: | 3.3% |
Percentage of people born in this state:
Percentage of people born in another U.S. state:
Percentage of native residents but born outside the U.S.:
Percentage of foreign born residents:
| Here: | 66.4% |
| Missouri City: | 56.9% |
Percentage of people born in another U.S. state:
| Hunters Point Estates: | 22.4% |
| Missouri City: | 23.7% |
Percentage of native residents but born outside the U.S.:
| Here: | 0.1% |
| city: | 1.2% |
Percentage of foreign born residents:
| Here: | 11.1% |
| Missouri City: | 18.2% |
Owner-occupied
Renter-occupied

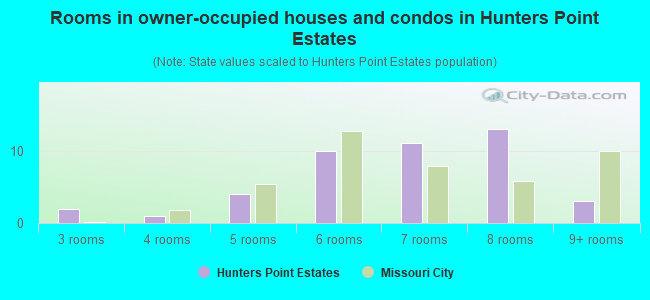
- Rooms in owner-occupied houses and condos in Hunters Point Estates
- 01 room
- 02 rooms
- 23 rooms
- 14 rooms
- 45 rooms
- 106 rooms
- 117 rooms
- 138 rooms
- 39+ rooms
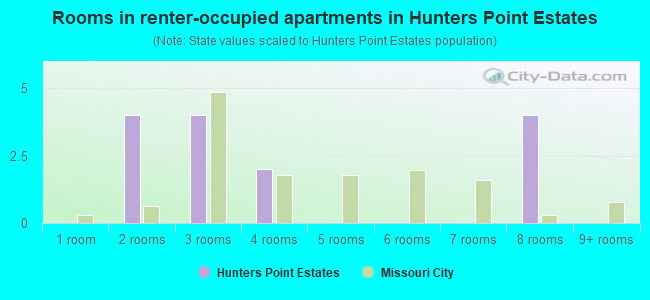
- Rooms in renter-occupied apartments in Hunters Point Estates
- 01 room
- 42 rooms
- 43 rooms
- 24 rooms
- 05 rooms
- 06 rooms
- 07 rooms
- 48 rooms
- 09+ rooms
Owner-occupied
Renter-occupied
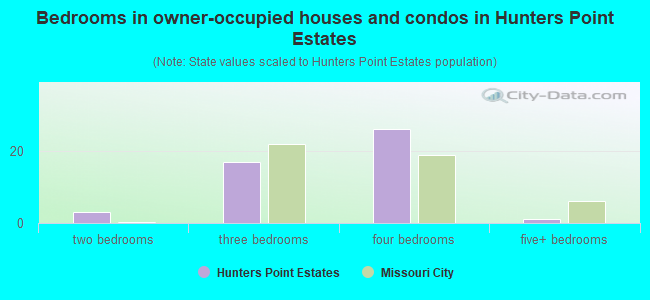
- Bedrooms in owner-occupied houses and condos in Hunters Point Estates
- 0no bedroom
- 01 bedroom
- 32 bedrooms
- 173 bedrooms
- 264 bedrooms
- 15+ bedrooms
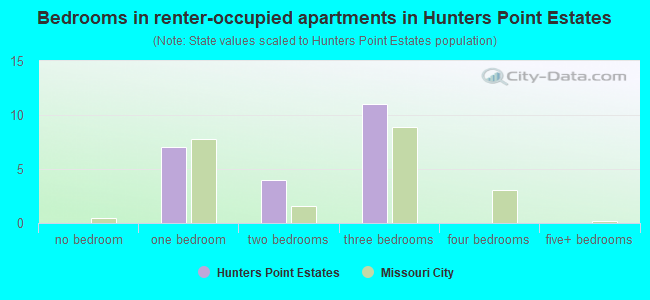
- Bedrooms in renter-occupied apartments in Hunters Point Estates
- 0no bedroom
- 71 bedroom
- 42 bedrooms
- 113 bedrooms
- 04 bedrooms
- 05+ bedrooms
Average number of cars or other vehicles available in houses/condos:
Average number of cars or other vehicles available in apartments:
| This neighborhood: | 2.9 |
| Missouri City: | 2.1 |
Average number of cars or other vehicles available in apartments:
| Here: | 0.9 |
| city: | 1.5 |
Percentage of units with a mortgage:
| Hunters Point Estates: | 67.3% |
| Missouri City: | 65.4% |
Average estimated value of detached houses in 2022 (81.4% of all units):
| Hunters Point Estates: | $253,743 |
| Missouri City: | $292,222 |
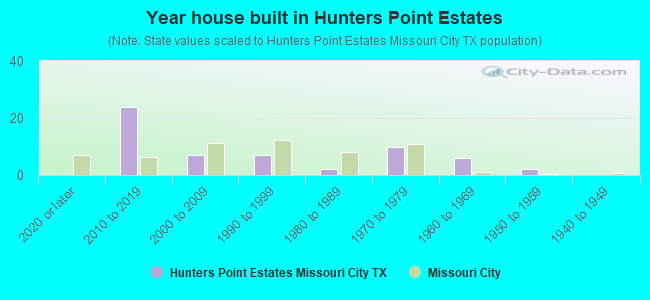
- Year house built in Hunters Point Estates
- 02020 or later
- 242010 to 2019
- 72000 to 2009
- 71990 to 1999
- 21980 to 1989
- 101970 to 1979
- 61960 to 1969
- 21950 to 1959
- 01940 to 1949
- 01939 or earlier
City-data.com crime index for city in 2020 (higher means more crime):
| City: | 98.1 |
| U.S. average: | 219.5 |
Travel time to work (commute)
![Travel time to work (commute)]()
- 135 to 9 minutes
- 1610 to 14 minutes
- 815 to 19 minutes
- 2520 to 24 minutes
- 1525 to 29 minutes
- 2830 to 34 minutes
- 635 to 39 minutes
- 1140 to 44 minutes
- 2845 to 59 minutes
- 1060 to 89 minutes
- 490 or more minutes

Means of transportation to work
![Means of transportation to work]()
- 96.1%81Drove a car alone
- 2.4%2Carpooled

Time leaving home to go to work
![Time leaving home to go to work]()
- 1712:00 a.m. to 4:59 a.m.
- 75:30 a.m. to 5:59 a.m.
- 186:00 a.m. to 6:29 a.m.
- 156:30 a.m. to 6:59 a.m.
- 357:00 a.m. to 7:29 a.m.
- 167:30 a.m. to 7:59 a.m.
- 148:00 a.m. to 8:29 a.m.
- 48:30 a.m. to 8:59 a.m.
- 129:00 a.m. to 9:59 a.m.
- 110:00 a.m. to 10:59 a.m.
- 1812:00 p.m. to 3:59 p.m.
- 114:00 p.m. to 11:59 p.m.

Occupations of males:
- Percentage of males in management occupations (except farmers):
Here: 2.7% city: 10.2%
- Percentage of males in business and financial operations occupations:
Here: 24.9% city: 6.3%
- Percentage of males in computer and mathematical occupations:
Here: 7.8% city: 7.0%
- Percentage of males in architecture and engineering occupations:
Here: 1.6% city: 6.9%
- Percentage of males in life, physical, and social science occupations:
Here: 4.0% city: 1.0%
- Percentage of males in community and social services occupations:
Here: 2.7% city: 0.7%
- Percentage of males in legal occupations:
Here: 2.0% city: 0.6%
- Percentage of males in education, training, and library occupations:
Here: 4.3% city: 3.6%
- Percentage of males in healthcare practitioners and technical occupations:
Here: 3.5% city: 3.5%
- Percentage of males in service occupations:
Here: 6.7% city: 12.2%
- Percentage of males in sales and office occupations:
Here: 9.6% city: 16.9%
- Percentage of males in construction, extraction, and maintenance occupations:
Here: 6.4% city: 4.8%
- Percentage of males in production occupations:
Here: 8.0% city: 7.4%
- Percentage of males in transportation occupations:
Here: 19.8% city: 9.5%
- Percentage of males in material moving occupations:
Here: 8.0% city: 3.0%
Occupations of females:
- Percentage of females in management occupations (except farmers):
Here: 4.5% city: 7.4%
- Percentage of females in computer and mathematical occupations:
Here: 10.1% city: 1.4%
- Percentage of females in community and social services occupations:
Here: 1.3% city: 2.3%
- Percentage of females in education, training, and library occupations:
Here: 7.8% city: 10.8%
- Percentage of females in arts, design, entertainment, sports, and media occupations:
Here: 6.0% city: 1.3%
- Percentage of females in healthcare practitioners and technical occupations:
Here: 9.9% city: 13.6%
- Percentage of females in service occupations:
Here: 16.2% city: 19.7%
- Percentage of females in sales and office occupations:
Here: 40.5% city: 27.1%
- Percentage of females in farming, fishing, and forestry occupations:
Here: 3.3% city: 0.1%
- Percentage of females in production occupations:
Here: 5.7% city: 1.5%
- Percentage of females in transportation occupations:
Here: 4.7% city: 2.3%
- Percentage of females in material moving occupations:
Here: 5.0% city: 2.0%
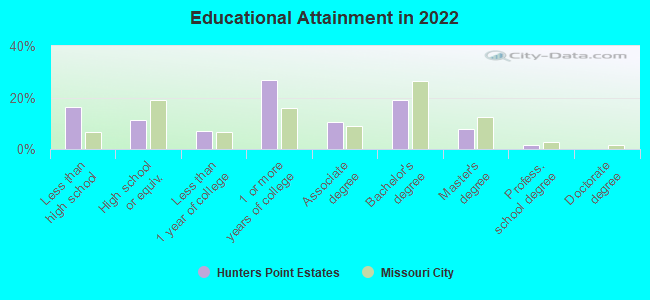
Education in this neighborhood (subdivision or community):
- Percentage of people 3 years and older in K-12 schools:
Hunters Point Estates: 13.0% Missouri City: 16.2%
- Percentage of people 3 years and older in undergraduate colleges:
Hunters Point Estates: 6.8% Missouri City: 6.5%
- Percentage of people 3 years and older in grad. or professional schools:
Hunters Point Estates: 1.4% Missouri City: 1.8%
- Percentage of students K-12 enrolled in private schools:
Hunters Point Estates: 0.0% Missouri City: 9.1%
Percentage of population below poverty level:
| Hunters Point Estates: | 3.1% |
| Missouri City: | 6.0% |
Median year owner moved in (as recorded in 2022):
Median year renter moved in (as recorded in 2022):
| Hunters Point Estates: | 2013 |
| Missouri City: | 2010 |
Median year renter moved in (as recorded in 2022):
| Hunters Point Estates: | 2019 |
| Missouri City: | 2021 |
Percentage of married-couple families with both working:
| Hunters Point Estates: | 80.5% |
| Missouri City: | 72.0% |
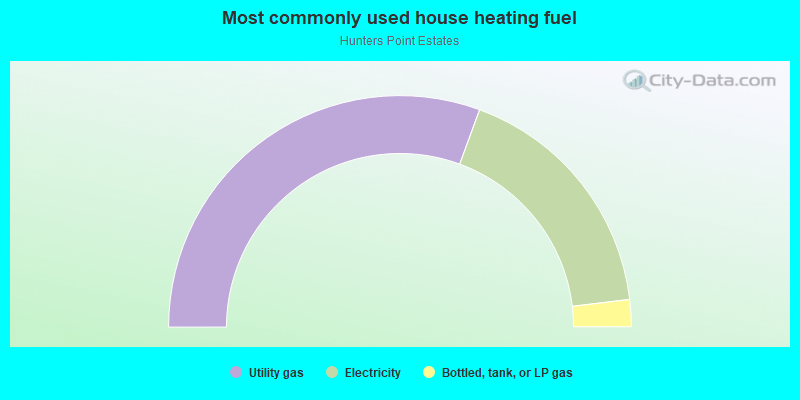
- 61.2%Utility gas
- 35.0%Electricity
- 3.8%Bottled, tank, or LP gas
Roads and streets:
Myers Mill Dr
Length: 0.26 miles
Directions: E-W, SE-NW
Address range: 1200 to 1499
Directions: E-W, SE-NW
Address range: 1200 to 1499
Cowden Ct
Length: 0.22 miles
Directions: E-W, SE-NW
Address range: 1101 to 1329
Directions: E-W, SE-NW
Address range: 1101 to 1329
Wood Orchard Dr
Length: 0.21 miles
Directions: SE-NW, SW-NE
Address range: 1800 to 1899
Directions: SE-NW, SW-NE
Address range: 1800 to 1899
Blocker Ln
Length: 0.18 miles
Directions: E-W, SE-NW
Address range: 1100 to 1299
Directions: E-W, SE-NW
Address range: 1100 to 1299
Hollowood Ln
Length: 0.18 miles
Directions: E-W, SE-NW
Address range: 1200 to 1417
Directions: E-W, SE-NW
Address range: 1200 to 1417
Halstead St
Length: 0.16 miles
Directions: E-W, N-S
Address range: 1800 to 1899
Directions: E-W, N-S
Address range: 1800 to 1899
Pine Hollow Dr
Length: 0.15 miles
Directions: N-S, SW-NE
Address range: 1816 to 1899
Directions: N-S, SW-NE
Address range: 1816 to 1899
Shadowwind Dr
Length: 0.07 miles
Direction: N-S
Address range: 1800 to 1828
Direction: N-S
Address range: 1800 to 1828
Cliffdale Dr
Length: 0.07 miles
Directions: N-S, SW-NE
Address range: 1800 to 1829
Directions: N-S, SW-NE
Address range: 1800 to 1829
Wood Orchard Ct
Length: 0.06 miles
Directions: N-S, SE-NW
Address range: 1100 to 1199
Directions: N-S, SE-NW
Address range: 1100 to 1199
Creighton Dr
Length: 0.06 miles
Direction: N-S
Address range: 1800 to 1899
Direction: N-S
Address range: 1800 to 1899
Allerton Dr
Length: 0.05 miles
Direction: N-S
Address range: 1800 to 1821
Direction: N-S
Address range: 1800 to 1821