Huntington Ridge neighborhood in Naperville, Illinois (IL), 60540 detailed profile
Settings
X


Business Search - 14 Million verified businesses
Area: 0.056 square miles
Population: 226
Population density:
| Huntington Ridge: | 4,025 people per square mile |
| Naperville: | 4,198 people per square mile |

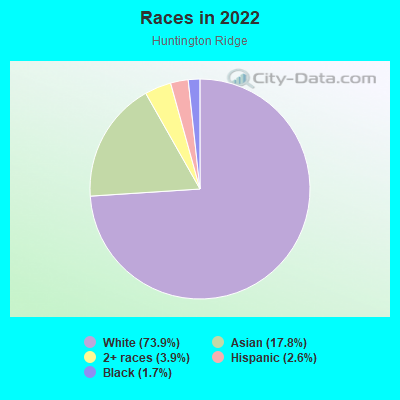
- 17073.9%White
- 4117.8%Asian
- 93.9%Two or more races
- 62.6%Hispanic or Latino
- 41.7%Black
Median household income in 2022:
| Huntington Ridge: | $171,480 |
| Naperville: | $140,831 |
Distribution of median household income
![Distribution of median household income]()
- 2Less than $10,000
- 5$20,000 to $29,999
- 5$30,000 to $39,999
- 2$40,000 to $49,999
- 1$50,000 to $59,999
- 3$60,000 to $74,999
- 8$75,000 to $99,999
- 6$100,000 to $124,999
- 6$125,000 to $149,999
- 17$150,000 to $199,999
- 30$200,000 or more

Distribution of owner-occupied house/condo value
![Distribution of owner-occupied house/condo value]()
- 2$100,000 to $149,999
- 3$150,000 to $199,999
- 2$200,000 to $249,999
- 7$250,000 to $299,999
- 3$300,000 to $399,999
- 24$400,000 to $499,999
- 21$500,000 to $749,999
- 3$750,000 to $999,999

Distribution of rent paid by renters
![Distribution of rent paid by renters]()
- 3$1,000 to $1,249
- 7$1,250 to $1,499
- 13$1,500 to $1,999
- 17$2,000 or more

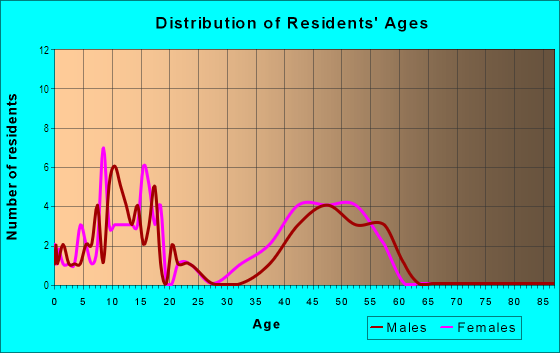
| Males: | 131 |
| Females: | 95 |
Males:
| This neighborhood: | 31.4 years |
| Whole city: | 39.6 years |
| This neighborhood: | 40.8 years |
| Whole city: | 42.4 years |
Average household size:
| Huntington Ridge: | 3.1 people |
| Naperville: | 2.7 people |
Percentage of family households:
| Huntington Ridge: | 55.7% |
| Naperville: | 57.7% |
| Here: | 54.2% |
| Naperville: | 66.6% |
Percentage of married-couple families with children (among all households):
| Huntington Ridge: | 20.7% |
| Naperville: | 31.4% |
Percentage of single-mother households (among all households):
| Huntington Ridge: | 0.5% |
| Naperville: | 4.5% |
Percentage of never married males 15 years old and over:
Percentage of never married females 15 years old and over:
| Huntington Ridge: | 11.7% |
| Naperville: | 14.0% |
Percentage of never married females 15 years old and over:
| Huntington Ridge: | 7.6% |
| city: | 12.1% |
Percentage of people that speak English not well or not at all:
| Huntington Ridge: | 1.4% |
| Naperville: | 2.5% |
Percentage of people born in this state:
Percentage of people born in another U.S. state:
Percentage of native residents but born outside the U.S.:
Percentage of foreign born residents:
| Here: | 62.5% |
| Naperville: | 53.1% |
Percentage of people born in another U.S. state:
| Huntington Ridge: | 18.0% |
| Naperville: | 23.5% |
Percentage of native residents but born outside the U.S.:
| Here: | 2.2% |
| city: | 1.4% |
Percentage of foreign born residents:
| Here: | 17.3% |
| Naperville: | 22.0% |
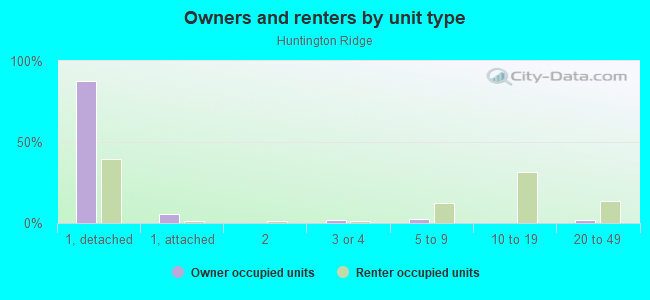
Owner-occupied
Renter-occupied

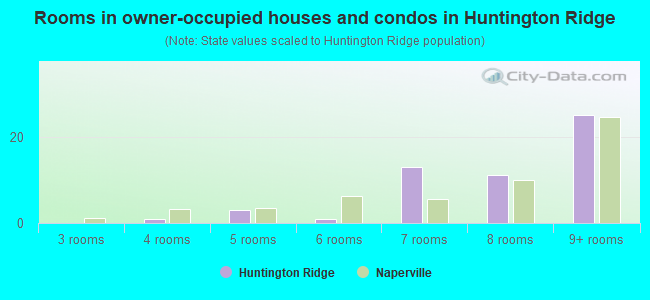
- Rooms in owner-occupied houses and condos in Huntington Ridge
- 01 room
- 02 rooms
- 03 rooms
- 14 rooms
- 35 rooms
- 16 rooms
- 137 rooms
- 118 rooms
- 259+ rooms
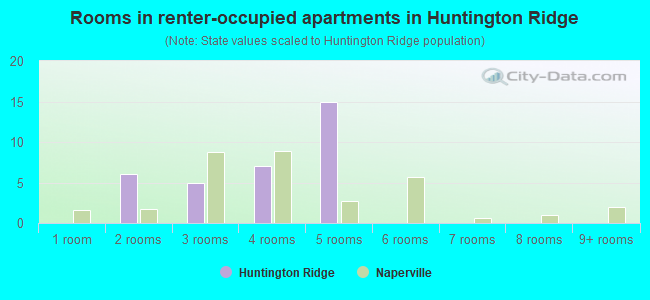
- Rooms in renter-occupied apartments in Huntington Ridge
- 01 room
- 62 rooms
- 53 rooms
- 74 rooms
- 155 rooms
- 06 rooms
- 07 rooms
- 08 rooms
- 09+ rooms
Owner-occupied
Renter-occupied
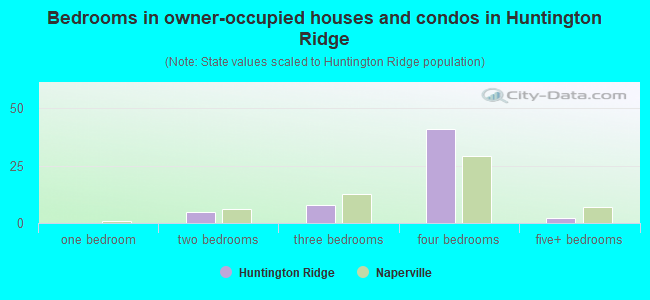
- Bedrooms in owner-occupied houses and condos in Huntington Ridge
- 0no bedroom
- 01 bedroom
- 52 bedrooms
- 83 bedrooms
- 414 bedrooms
- 25+ bedrooms
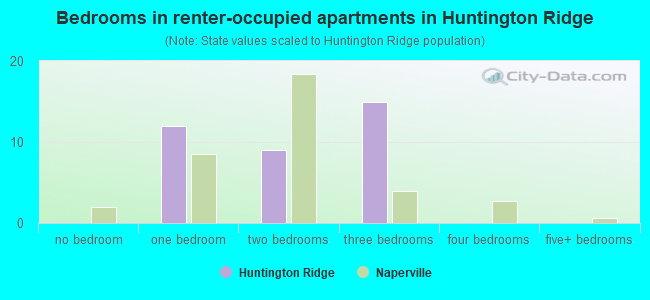
- Bedrooms in renter-occupied apartments in Huntington Ridge
- 0no bedroom
- 121 bedroom
- 92 bedrooms
- 153 bedrooms
- 04 bedrooms
- 05+ bedrooms
Average number of cars or other vehicles available in houses/condos:
Average number of cars or other vehicles available in apartments:
| This neighborhood: | 1.5 |
| Naperville: | 2.1 |
Average number of cars or other vehicles available in apartments:
| Here: | 2.8 |
| city: | 1.4 |
Percentage of units with a mortgage:
| Huntington Ridge: | 79.3% |
| Naperville: | 62.5% |
Housing prices:
- Average estimated value of detached houses in 2022 (98.7% of all units):
Huntington Ridge: $324,976 Naperville: $552,530
- Average estimated value of townhouses or other attached units in 2022 (3.9% of all units):
This neighborhood: $209,557 city: $332,929
- Average estimated '22 value of housing units in 3-to-4-unit structures (1.3% of all units):
Huntington Ridge: $293,732 city: $279,630
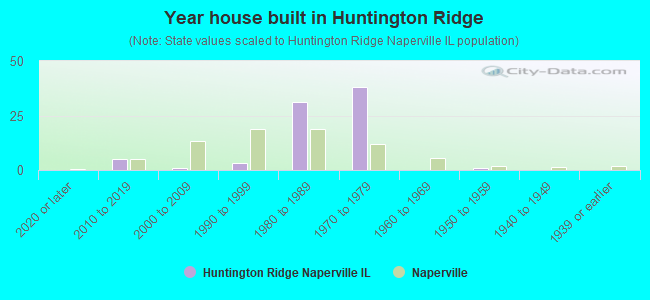
- Year house built in Huntington Ridge
- 02020 or later
- 52010 to 2019
- 12000 to 2009
- 31990 to 1999
- 311980 to 1989
- 381970 to 1979
- 01960 to 1969
- 11950 to 1959
- 01940 to 1949
- 01939 or earlier
City-data.com crime index for city in 2020 (higher means more crime):
| City: | 122.2 |
| U.S. average: | 219.5 |
Travel time to work (commute)
![Travel time to work (commute)]()
- 2Less than 5 minutes
- 55 to 9 minutes
- 1110 to 14 minutes
- 715 to 19 minutes
- 1020 to 24 minutes
- 425 to 29 minutes
- 930 to 34 minutes
- 435 to 39 minutes
- 140 to 44 minutes
- 345 to 59 minutes
- 960 to 89 minutes
- 390 or more minutes

Means of transportation to work
![Means of transportation to work]()
- 53.7%53Drove a car alone
- 1.0%1Carpooled
- 3.0%3Long-distance train or commuter rail
- 2.0%2Walked
- 36.5%36Worked at home

Time leaving home to go to work
![Time leaving home to go to work]()
- 45:00 a.m. to 5:29 a.m.
- 25:30 a.m. to 5:59 a.m.
- 96:00 a.m. to 6:29 a.m.
- 96:30 a.m. to 6:59 a.m.
- 107:00 a.m. to 7:29 a.m.
- 87:30 a.m. to 7:59 a.m.
- 128:00 a.m. to 8:29 a.m.
- 58:30 a.m. to 8:59 a.m.
- 59:00 a.m. to 9:59 a.m.
- 110:00 a.m. to 10:59 a.m.
- 312:00 p.m. to 3:59 p.m.
- 74:00 p.m. to 11:59 p.m.

Occupations of males:
- Percentage of males in management occupations (except farmers):
Here: 35.9% city: 21.9%
- Percentage of males in business and financial operations occupations:
Here: 10.6% city: 11.0%
- Percentage of males in computer and mathematical occupations:
Here: 6.4% city: 12.3%
- Percentage of males in architecture and engineering occupations:
Here: 5.8% city: 6.1%
- Percentage of males in community and social services occupations:
Here: 3.8% city: 1.1%
- Percentage of males in education, training, and library occupations:
Here: 23.6% city: 3.6%
- Percentage of males in service occupations:
Here: 10.2% city: 6.2%
- Percentage of males in sales and office occupations:
Here: 7.4% city: 16.9%
- Percentage of males in transportation occupations:
Here: 3.4% city: 3.9%
- Percentage of males in material moving occupations:
Here: 1.9% city: 1.9%
Occupations of females:
- Percentage of females in management occupations (except farmers):
Here: 24.4% city: 13.7%
- Percentage of females in business and financial operations occupations:
Here: 14.1% city: 10.1%
- Percentage of females in computer and mathematical occupations:
Here: 6.3% city: 4.5%
- Percentage of females in life, physical, and social science occupations:
Here: 1.1% city: 1.3%
- Percentage of females in community and social services occupations:
Here: 6.8% city: 2.5%
- Percentage of females in education, training, and library occupations:
Here: 20.9% city: 11.8%
- Percentage of females in arts, design, entertainment, sports, and media occupations:
Here: 6.3% city: 2.6%
- Percentage of females in healthcare practitioners and technical occupations:
Here: 6.2% city: 11.4%
- Percentage of females in service occupations:
Here: 6.5% city: 12.4%
- Percentage of females in sales and office occupations:
Here: 14.8% city: 22.7%
- Percentage of females in production occupations:
Here: 1.8% city: 1.7%
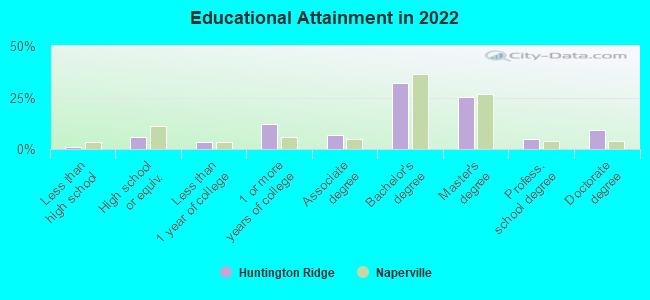
Education in this neighborhood (subdivision or community):
- Percentage of people 3 years and older in K-12 schools:
Huntington Ridge: 35.7% Naperville: 19.5%
- Percentage of people 3 years and older in undergraduate colleges:
Huntington Ridge: 8.0% Naperville: 3.6%
- Percentage of people 3 years and older in grad. or professional schools:
Huntington Ridge: 3.1% Naperville: 1.7%
- Percentage of students K-12 enrolled in private schools:
Huntington Ridge: 18.8% Naperville: 14.4%
Percentage of population below poverty level:
| Huntington Ridge: | 3.5% |
| Naperville: | 4.1% |
Median year owner moved in (as recorded in 2022):
| Huntington Ridge: | 2012 |
| Naperville: | 2010 |
Percentage of married-couple families with both working:
| Huntington Ridge: | 72.1% |
| Naperville: | 73.0% |
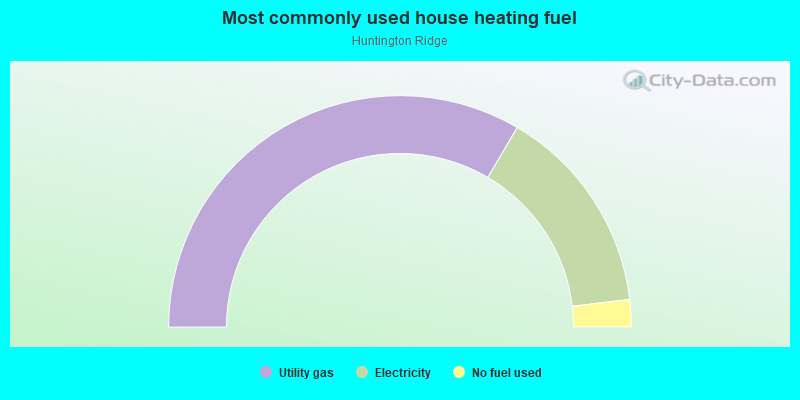
- 67.0%Utility gas
- 29.3%Electricity
- 3.8%No fuel used
Roads and streets:
Culpepper Dr
Length: 0.46 miles
Directions: E-W, N-S, SW-NE
Address range: 1490 to 1599
Directions: E-W, N-S, SW-NE
Address range: 1490 to 1599
Lantern Cir
Length: 0.39 miles
Directions: E-W, N-S, SW-NE
Address range: 1444 to 1532
Directions: E-W, N-S, SW-NE
Address range: 1444 to 1532
Liberty Dr
Length: 0.16 miles
Direction: N-S
Address range: 1000 to 1039
Direction: N-S
Address range: 1000 to 1039
Revere Ct
Length: 0.09 miles
Direction: N-S
Address range: 1000 to 1099
Direction: N-S
Address range: 1000 to 1099