Hydepark neighborhood in Des Moines, Iowa (IA), 50317 detailed profile
Settings
X


Business Search - 14 Million verified businesses
Area: 0.093 square miles
Population: 657
Population density:
| Hydepark: | 7,089 people per square mile |
| Des Moines: | 2,783 people per square mile |

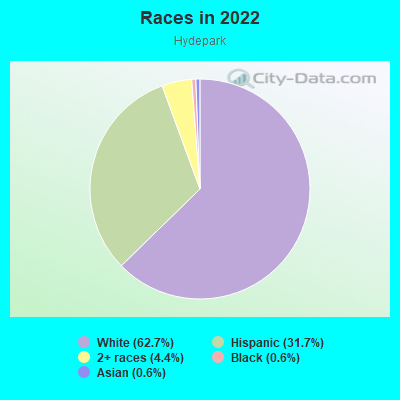
- 41462.7%White
- 20931.7%Hispanic or Latino
- 294.4%Two or more races
- 40.6%Black
- 40.6%Asian
Median household income in 2022:
| Hydepark: | $67,968 |
| Des Moines: | $58,018 |
Distribution of median household income
![Distribution of median household income]()
- 29Less than $10,000
- 22$10,000 to $19,999
- 24$20,000 to $29,999
- 19$30,000 to $39,999
- 16$40,000 to $49,999
- 21$50,000 to $59,999
- 25$60,000 to $74,999
- 45$75,000 to $99,999
- 31$100,000 to $124,999
- 26$125,000 to $149,999
- 19$150,000 to $199,999
- 5$200,000 or more

Distribution of owner-occupied house/condo value
![Distribution of owner-occupied house/condo value]()
- 9Less than $50,000
- 57$50,000 to $99,999
- 71$100,000 to $149,999
- 27$150,000 to $199,999
- 12$200,000 to $249,999
- 1$250,000 to $299,999
- 3$300,000 to $399,999
- 3$400,000 to $499,999
- 1$750,000 to $999,999
- 4$1,000,000 or more

Distribution of rent paid by renters
![Distribution of rent paid by renters]()
- 7Less than $100
- 2$100 to $199
- 2$200 to $299
- 11$300 to $399
- 17$400 to $499
- 3$500 to $599
- 2$600 to $699
- 35$700 to $799
- 3$800 to $899
- 17$900 to $999
- 18$1,000 to $1,249
- 4$1,250 to $1,499
- 1$1,500 to $1,999

Median rent in 2022:
| Hydepark: | $815 |
| Des Moines: | $873 |
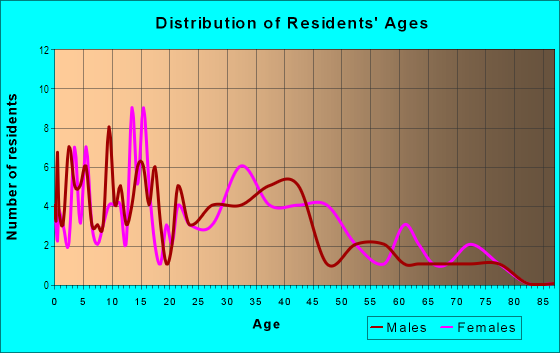
| Males: | 306 |
| Females: | 350 |
Males:
| This neighborhood: | 34.7 years |
| Whole city: | 34.7 years |
| This neighborhood: | 40.0 years |
| Whole city: | 35.5 years |
Average household size:
| Hydepark: | 7.8 people |
| Des Moines: | 2.2 people |
Percentage of family households:
| Hydepark: | 54.2% |
| Des Moines: | 40.8% |
| Here: | 37.5% |
| Des Moines: | 32.7% |
Percentage of married-couple families with children (among all households):
| Hydepark: | 17.4% |
| Des Moines: | 26.2% |
Percentage of single-mother households (among all households):
| Hydepark: | 16.0% |
| Des Moines: | 14.0% |
Percentage of never married males 15 years old and over:
Percentage of never married females 15 years old and over:
| Hydepark: | 23.2% |
| Des Moines: | 21.4% |
Percentage of never married females 15 years old and over:
| Hydepark: | 16.7% |
| city: | 19.3% |
Percentage of people that speak English not well or not at all:
| Hydepark: | 8.4% |
| Des Moines: | 5.0% |
Percentage of people born in this state:
Percentage of people born in another U.S. state:
Percentage of native residents but born outside the U.S.:
Percentage of foreign born residents:
| Here: | 73.7% |
| Des Moines: | 64.1% |
Percentage of people born in another U.S. state:
| Hydepark: | 14.7% |
| Des Moines: | 19.2% |
Percentage of native residents but born outside the U.S.:
| Here: | 0.4% |
| city: | 0.5% |
Percentage of foreign born residents:
| Here: | 11.3% |
| Des Moines: | 16.2% |
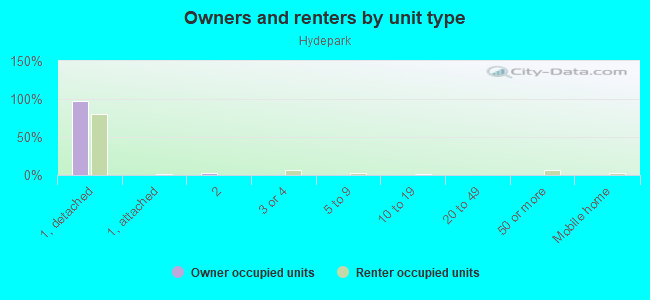
Owner-occupied
Renter-occupied

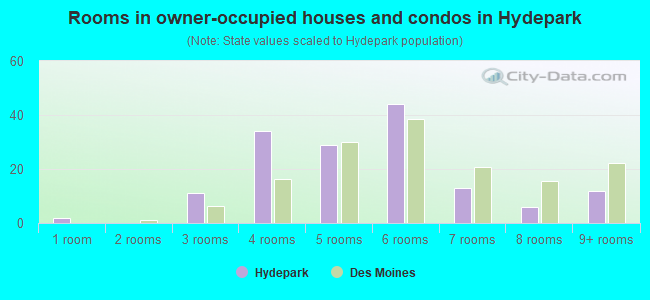
- Rooms in owner-occupied houses and condos in Hydepark
- 21 room
- 02 rooms
- 113 rooms
- 344 rooms
- 295 rooms
- 446 rooms
- 137 rooms
- 68 rooms
- 129+ rooms
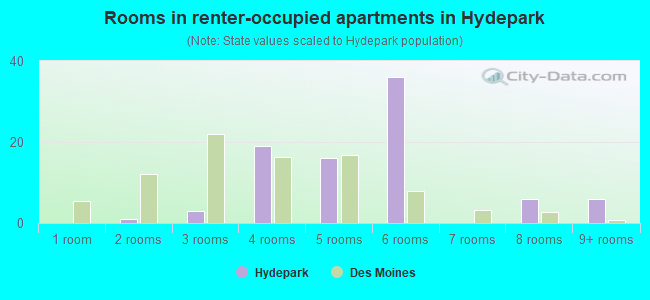
- Rooms in renter-occupied apartments in Hydepark
- 01 room
- 12 rooms
- 33 rooms
- 194 rooms
- 165 rooms
- 366 rooms
- 07 rooms
- 68 rooms
- 69+ rooms
Owner-occupied
Renter-occupied
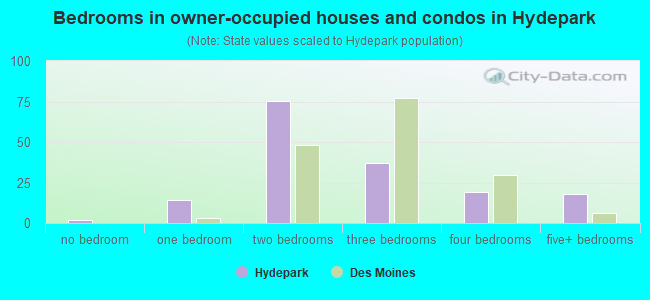
- Bedrooms in owner-occupied houses and condos in Hydepark
- 2no bedroom
- 141 bedroom
- 752 bedrooms
- 373 bedrooms
- 194 bedrooms
- 185+ bedrooms
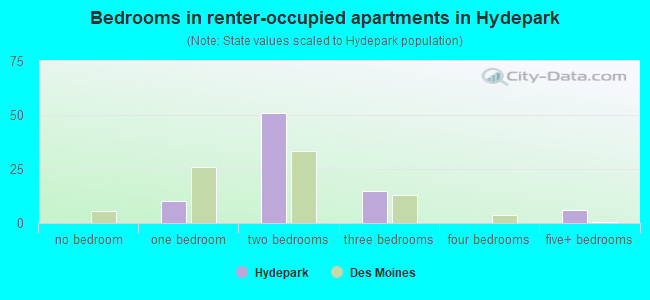
- Bedrooms in renter-occupied apartments in Hydepark
- 0no bedroom
- 101 bedroom
- 512 bedrooms
- 153 bedrooms
- 04 bedrooms
- 65+ bedrooms
Average number of cars or other vehicles available in houses/condos:
Average number of cars or other vehicles available in apartments:
| This neighborhood: | 2.0 |
| Des Moines: | 1.9 |
Average number of cars or other vehicles available in apartments:
| Here: | 1.9 |
| city: | 1.2 |
Percentage of units with a mortgage:
| Hydepark: | 72.0% |
| Des Moines: | 69.7% |
Average estimated value of detached houses in 2022 (97.4% of all units):
| Hydepark: | $138,811 |
| Des Moines: | $201,532 |
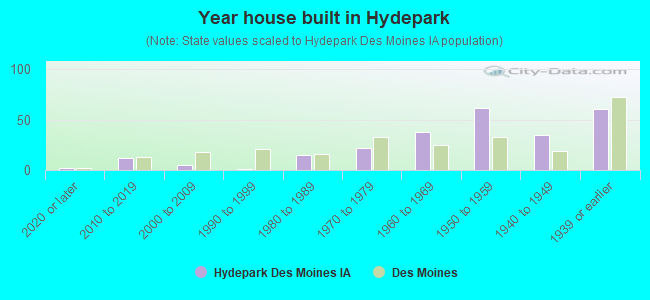
- Year house built in Hydepark
- 22020 or later
- 122010 to 2019
- 52000 to 2009
- 11990 to 1999
- 151980 to 1989
- 221970 to 1979
- 381960 to 1969
- 611950 to 1959
- 351940 to 1949
- 601939 or earlier
City-data.com crime index for city in 2020 (higher means more crime):
| City: | 422.4 |
| U.S. average: | 219.5 |
Travel time to work (commute)
![Travel time to work (commute)]()
- 6Less than 5 minutes
- 225 to 9 minutes
- 3810 to 14 minutes
- 5315 to 19 minutes
- 5820 to 24 minutes
- 2125 to 29 minutes
- 2130 to 34 minutes
- 240 to 44 minutes
- 545 to 59 minutes
- 260 to 89 minutes
- 1590 or more minutes

Means of transportation to work
![Means of transportation to work]()
- 79.3%218Drove a car alone
- 6.9%19Carpooled
- 1.1%3Bus
- 10.2%28Taxi
- 1.5%4Motorcycle
- 0.7%2Bicycle
- 10.9%30Walked
- 4.0%11Other means
- 3.6%10Worked at home

Time leaving home to go to work
![Time leaving home to go to work]()
- 1912:00 a.m. to 4:59 a.m.
- 135:00 a.m. to 5:29 a.m.
- 105:30 a.m. to 5:59 a.m.
- 186:00 a.m. to 6:29 a.m.
- 396:30 a.m. to 6:59 a.m.
- 227:00 a.m. to 7:29 a.m.
- 407:30 a.m. to 7:59 a.m.
- 128:00 a.m. to 8:29 a.m.
- 138:30 a.m. to 8:59 a.m.
- 79:00 a.m. to 9:59 a.m.
- 310:00 a.m. to 10:59 a.m.
- 411:00 a.m. to 11:59 a.m.
- 2012:00 p.m. to 3:59 p.m.
- 154:00 p.m. to 11:59 p.m.

Occupations of males:
- Percentage of males in management occupations (except farmers):
Here: 10.1% city: 9.3%
- Percentage of males in life, physical, and social science occupations:
Here: 5.6% city: 1.1%
- Percentage of males in education, training, and library occupations:
Here: 2.3% city: 2.1%
- Percentage of males in arts, design, entertainment, sports, and media occupations:
Here: 2.8% city: 1.6%
- Percentage of males in service occupations:
Here: 29.6% city: 13.1%
- Percentage of males in sales and office occupations:
Here: 7.8% city: 15.2%
- Percentage of males in construction, extraction, and maintenance occupations:
Here: 9.2% city: 10.0%
- Percentage of males in production occupations:
Here: 12.9% city: 9.9%
- Percentage of males in material moving occupations:
Here: 6.5% city: 7.2%
Occupations of females:
- Percentage of females in management occupations (except farmers):
Here: 9.4% city: 8.5%
- Percentage of females in business and financial operations occupations:
Here: 6.6% city: 7.3%
- Percentage of females in computer and mathematical occupations:
Here: 4.9% city: 2.5%
- Percentage of females in architecture and engineering occupations:
Here: 6.3% city: 0.6%
- Percentage of females in life, physical, and social science occupations:
Here: 1.6% city: 0.7%
- Percentage of females in community and social services occupations:
Here: 7.1% city: 2.1%
- Percentage of females in education, training, and library occupations:
Here: 2.1% city: 7.0%
- Percentage of females in healthcare practitioners and technical occupations:
Here: 5.5% city: 7.6%
- Percentage of females in service occupations:
Here: 29.9% city: 23.4%
- Percentage of females in sales and office occupations:
Here: 20.9% city: 27.7%
- Percentage of females in production occupations:
Here: 3.4% city: 5.0%
- Percentage of females in transportation occupations:
Here: 2.3% city: 0.9%
- Percentage of females in material moving occupations:
Here: 6.6% city: 2.1%
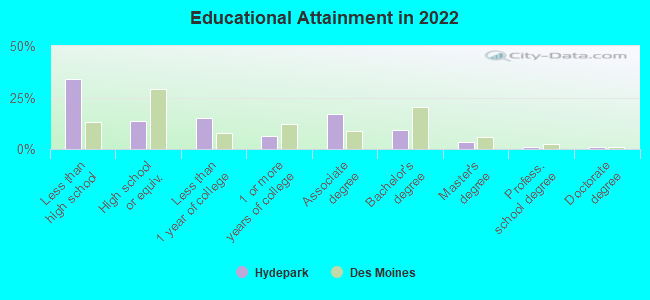
Education in this neighborhood (subdivision or community):
- Percentage of people 3 years and older in K-12 schools:
Hydepark: 26.1% Des Moines: 17.5%
- Percentage of people 3 years and older in undergraduate colleges:
Hydepark: 1.4% Des Moines: 3.7%
- Percentage of people 3 years and older in grad. or professional schools:
Hydepark: 0.9% Des Moines: 1.6%
- Percentage of students K-12 enrolled in private schools:
Hydepark: 15.9% Des Moines: 6.9%
Percentage of population below poverty level:
| Hydepark: | 10.5% |
| Des Moines: | 14.7% |
Median year owner moved in (as recorded in 2022):
Median year renter moved in (as recorded in 2022):
| Hydepark: | 2007 |
| Des Moines: | 2011 |
Median year renter moved in (as recorded in 2022):
| Hydepark: | 2015 |
| Des Moines: | 2020 |
Percentage of married-couple families with both working:
| Hydepark: | 136.7% |
| Des Moines: | 73.4% |
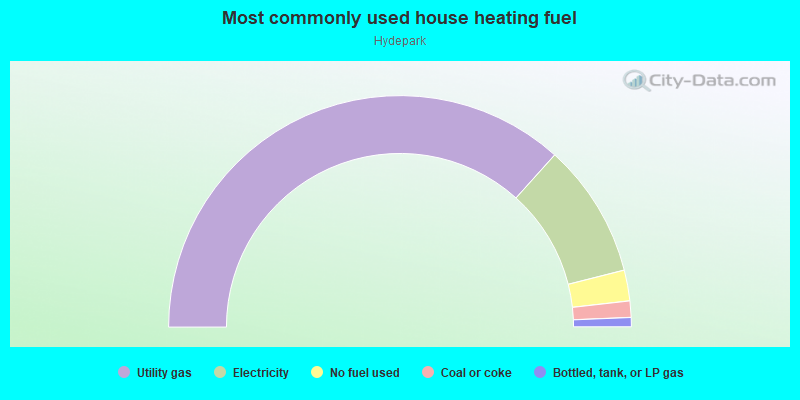
- 73.4%Utility gas
- 18.8%Electricity
- 4.3%No fuel used
- 2.3%Coal or coke
- 1.3%Bottled, tank, or LP gas
Highways in this neighborhood:
E University Ave (State Hwy 163)
Length: 0.08 miles
Direction: E-W
Address range: 2954 to 2999
Direction: E-W
Address range: 2954 to 2999
Roads and streets:
E 30th St
Length: 0.25 miles
Direction: N-S
Address range: 1200 to 1354
Direction: N-S
Address range: 1200 to 1354
State Ave
Length: 0.21 miles
Direction: E-W
Address range: 3000 to 3199
Direction: E-W
Address range: 3000 to 3199
Mahaska Ave
Length: 0.21 miles
Direction: E-W
Address range: 3000 to 3199
Direction: E-W
Address range: 3000 to 3199
Garfield Ave
Length: 0.21 miles
Direction: E-W
Address range: 3000 to 3199
Direction: E-W
Address range: 3000 to 3199
Dubuque Ave
Length: 0.21 miles
Direction: E-W
Address range: 3000 to 3199
Direction: E-W
Address range: 3000 to 3199