Industrial Park neighborhood in Somerville, Massachusetts (MA), 02143 detailed profile
Settings
X


Business Search - 14 Million verified businesses
Area: 0.381 square miles
Population: 507
Population density:
| Industrial Park: | 1,329 people per square mile |
| Somerville: | 19,424 people per square mile |

- 74160.2%Black
- 30124.5%White
- 1098.9%Asian
- 312.5%Hispanic or Latino
- 272.2%Two or more races
- 221.8%Some other race

Median household income in 2022:
| Industrial Park: | $87,472 |
| Somerville: | $124,110 |
Distribution of median household income
![Distribution of median household income]()
- 19Less than $10,000
- 367$10,000 to $19,999
- 229$20,000 to $29,999
- 157$30,000 to $39,999
- 123$40,000 to $49,999
- 16$50,000 to $59,999
- 27$60,000 to $74,999
- 486$75,000 to $99,999
- 228$100,000 to $124,999
- 443$125,000 to $149,999
- 41$150,000 to $199,999
- 43$200,000 or more

Distribution of owner-occupied house/condo value
![Distribution of owner-occupied house/condo value]()
- 45$50,000 to $99,999
- 97$150,000 to $199,999
- 64$200,000 to $249,999
- 59$250,000 to $299,999
- 5$300,000 to $399,999
- 41$400,000 to $499,999
- 74$500,000 to $749,999
- 30$750,000 to $999,999
- 109$1,000,000 or more

Distribution of rent paid by renters
![Distribution of rent paid by renters]()
- 11Less than $100
- 287$100 to $199
- 707$200 to $299
- 580$300 to $399
- 8$400 to $499
- 226$500 to $599
- 54$600 to $699
- 14$700 to $799
- 22$800 to $899
- 85$900 to $999
- 210$1,000 to $1,249
- 202$1,250 to $1,499
- 375$1,500 to $1,999
- 884$2,000 or more

Median rent in 2022:
| Industrial Park: | $1,070 |
| Somerville: | $2,001 |
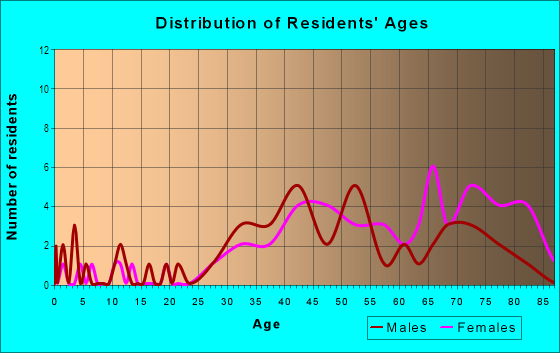
| Males: | 199 |
| Females: | 308 |
Males:
| This neighborhood: | 34.9 years |
| Whole city: | 31.4 years |
| This neighborhood: | 30.5 years |
| Whole city: | 31.6 years |
Average household size:
| Industrial Park: | 1.8 people |
| Somerville: | 2.1 people |
Percentage of family households:
| Industrial Park: | 11.3% |
| Somerville: | 27.8% |
| Here: | 17.0% |
| Somerville: | 28.6% |
Percentage of married-couple families with children (among all households):
| Industrial Park: | 49.1% |
| Somerville: | 34.7% |
Percentage of single-mother households (among all households):
| Industrial Park: | 17.5% |
| Somerville: | 9.3% |
Percentage of never married males 15 years old and over:
Percentage of never married females 15 years old and over:
| Industrial Park: | 21.3% |
| Somerville: | 30.6% |
Percentage of never married females 15 years old and over:
| Industrial Park: | 32.2% |
| city: | 29.5% |
Percentage of people that speak English not well or not at all:
| Industrial Park: | 10.7% |
| Somerville: | 5.6% |
Percentage of people born in this state:
Percentage of people born in another U.S. state:
Percentage of native residents but born outside the U.S.:
Percentage of foreign born residents:
| Here: | 46.5% |
| Somerville: | 39.6% |
Percentage of people born in another U.S. state:
| Industrial Park: | 23.7% |
| Somerville: | 37.6% |
Percentage of native residents but born outside the U.S.:
| Here: | 1.1% |
| city: | 2.2% |
Percentage of foreign born residents:
| Here: | 28.7% |
| Somerville: | 20.6% |

Owner-occupied
Renter-occupied


- Rooms in owner-occupied houses and condos in Industrial Park
- 411 room
- 142 rooms
- 273 rooms
- 174 rooms
- 395 rooms
- 1386 rooms
- 757 rooms
- 88 rooms
- 579+ rooms

- Rooms in renter-occupied apartments in Industrial Park
- 251 room
- 922 rooms
- 293 rooms
- 5614 rooms
- 2505 rooms
- 206 rooms
- 237 rooms
- 318 rooms
- 29+ rooms
Owner-occupied
Renter-occupied

- Bedrooms in owner-occupied houses and condos in Industrial Park
- 41no bedroom
- 411 bedroom
- 412 bedrooms
- 173 bedrooms
- 94 bedrooms
- 465+ bedrooms

- Bedrooms in renter-occupied apartments in Industrial Park
- 25no bedroom
- 1191 bedroom
- 352 bedrooms
- 1873 bedrooms
- 434 bedrooms
- 05+ bedrooms
Average number of cars or other vehicles available in houses/condos:
Average number of cars or other vehicles available in apartments:
| This neighborhood: | 1.1 |
| Somerville: | 1.4 |
Average number of cars or other vehicles available in apartments:
| Here: | 0.9 |
| city: | 1.1 |
Percentage of units with a mortgage:
| Industrial Park: | 49.4% |
| Somerville: | 68.6% |
Housing prices:
- Average estimated value of detached houses in 2022 (3.5% of all units):
Industrial Park: $1,102,924 Somerville: $1,142,268
- Average estimated value of townhouses or other attached units in 2022 (49.1% of all units):
This neighborhood: $1,161,452 city: $1,092,002
- Average estimated value of housing units in 2-unit structures in 2022 (106.5% of all units):
This neighborhood: $894,299 Somerville: $934,300
- Average estimated '22 value of housing units in 3-to-4-unit structures (7.6% of all units):
Industrial Park: $931,564 city: $873,181
- Average estimated '22 value of housing units in 5-or-more-unit structures (70.5% of all units):
Industrial Park: $1,010,722 Somerville: $833,225

- Year house built in Industrial Park
- 302020 or later
- 772010 to 2019
- 4092000 to 2009
- 191990 to 1999
- 371980 to 1989
- 9161970 to 1979
- 211960 to 1969
- 141950 to 1959
- 311940 to 1949
- 1431939 or earlier

City-data.com crime index for city in 2020 (higher means more crime):
| City: | 108.2 |
| U.S. average: | 219.5 |
Travel time to work (commute)
![Travel time to work (commute)]()
- 21Less than 5 minutes
- 325 to 9 minutes
- 3010 to 14 minutes
- 1015 to 19 minutes
- 4220 to 24 minutes
- 1225 to 29 minutes
- 6030 to 34 minutes
- 2335 to 39 minutes
- 2240 to 44 minutes
- 3745 to 59 minutes
- 2260 to 89 minutes
- 690 or more minutes

Means of transportation to work
![Means of transportation to work]()
- 20.7%85Drove a car alone
- 3.4%14Carpooled
- 12.4%51Bus
- 5.6%23Subway or elevated rail
- 31.0%127Light rail, streetcar or trolley
- 4.9%20Ferryboat
- 3.7%15Taxi
- 7.1%29Bicycle
- 12.4%51Walked
- 38.8%159Other means
- 36.3%149Worked at home

Time leaving home to go to work
![Time leaving home to go to work]()
- 912:00 a.m. to 4:59 a.m.
- 65:00 a.m. to 5:29 a.m.
- 225:30 a.m. to 5:59 a.m.
- 266:00 a.m. to 6:29 a.m.
- 116:30 a.m. to 6:59 a.m.
- 287:00 a.m. to 7:29 a.m.
- 337:30 a.m. to 7:59 a.m.
- 358:00 a.m. to 8:29 a.m.
- 468:30 a.m. to 8:59 a.m.
- 579:00 a.m. to 9:59 a.m.
- 1010:00 a.m. to 10:59 a.m.
- 311:00 a.m. to 11:59 a.m.
- 612:00 p.m. to 3:59 p.m.
- 84:00 p.m. to 11:59 p.m.

Occupations of males:
- Percentage of males in management occupations (except farmers):
Here: 17.1% city: 13.3%
- Percentage of males in business and financial operations occupations:
Here: 2.7% city: 7.7%
- Percentage of males in computer and mathematical occupations:
Here: 10.1% city: 14.7%
- Percentage of males in architecture and engineering occupations:
Here: 9.1% city: 8.1%
- Percentage of males in life, physical, and social science occupations:
Here: 1.6% city: 7.0%
- Percentage of males in community and social services occupations:
Here: 1.0% city: 0.8%
- Percentage of males in education, training, and library occupations:
Here: 9.1% city: 7.4%
- Percentage of males in arts, design, entertainment, sports, and media occupations:
Here: 16.3% city: 4.1%
- Percentage of males in service occupations:
Here: 8.6% city: 8.7%
- Percentage of males in sales and office occupations:
Here: 17.3% city: 10.5%
- Percentage of males in production occupations:
Here: 5.3% city: 2.0%
- Percentage of males in material moving occupations:
Here: 4.9% city: 2.2%
Occupations of females:
- Percentage of females in management occupations (except farmers):
Here: 6.4% city: 14.4%
- Percentage of females in business and financial operations occupations:
Here: 2.3% city: 9.2%
- Percentage of females in life, physical, and social science occupations:
Here: 1.5% city: 7.4%
- Percentage of females in community and social services occupations:
Here: 5.4% city: 3.6%
- Percentage of females in education, training, and library occupations:
Here: 11.9% city: 13.1%
- Percentage of females in arts, design, entertainment, sports, and media occupations:
Here: 8.6% city: 4.7%
- Percentage of females in healthcare practitioners and technical occupations:
Here: 9.1% city: 7.8%
- Percentage of females in service occupations:
Here: 22.3% city: 13.0%
- Percentage of females in sales and office occupations:
Here: 30.1% city: 15.4%
Percentage of people 16-64 in Armed Forces:
| Industrial Park: | 0.0% |
| Somerville: | 0.1% |
Education in this neighborhood (subdivision or community):
- Percentage of people 3 years and older in K-12 schools:
Industrial Park: 98.6% Somerville: 7.2%
- Percentage of people 3 years and older in undergraduate colleges:
Industrial Park: 61.4% Somerville: 6.0%
- Percentage of people 3 years and older in grad. or professional schools:
Industrial Park: 110.1% Somerville: 6.9%
- Percentage of students K-12 enrolled in private schools:
Industrial Park: 63.7% Somerville: 9.1%
Percentage of population below poverty level:
| Industrial Park: | 16.5% |
| Somerville: | 9.4% |
Median year owner moved in (as recorded in 2022):
| Industrial Park: | 2007 |
| Somerville: | 2012 |
Percentage of married-couple families with both working:
| Industrial Park: | 81.4% |
| Somerville: | 82.8% |

- 46.6%Utility gas
- 41.9%Electricity
- 5.7%Fuel oil, kerosene, etc.
- 3.9%No fuel used
- 0.9%Bottled, tank, or LP gas
- 0.9%Other fuel
Limited-access highways (interstate or state) in this neighborhood:
I- 93
Length: 1.30 miles
Directions: N-S, SE-NW
Directions: N-S, SE-NW
Highways in this neighborhood:
McGrath Hwy (State Hwy 28)
Length: 0.79 miles
Directions: E-W, SE-NW
Address range: 1 to 75
Directions: E-W, SE-NW
Address range: 1 to 75
Monsignor Obrien Hwy (State Hwy 28)
Length: 0.02 miles
Direction: SE-NW
Direction: SE-NW
Roads and streets:
Inner Belt (Inner Belt Rd)
Length: 0.44 miles
Directions: E-W, N-S, SE-NW, SW-NE
Address range: 80 to 193
Directions: E-W, N-S, SE-NW, SW-NE
Address range: 80 to 193
Inner Belt Rd
Length: 0.20 miles
Direction: N-S
Address range: 32 to 79
Direction: N-S
Address range: 32 to 79
Chestnut St
Length: 0.20 miles
Direction: SE-NW
Address range: 2 to 99
Direction: SE-NW
Address range: 2 to 99
3rd Ave
Length: 0.19 miles
Direction: E-W
Address range: 1 to 99
Direction: E-W
Address range: 1 to 99
Linwood St
Length: 0.18 miles
Direction: SE-NW
Direction: SE-NW
Cobble Hill Rd
Length: 0.15 miles
Directions: E-W, N-S
Directions: E-W, N-S
Fitchburg St
Length: 0.15 miles
Directions: E-W, SE-NW, SW-NE
Address range: 5 to 99
Directions: E-W, SE-NW, SW-NE
Address range: 5 to 99
New Washington St
Length: 0.15 miles
Direction: E-W
Address range: 26 to 99
Direction: E-W
Address range: 26 to 99
Poplar St
Length: 0.13 miles
Directions: N-S, SW-NE
Address range: 1 to 99
Directions: N-S, SW-NE
Address range: 1 to 99
1st Ave
Length: 0.08 miles
Direction: E-W
Address range: 1 to 99
Direction: E-W
Address range: 1 to 99
Railroad features:
Mbta Commuter Rail
Length: 8.03 miles
Directions: E-W, N-S, SE-NW, SW-NE
Directions: E-W, N-S, SE-NW, SW-NE
Mbta Orange Line RR
Length: 0.42 miles
Directions: N-S, SE-NW
Directions: N-S, SE-NW
Limited-access highways (interstate or state) in this neighborhood:
John F Fitzgerald Expy (I- 93)
Length: 0.09 miles
Direction: SE-NW
Direction: SE-NW
Railroad features:
Boston and Maine RR
Length: 0.07 miles
Direction: SE-NW
Direction: SE-NW