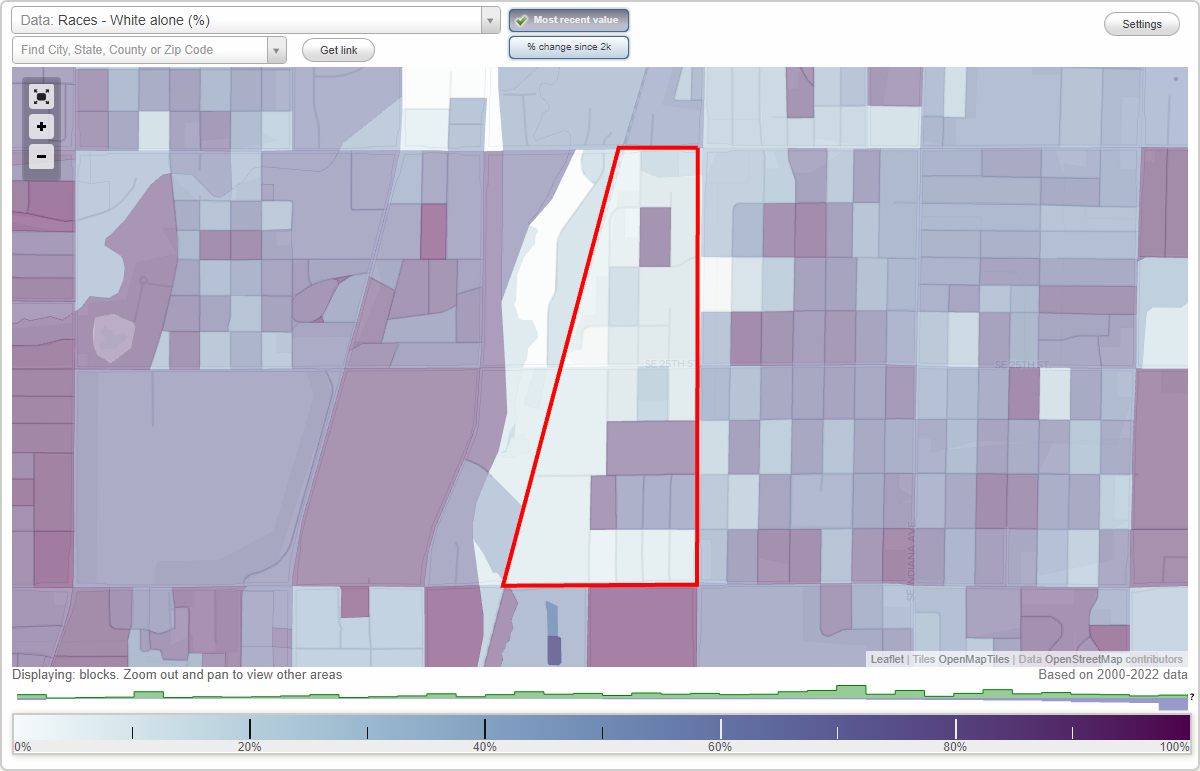
Jefferson Square neighborhood in Topeka, Kansas (KS), 66605 detailed profile
Settings
X

Business Search - 14 Million verified businesses
Area: 0.317 square miles
Population: 544
Population density:
| Jefferson Square: | 1,717 people per square mile |
| Topeka: | 2,240 people per square mile |

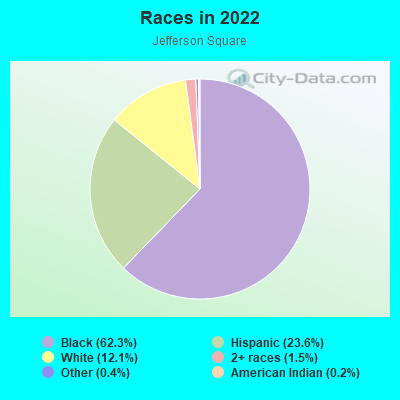
- 34062.3%Black
- 12923.6%Hispanic or Latino
- 6612.1%White
- 81.5%Two or more races
- 20.4%Some other race
- 10.2%American Indian
Median household income in 2022:
| Jefferson Square: | $42,957 |
| Topeka: | $50,709 |
Distribution of median household income
![Distribution of median household income]()
- 16Less than $10,000
- 38$10,000 to $19,999
- 31$20,000 to $29,999
- 10$30,000 to $39,999
- 13$40,000 to $49,999
- 20$50,000 to $59,999
- 21$60,000 to $74,999
- 30$75,000 to $99,999
- 6$100,000 to $124,999
- 9$125,000 to $149,999
- 10$150,000 to $199,999
- 4$200,000 or more

Distribution of owner-occupied house/condo value
![Distribution of owner-occupied house/condo value]()
- 48Less than $50,000
- 142$50,000 to $99,999
- 10$100,000 to $149,999
- 8$150,000 to $199,999
- 2$200,000 to $249,999
- 19$250,000 to $299,999
- 2$300,000 to $399,999
- 5$400,000 to $499,999

Distribution of rent paid by renters
![Distribution of rent paid by renters]()
- 5Less than $100
- 9$100 to $199
- 20$200 to $299
- 6$300 to $399
- 16$400 to $499
- 41$500 to $599
- 27$600 to $699
- 10$700 to $799
- 18$800 to $899
- 11$900 to $999
- 9$1,000 to $1,249

Median rent in 2022:
| Jefferson Square: | $643 |
| Topeka: | $670 |
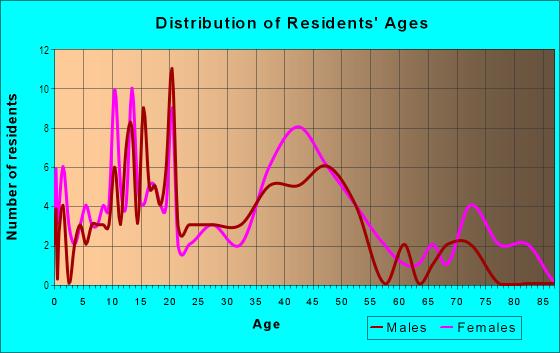
| Males: | 318 |
| Females: | 226 |
Males:
| This neighborhood: | 30.1 years |
| Whole city: | 37.1 years |
| This neighborhood: | 24.3 years |
| Whole city: | 38.8 years |
Average household size:
| Jefferson Square: | 3.4 people |
| Topeka: | 2.2 people |
Percentage of family households:
| Jefferson Square: | 42.7% |
| Topeka: | 38.2% |
| Here: | 36.8% |
| Topeka: | 35.2% |
Percentage of married-couple families with children (among all households):
| Jefferson Square: | 19.4% |
| Topeka: | 27.5% |
Percentage of single-mother households (among all households):
| Jefferson Square: | 10.9% |
| Topeka: | 10.7% |
Percentage of never married males 15 years old and over:
Percentage of never married females 15 years old and over:
| Jefferson Square: | 28.8% |
| Topeka: | 19.2% |
Percentage of never married females 15 years old and over:
| Jefferson Square: | 18.3% |
| city: | 17.5% |
Percentage of people that speak English not well or not at all:
| Jefferson Square: | 1.2% |
| Topeka: | 2.2% |
Percentage of people born in this state:
Percentage of people born in another U.S. state:
Percentage of native residents but born outside the U.S.:
Percentage of foreign born residents:
| Here: | 70.8% |
| Topeka: | 67.1% |
Percentage of people born in another U.S. state:
| Jefferson Square: | 18.3% |
| Topeka: | 25.0% |
Percentage of native residents but born outside the U.S.:
| Here: | 2.3% |
| city: | 1.7% |
Percentage of foreign born residents:
| Here: | 8.6% |
| Topeka: | 6.3% |
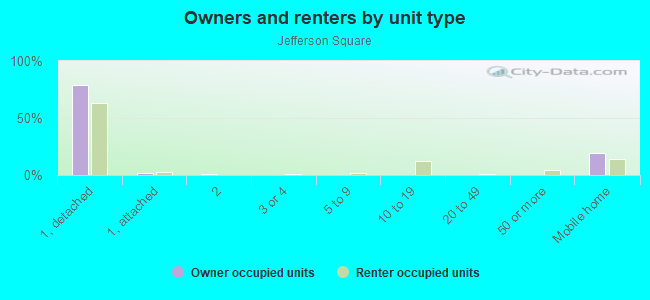
Owner-occupied
Renter-occupied

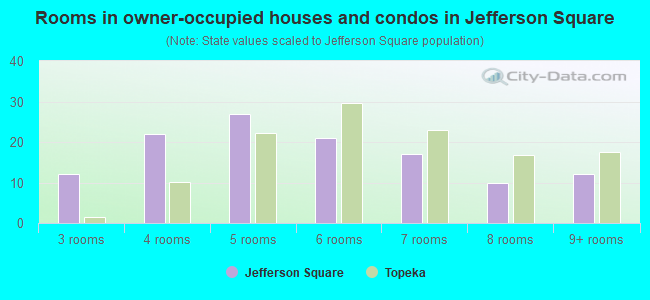
- Rooms in owner-occupied houses and condos in Jefferson Square
- 01 room
- 02 rooms
- 123 rooms
- 224 rooms
- 275 rooms
- 216 rooms
- 177 rooms
- 108 rooms
- 129+ rooms
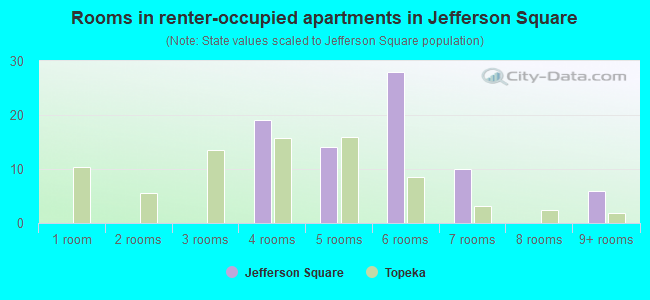
- Rooms in renter-occupied apartments in Jefferson Square
- 01 room
- 02 rooms
- 03 rooms
- 194 rooms
- 145 rooms
- 286 rooms
- 107 rooms
- 08 rooms
- 69+ rooms
Owner-occupied
Renter-occupied
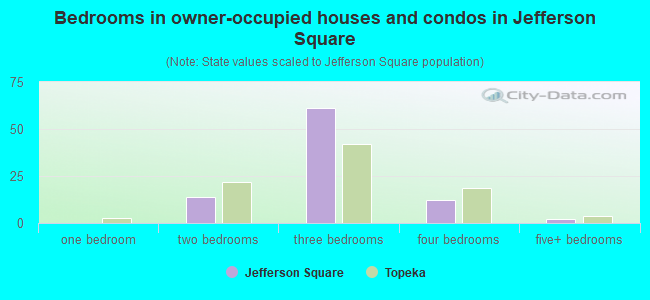
- Bedrooms in owner-occupied houses and condos in Jefferson Square
- 0no bedroom
- 01 bedroom
- 142 bedrooms
- 613 bedrooms
- 124 bedrooms
- 25+ bedrooms
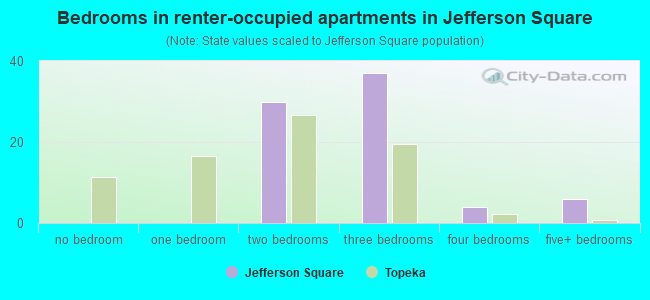
- Bedrooms in renter-occupied apartments in Jefferson Square
- 0no bedroom
- 01 bedroom
- 302 bedrooms
- 373 bedrooms
- 44 bedrooms
- 65+ bedrooms
Average number of cars or other vehicles available in houses/condos:
Average number of cars or other vehicles available in apartments:
| This neighborhood: | 1.8 |
| Topeka: | 1.9 |
Average number of cars or other vehicles available in apartments:
| Here: | 1.5 |
| city: | 1.2 |
Percentage of units with a mortgage:
| Jefferson Square: | 46.4% |
| Topeka: | 54.9% |
Average estimated value of detached houses in 2022 (97.2% of all units):
| Jefferson Square: | $106,986 |
| Kansas: | $264,181 |
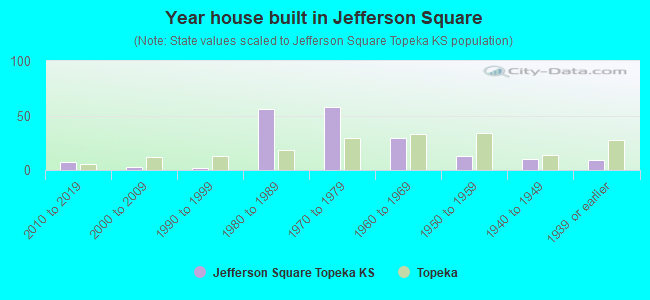
- Year house built in Jefferson Square
- 02020 or later
- 72010 to 2019
- 32000 to 2009
- 21990 to 1999
- 561980 to 1989
- 581970 to 1979
- 291960 to 1969
- 131950 to 1959
- 101940 to 1949
- 91939 or earlier
City-data.com crime index for city in 2020 (higher means more crime):
| City: | 8.2 |
| U.S. average: | 219.5 |
Travel time to work (commute)
![Travel time to work (commute)]()
- 2Less than 5 minutes
- 295 to 9 minutes
- 4610 to 14 minutes
- 5515 to 19 minutes
- 1920 to 24 minutes
- 625 to 29 minutes
- 930 to 34 minutes
- 535 to 39 minutes
- 445 to 59 minutes
- 260 to 89 minutes
- 190 or more minutes

Means of transportation to work
![Means of transportation to work]()
- 78.0%170Drove a car alone
- 8.7%19Carpooled
- 1.8%4Bus
- 3.2%7Walked
- 3.7%8Other means
- 3.2%7Worked at home

Time leaving home to go to work
![Time leaving home to go to work]()
- 45:00 a.m. to 5:29 a.m.
- 55:30 a.m. to 5:59 a.m.
- 26:00 a.m. to 6:29 a.m.
- 206:30 a.m. to 6:59 a.m.
- 297:00 a.m. to 7:29 a.m.
- 427:30 a.m. to 7:59 a.m.
- 138:00 a.m. to 8:29 a.m.
- 38:30 a.m. to 8:59 a.m.
- 109:00 a.m. to 9:59 a.m.
- 2110:00 a.m. to 10:59 a.m.
- 212:00 p.m. to 3:59 p.m.
- 204:00 p.m. to 11:59 p.m.

Occupations of males:
- Percentage of males in business and financial operations occupations:
Here: 3.6% city: 3.8%
- Percentage of males in computer and mathematical occupations:
Here: 2.9% city: 4.7%
- Percentage of males in arts, design, entertainment, sports, and media occupations:
Here: 2.8% city: 1.2%
- Percentage of males in service occupations:
Here: 49.5% city: 16.6%
- Percentage of males in sales and office occupations:
Here: 10.8% city: 14.5%
- Percentage of males in farming, fishing, and forestry occupations:
Here: 4.7% city: 0.8%
- Percentage of males in construction, extraction, and maintenance occupations:
Here: 4.7% city: 9.7%
- Percentage of males in production occupations:
Here: 17.0% city: 8.2%
- Percentage of males in transportation occupations:
Here: 4.7% city: 4.6%
- Percentage of males in material moving occupations:
Here: 5.7% city: 8.9%
Occupations of females:
- Percentage of females in management occupations (except farmers):
Here: 2.8% city: 6.6%
- Percentage of females in business and financial operations occupations:
Here: 9.8% city: 6.9%
- Percentage of females in life, physical, and social science occupations:
Here: 4.7% city: 0.7%
- Percentage of females in education, training, and library occupations:
Here: 9.5% city: 8.7%
- Percentage of females in arts, design, entertainment, sports, and media occupations:
Here: 7.4% city: 1.7%
- Percentage of females in healthcare practitioners and technical occupations:
Here: 26.5% city: 11.5%
- Percentage of females in service occupations:
Here: 43.5% city: 22.2%
- Percentage of females in sales and office occupations:
Here: 12.8% city: 26.9%
- Percentage of females in construction, extraction, and maintenance occupations:
Here: 3.6% city: 0.3%
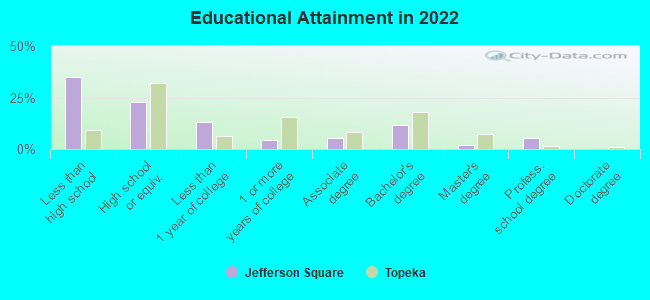
Education in this neighborhood (subdivision or community):
- Percentage of people 3 years and older in K-12 schools:
Jefferson Square: 34.6% Topeka: 14.7%
- Percentage of people 3 years and older in undergraduate colleges:
Jefferson Square: 16.2% Topeka: 4.3%
- Percentage of people 3 years and older in grad. or professional schools:
Jefferson Square: 1.2% Topeka: 1.1%
- Percentage of students K-12 enrolled in private schools:
Jefferson Square: 7.1% Topeka: 10.9%
Percentage of population below poverty level:
| Jefferson Square: | 23.7% |
| Topeka: | 17.7% |
Median year owner moved in (as recorded in 2022):
Median year renter moved in (as recorded in 2022):
| Jefferson Square: | 2006 |
| Topeka: | 2011 |
Median year renter moved in (as recorded in 2022):
| Jefferson Square: | 2019 |
| Topeka: | 2020 |
Percentage of married-couple families with both working:
| Jefferson Square: | 52.4% |
| Topeka: | 68.4% |
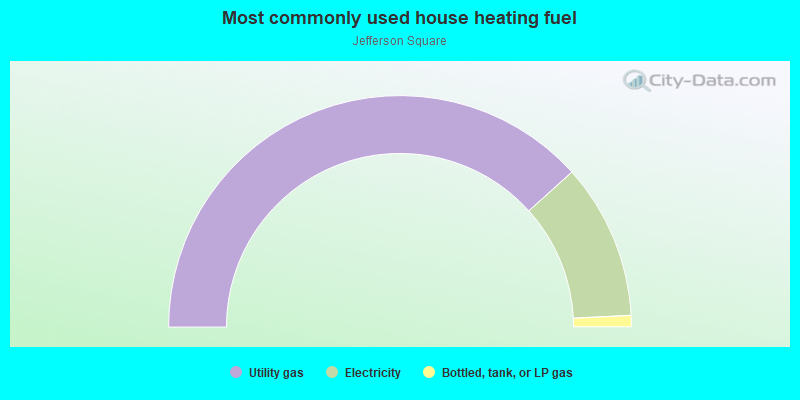
- 76.6%Utility gas
- 21.7%Electricity
- 1.6%Bottled, tank, or LP gas
Roads and streets:
SE Monroe St
Length: 0.86 miles
Directions: N-S, SW-NE
Address range: 2200 to 2899
Directions: N-S, SW-NE
Address range: 2200 to 2899
SE Madison St
Length: 0.74 miles
Direction: N-S
Address range: 2200 to 2899
Direction: N-S
Address range: 2200 to 2899
SE Jefferson St
Length: 0.73 miles
Direction: N-S
Address range: 2101 to 2891
Direction: N-S
Address range: 2101 to 2891
SE 27th St
Length: 0.48 miles
Direction: E-W
Address range: 100 to 599
Direction: E-W
Address range: 100 to 599
SE 29th St
Length: 0.33 miles
Directions: E-W, SW-NE
Address range: 374 to 447
Directions: E-W, SW-NE
Address range: 374 to 447
SE 28th St
Length: 0.32 miles
Direction: E-W
Address range: 300 to 699
Direction: E-W
Address range: 300 to 699
SE 26th St
Length: 0.27 miles
Direction: E-W
Address range: 400 to 599
Direction: E-W
Address range: 400 to 599
SE Cunningham St
Length: 0.25 miles
Direction: N-S
Address range: 2700 to 2899
Direction: N-S
Address range: 2700 to 2899
SE 24th St
Length: 0.25 miles
Directions: E-W, SW-NE
Address range: 200 to 499
Directions: E-W, SW-NE
Address range: 200 to 499
SE 23rd St
Length: 0.18 miles
Direction: E-W
Address range: 300 to 498
Direction: E-W
Address range: 300 to 498
SE 25th St
Length: 0.18 miles
Direction: E-W
Address range: 300 to 499
Direction: E-W
Address range: 300 to 499
SE 22nd St
Length: 0.17 miles
Directions: E-W, SW-NE
Address range: 300 to 499
Directions: E-W, SW-NE
Address range: 300 to 499
SE Quincy Ct
Length: 0.05 miles
Directions: E-W, N-S, SW-NE
Address range: 2400 to 2499
Directions: E-W, N-S, SW-NE
Address range: 2400 to 2499