Jordan Grove neighborhood in West Des Moines, Iowa (IA), 50265 detailed profile
Settings
X


Business Search - 14 Million verified businesses
Area: 0.196 square miles
Population: 951
Population density:
| Jordan Grove: | 4,854 people per square mile |
| West Des Moines: | 2,761 people per square mile |

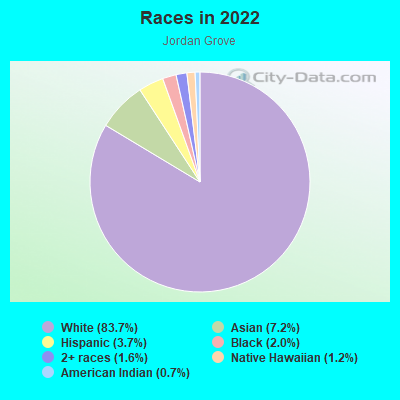
- 80083.7%White
- 697.2%Asian
- 353.7%Hispanic or Latino
- 192.0%Black
- 151.6%Two or more races
- 111.2%Native Hawaiian and Other
Pacific Islander - 70.7%American Indian
Median household income in 2022:
| Jordan Grove: | $100,385 |
| West Des Moines: | $85,731 |
Distribution of median household income
![Distribution of median household income]()
- 14Less than $10,000
- 20$10,000 to $19,999
- 15$20,000 to $29,999
- 8$30,000 to $39,999
- 33$40,000 to $49,999
- 9$50,000 to $59,999
- 63$60,000 to $74,999
- 66$75,000 to $99,999
- 76$100,000 to $124,999
- 39$125,000 to $149,999
- 59$150,000 to $199,999
- 31$200,000 or more

Distribution of owner-occupied house/condo value
![Distribution of owner-occupied house/condo value]()
- 18Less than $50,000
- 7$50,000 to $99,999
- 27$100,000 to $149,999
- 50$150,000 to $199,999
- 100$200,000 to $249,999
- 118$250,000 to $299,999
- 64$300,000 to $399,999
- 4$400,000 to $499,999
- 7$500,000 to $749,999

Distribution of rent paid by renters
![Distribution of rent paid by renters]()
- 11$500 to $599
- 6$800 to $899
- 24$1,000 to $1,249
- 21$1,250 to $1,499
- 1$1,500 to $1,999

Median rent in 2022:
| Jordan Grove: | $1,240 |
| West Des Moines: | $1,075 |
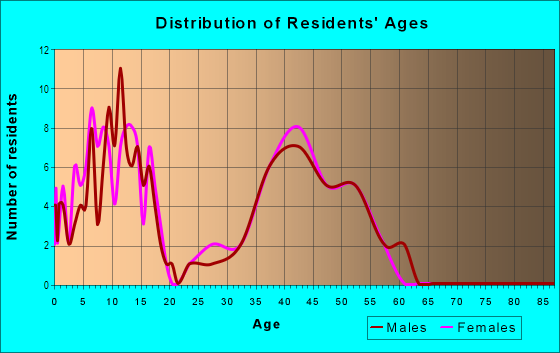
| Males: | 475 |
| Females: | 476 |
Males:
| This neighborhood: | 44.7 years |
| Whole city: | 34.9 years |
| This neighborhood: | 45.2 years |
| Whole city: | 34.7 years |
Average household size:
| Jordan Grove: | 2.4 people |
| West Des Moines: | 2.3 people |
Percentage of family households:
| Jordan Grove: | 46.0% |
| West Des Moines: | 42.3% |
| Here: | 60.0% |
| West Des Moines: | 43.6% |
Percentage of married-couple families with children (among all households):
| Jordan Grove: | 42.3% |
| West Des Moines: | 33.4% |
Percentage of single-mother households (among all households):
| Jordan Grove: | 18.3% |
| West Des Moines: | 6.0% |
Percentage of never married males 15 years old and over:
Percentage of never married females 15 years old and over:
| Jordan Grove: | 10.6% |
| West Des Moines: | 17.8% |
Percentage of never married females 15 years old and over:
| Jordan Grove: | 9.1% |
| city: | 19.9% |
Percentage of people that speak English not well or not at all:
| Jordan Grove: | 0.0% |
| West Des Moines: | 2.1% |
Percentage of people born in this state:
Percentage of people born in another U.S. state:
Percentage of native residents but born outside the U.S.:
Percentage of foreign born residents:
| Here: | 68.0% |
| West Des Moines: | 61.7% |
Percentage of people born in another U.S. state:
| Jordan Grove: | 23.9% |
| West Des Moines: | 26.7% |
Percentage of native residents but born outside the U.S.:
| Here: | 0.0% |
| city: | 0.1% |
Percentage of foreign born residents:
| Here: | 8.1% |
| West Des Moines: | 11.5% |
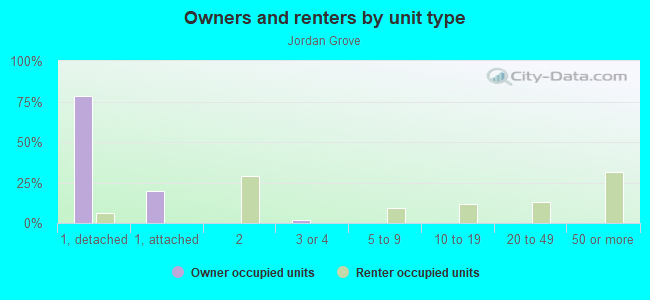
Owner-occupied
Renter-occupied

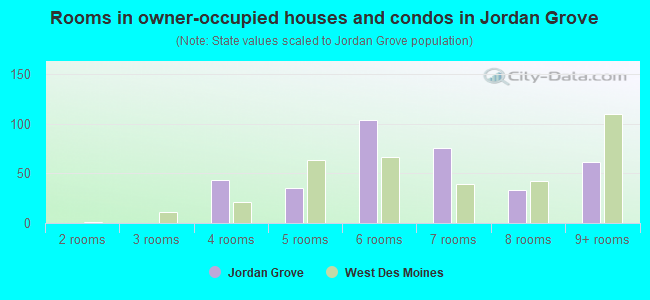
- Rooms in owner-occupied houses and condos in Jordan Grove
- 01 room
- 02 rooms
- 03 rooms
- 434 rooms
- 355 rooms
- 1046 rooms
- 767 rooms
- 338 rooms
- 629+ rooms
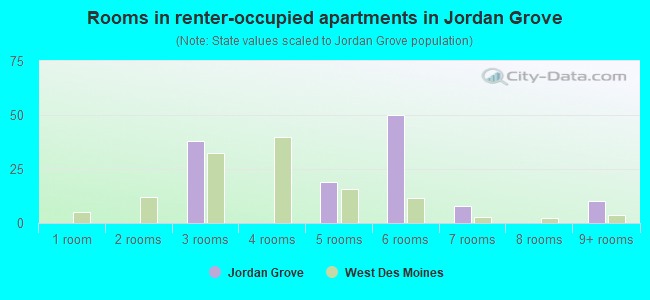
- Rooms in renter-occupied apartments in Jordan Grove
- 01 room
- 02 rooms
- 383 rooms
- 04 rooms
- 195 rooms
- 506 rooms
- 87 rooms
- 08 rooms
- 109+ rooms
Owner-occupied
Renter-occupied
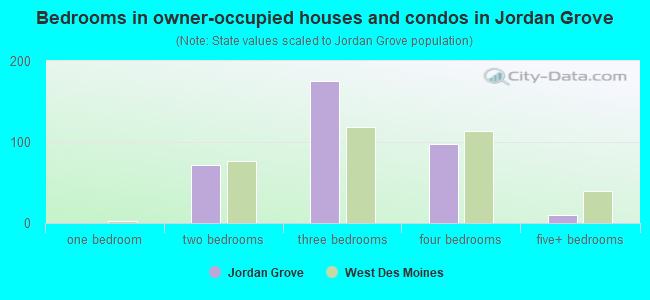
- Bedrooms in owner-occupied houses and condos in Jordan Grove
- 0no bedroom
- 01 bedroom
- 722 bedrooms
- 1753 bedrooms
- 974 bedrooms
- 105+ bedrooms
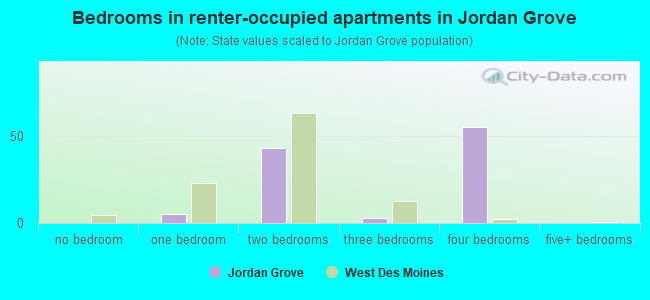
- Bedrooms in renter-occupied apartments in Jordan Grove
- 0no bedroom
- 51 bedroom
- 432 bedrooms
- 33 bedrooms
- 554 bedrooms
- 05+ bedrooms
Average number of cars or other vehicles available in houses/condos:
Average number of cars or other vehicles available in apartments:
| This neighborhood: | 1.9 |
| West Des Moines: | 2.1 |
Average number of cars or other vehicles available in apartments:
| Here: | 1.3 |
| city: | 1.4 |
Percentage of units with a mortgage:
| Jordan Grove: | 72.5% |
| West Des Moines: | 69.0% |
Housing prices:
- Average estimated value of detached houses in 2022 (69.3% of all units):
Jordan Grove: $261,851 West Des Moines: $341,142
- Average estimated value of townhouses or other attached units in 2022 (20.0% of all units):
This neighborhood: $183,024 city: $242,459
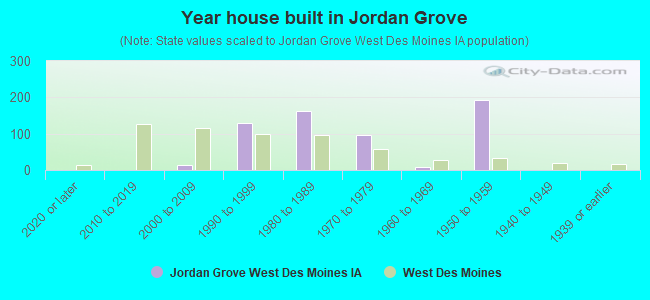
- Year house built in Jordan Grove
- 02020 or later
- 02010 to 2019
- 152000 to 2009
- 1301990 to 1999
- 1621980 to 1989
- 971970 to 1979
- 91960 to 1969
- 1931950 to 1959
- 01940 to 1949
- 01939 or earlier
City-data.com crime index for city in 2020 (higher means more crime):
| City: | 132.1 |
| U.S. average: | 219.5 |
Travel time to work (commute)
![Travel time to work (commute)]()
- 25Less than 5 minutes
- 2995 to 9 minutes
- 43710 to 14 minutes
- 38315 to 19 minutes
- 27120 to 24 minutes
- 8925 to 29 minutes
- 3230 to 34 minutes
- 635 to 39 minutes
- 4440 to 44 minutes
- 345 to 59 minutes
- 760 to 89 minutes
- 690 or more minutes

Means of transportation to work
![Means of transportation to work]()
- 77.0%388Drove a car alone
- 9.9%50Carpooled
- 0.6%3Bus
- 4.8%24Taxi
- 1.6%8Walked
- 12.1%61Worked at home

Time leaving home to go to work
![Time leaving home to go to work]()
- 565:30 a.m. to 5:59 a.m.
- 1016:00 a.m. to 6:29 a.m.
- 2506:30 a.m. to 6:59 a.m.
- 2527:00 a.m. to 7:29 a.m.
- 2097:30 a.m. to 7:59 a.m.
- 3328:00 a.m. to 8:29 a.m.
- 818:30 a.m. to 8:59 a.m.
- 1949:00 a.m. to 9:59 a.m.
- 3010:00 a.m. to 10:59 a.m.
- 611:00 a.m. to 11:59 a.m.
- 3112:00 p.m. to 3:59 p.m.
- 774:00 p.m. to 11:59 p.m.

Occupations of males:
- Percentage of males in management occupations (except farmers):
Here: 13.4% city: 13.3%
- Percentage of males in business and financial operations occupations:
Here: 22.3% city: 11.6%
- Percentage of males in computer and mathematical occupations:
Here: 13.9% city: 10.5%
- Percentage of males in architecture and engineering occupations:
Here: 4.7% city: 3.0%
- Percentage of males in life, physical, and social science occupations:
Here: 3.4% city: 1.5%
- Percentage of males in legal occupations:
Here: 1.5% city: 2.7%
- Percentage of males in education, training, and library occupations:
Here: 2.1% city: 3.5%
- Percentage of males in arts, design, entertainment, sports, and media occupations:
Here: 2.0% city: 1.5%
- Percentage of males in service occupations:
Here: 8.4% city: 8.4%
- Percentage of males in sales and office occupations:
Here: 20.0% city: 19.0%
- Percentage of males in construction, extraction, and maintenance occupations:
Here: 3.5% city: 4.2%
- Percentage of males in production occupations:
Here: 4.1% city: 4.8%
- Percentage of males in transportation occupations:
Here: 3.8% city: 3.5%
- Percentage of males in material moving occupations:
Here: 2.3% city: 4.2%
Occupations of females:
- Percentage of females in management occupations (except farmers):
Here: 4.3% city: 9.1%
- Percentage of females in business and financial operations occupations:
Here: 21.7% city: 12.8%
- Percentage of females in computer and mathematical occupations:
Here: 4.7% city: 5.2%
- Percentage of females in life, physical, and social science occupations:
Here: 3.4% city: 1.7%
- Percentage of females in community and social services occupations:
Here: 3.2% city: 2.1%
- Percentage of females in legal occupations:
Here: 2.1% city: 0.6%
- Percentage of females in education, training, and library occupations:
Here: 7.9% city: 10.6%
- Percentage of females in healthcare practitioners and technical occupations:
Here: 18.1% city: 10.0%
- Percentage of females in service occupations:
Here: 8.5% city: 16.9%
- Percentage of females in sales and office occupations:
Here: 26.4% city: 22.6%
- Percentage of females in production occupations:
Here: 2.6% city: 1.4%
- Percentage of females in material moving occupations:
Here: 7.9% city: 1.6%
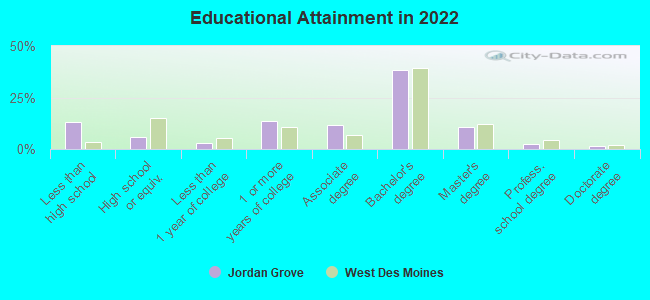
Education in this neighborhood (subdivision or community):
- Percentage of people 3 years and older in K-12 schools:
Jordan Grove: 20.2% West Des Moines: 17.6%
- Percentage of people 3 years and older in undergraduate colleges:
Jordan Grove: 1.6% West Des Moines: 4.2%
- Percentage of people 3 years and older in grad. or professional schools:
Jordan Grove: 1.2% West Des Moines: 3.1%
- Percentage of students K-12 enrolled in private schools:
Jordan Grove: 26.9% West Des Moines: 8.0%
Percentage of population below poverty level:
| Jordan Grove: | 3.2% |
| West Des Moines: | 7.8% |
Median year owner moved in (as recorded in 2022):
Median year renter moved in (as recorded in 2022):
| Jordan Grove: | 2007 |
| West Des Moines: | 2013 |
Median year renter moved in (as recorded in 2022):
| Jordan Grove: | 2016 |
| West Des Moines: | 2022 |
Percentage of married-couple families with both working:
| Jordan Grove: | 75.4% |
| West Des Moines: | 78.0% |
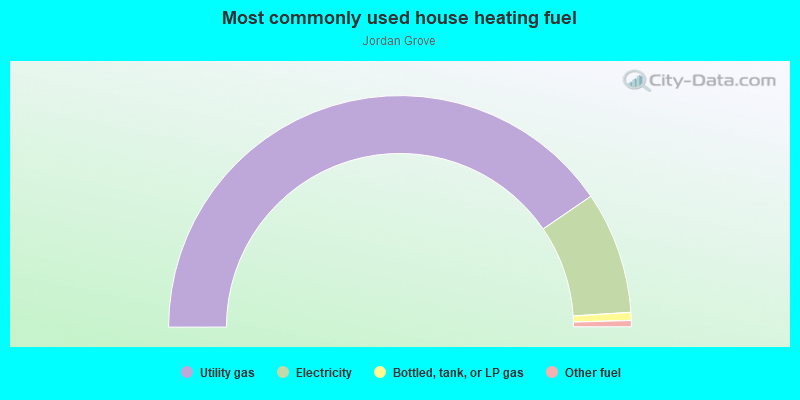
- 80.9%Utility gas
- 17.1%Electricity
- 1.1%Bottled, tank, or LP gas
- 0.9%Other fuel
Roads and streets:
Jordan Grove
Length: 0.78 miles
Directions: E-W, SE-NW
Address range: 2500 to 3299
Directions: E-W, SE-NW
Address range: 2500 to 3299
E P True Pkwy
Length: 0.44 miles
Direction: E-W
Address range: 2900 to 3411
Direction: E-W
Address range: 2900 to 3411
Country Side Dr
Length: 0.38 miles
Directions: E-W, SW-NE
Address range: 2500 to 2999
Directions: E-W, SW-NE
Address range: 2500 to 2999
S 33rd St
Length: 0.23 miles
Directions: E-W, N-S, SE-NW, SW-NE
Address range: 100 to 299
Directions: E-W, N-S, SE-NW, SW-NE
Address range: 100 to 299
S 26th St
Length: 0.20 miles
Directions: N-S, SW-NE
Address range: 156 to 299
Directions: N-S, SW-NE
Address range: 156 to 299
S 32nd St
Length: 0.20 miles
Directions: E-W, N-S, SW-NE
Address range: 100 to 299
Directions: E-W, N-S, SW-NE
Address range: 100 to 299
S 31st St
Length: 0.19 miles
Directions: N-S, SW-NE
Address range: 100 to 299
Directions: N-S, SW-NE
Address range: 100 to 299
S 29th St
Length: 0.17 miles
Directions: N-S, SW-NE
Address range: 200 to 299
Directions: N-S, SW-NE
Address range: 200 to 299
Country Side Pl
Length: 0.15 miles
Directions: E-W, N-S, SE-NW
Address range: 2500 to 2599
Directions: E-W, N-S, SE-NW
Address range: 2500 to 2599
S 27th St
Length: 0.15 miles
Directions: N-S, SW-NE
Address range: 200 to 299
Directions: N-S, SW-NE
Address range: 200 to 299
S 30th St
Length: 0.14 miles
Directions: N-S, SE-NW, SW-NE
Address range: 200 to 299
Directions: N-S, SE-NW, SW-NE
Address range: 200 to 299
S 28th St
Length: 0.13 miles
Direction: N-S
Address range: 200 to 299
Direction: N-S
Address range: 200 to 299
Country Side Cir
Length: 0.05 miles
Direction: E-W
Address range: 2500 to 2599
Direction: E-W
Address range: 2500 to 2599