Julian (St.James) neighborhood in San Jose, California (CA), 95112 detailed profile
Settings
X


Business Search - 14 Million verified businesses
Area: 0.133 square miles
Population: 1,602
Population density:
| Julian (St.James): | 12,076 people per square mile |
| San Jose: | 5,554 people per square mile |

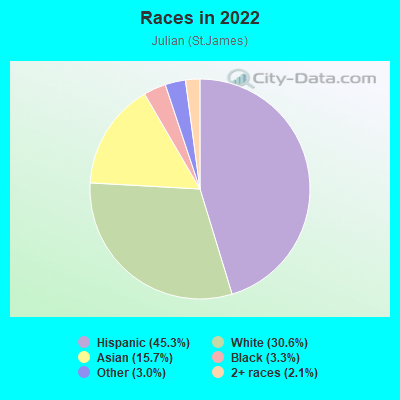
- 73945.3%Hispanic or Latino
- 50030.6%White
- 25615.7%Asian
- 543.3%Black
- 493.0%Some other race
- 342.1%Two or more races
Distribution of median household income
![Distribution of median household income]()
- 30Less than $10,000
- 10$10,000 to $19,999
- 136$20,000 to $29,999
- 63$30,000 to $39,999
- 76$40,000 to $49,999
- 90$50,000 to $59,999
- 48$60,000 to $74,999
- 31$75,000 to $99,999
- 41$100,000 to $124,999
- 71$125,000 to $149,999
- 57$150,000 to $199,999
- 116$200,000 or more

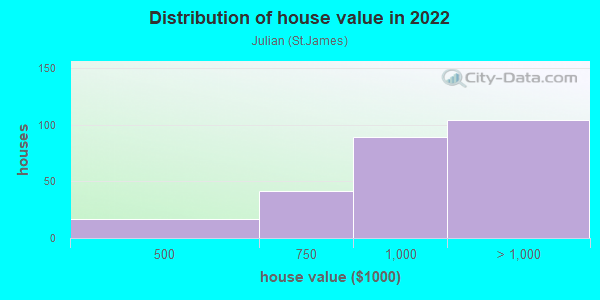
Distribution of owner-occupied house/condo value
![Distribution of owner-occupied house/condo value]()
- 17$400,000 to $499,999
- 41$500,000 to $749,999
- 89$750,000 to $999,999
- 104$1,000,000 or more
Distribution of rent paid by renters
![Distribution of rent paid by renters]()
- 38$300 to $399
- 17$600 to $699
- 11$800 to $899
- 58$1,000 to $1,249
- 96$1,250 to $1,499
- 54$1,500 to $1,999
- 146$2,000 or more

Median rent in 2022:
| Julian (St.James): | $1,909 |
| San Jose: | $2,001 |
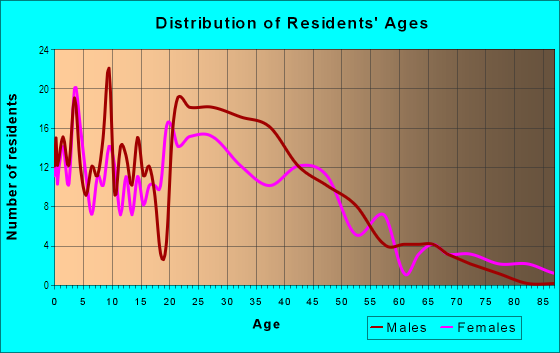
| Males: | 818 |
| Females: | 784 |
Males:
| This neighborhood: | 37.6 years |
| Whole city: | 37.6 years |
| This neighborhood: | 28.8 years |
| Whole city: | 39.1 years |
Average household size:
| Julian (St.James): | 2.9 people |
| San Jose: | 2.9 people |
Percentage of family households:
| Julian (St.James): | 39.2% |
| San Jose: | 49.9% |
| Here: | 35.8% |
| San Jose: | 53.0% |
Percentage of married-couple families with children (among all households):
| Julian (St.James): | 26.3% |
| San Jose: | 25.8% |
Percentage of single-mother households (among all households):
| Julian (St.James): | 10.3% |
| San Jose: | 5.2% |
Percentage of never married males 15 years old and over:
Percentage of never married females 15 years old and over:
| Julian (St.James): | 28.8% |
| San Jose: | 20.9% |
Percentage of never married females 15 years old and over:
| Julian (St.James): | 21.1% |
| city: | 16.7% |
Percentage of people that speak English not well or not at all:
| Julian (St.James): | 9.4% |
| San Jose: | 11.4% |
Percentage of people born in this state:
Percentage of people born in another U.S. state:
Percentage of native residents but born outside the U.S.:
Percentage of foreign born residents:
| Here: | 54.2% |
| San Jose: | 46.1% |
Percentage of people born in another U.S. state:
| Julian (St.James): | 16.5% |
| San Jose: | 10.4% |
Percentage of native residents but born outside the U.S.:
| Here: | 3.2% |
| city: | 1.7% |
Percentage of foreign born residents:
| Here: | 26.2% |
| San Jose: | 41.8% |
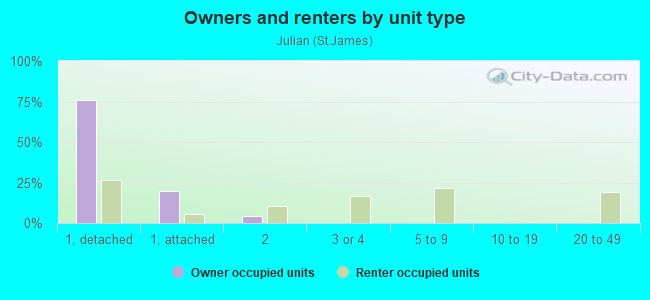
Owner-occupied
Renter-occupied

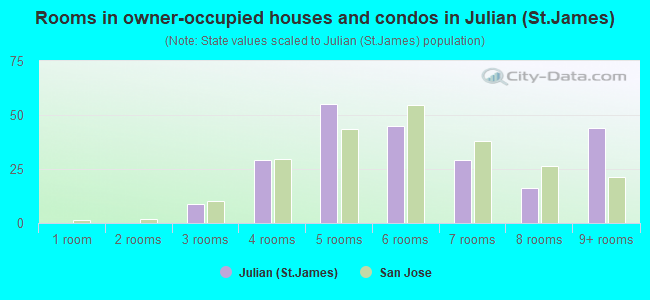
- Rooms in owner-occupied houses and condos in Julian <
> - 01 room
- 02 rooms
- 93 rooms
- 294 rooms
- 555 rooms
- 456 rooms
- 297 rooms
- 168 rooms
- 449+ rooms
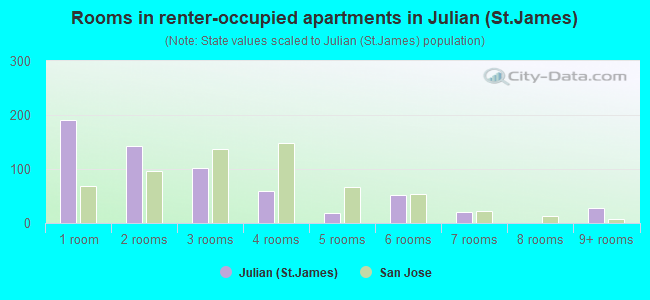
- Rooms in renter-occupied apartments in Julian <
> - 1911 room
- 1432 rooms
- 1013 rooms
- 604 rooms
- 195 rooms
- 526 rooms
- 217 rooms
- 08 rooms
- 279+ rooms
Owner-occupied
Renter-occupied
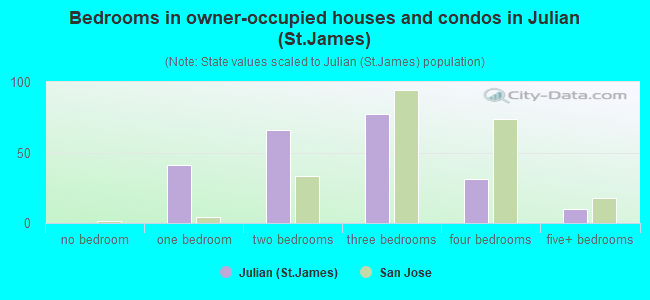
- Bedrooms in owner-occupied houses and condos in Julian <
> - 0no bedroom
- 411 bedroom
- 662 bedrooms
- 773 bedrooms
- 314 bedrooms
- 105+ bedrooms
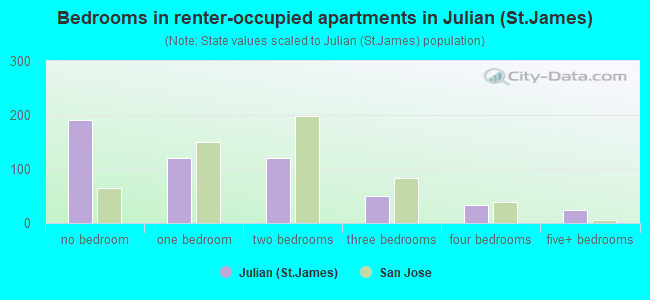
- Bedrooms in renter-occupied apartments in Julian <
> - 191no bedroom
- 1211 bedroom
- 1202 bedrooms
- 503 bedrooms
- 344 bedrooms
- 255+ bedrooms
Average number of cars or other vehicles available in houses/condos:
Average number of cars or other vehicles available in apartments:
| This neighborhood: | 2.4 |
| San Jose: | 2.3 |
Average number of cars or other vehicles available in apartments:
| Here: | 2.0 |
| city: | 1.6 |
Percentage of units with a mortgage:
| Julian (St.James): | 78.7% |
| San Jose: | 66.9% |
Average estimated value of detached houses in 2022 (56.1% of all units):
| Julian (St.James): | $1,148,591 |
| San Jose: | $1,532,815 |

- Year house built in Julian <
> - 212020 or later
- 472010 to 2019
- 182000 to 2009
- 681990 to 1999
- 01980 to 1989
- 531970 to 1979
- 601960 to 1969
- 411950 to 1959
- 681940 to 1949
- 2821939 or earlier
City-data.com crime index for city in 2020 (higher means more crime):
| City: | 268.4 |
| U.S. average: | 219.5 |
Travel time to work (commute)
![Travel time to work (commute)]()
- 235 to 9 minutes
- 6810 to 14 minutes
- 18915 to 19 minutes
- 14920 to 24 minutes
- 4825 to 29 minutes
- 7530 to 34 minutes
- 635 to 39 minutes
- 5640 to 44 minutes
- 6245 to 59 minutes
- 7560 to 89 minutes
- 2790 or more minutes

Means of transportation to work
![Means of transportation to work]()
- 65.4%612Drove a car alone
- 4.0%37Carpooled
- 8.8%82Bus
- 1.0%9Long-distance train or commuter rail
- 1.8%17Light rail, streetcar or trolley
- 1.1%10Motorcycle
- 5.2%49Bicycle
- 3.0%28Walked
- 1.4%13Other means
- 19.3%181Worked at home

Time leaving home to go to work
![Time leaving home to go to work]()
- 112:00 a.m. to 4:59 a.m.
- 375:00 a.m. to 5:29 a.m.
- 185:30 a.m. to 5:59 a.m.
- 286:00 a.m. to 6:29 a.m.
- 1356:30 a.m. to 6:59 a.m.
- 1047:00 a.m. to 7:29 a.m.
- 987:30 a.m. to 7:59 a.m.
- 708:00 a.m. to 8:29 a.m.
- 618:30 a.m. to 8:59 a.m.
- 789:00 a.m. to 9:59 a.m.
- 3910:00 a.m. to 10:59 a.m.
- 5612:00 p.m. to 3:59 p.m.
- 434:00 p.m. to 11:59 p.m.

Occupations of males:
- Percentage of males in management occupations (except farmers):
Here: 12.3% city: 13.0%
- Percentage of males in business and financial operations occupations:
Here: 3.2% city: 4.6%
- Percentage of males in computer and mathematical occupations:
Here: 14.3% city: 13.6%
- Percentage of males in architecture and engineering occupations:
Here: 6.7% city: 10.2%
- Percentage of males in community and social services occupations:
Here: 2.1% city: 0.8%
- Percentage of males in education, training, and library occupations:
Here: 6.4% city: 2.8%
- Percentage of males in arts, design, entertainment, sports, and media occupations:
Here: 6.0% city: 1.8%
- Percentage of males in service occupations:
Here: 10.8% city: 12.7%
- Percentage of males in sales and office occupations:
Here: 8.0% city: 12.8%
- Percentage of males in construction, extraction, and maintenance occupations:
Here: 8.0% city: 7.8%
- Percentage of males in production occupations:
Here: 3.6% city: 5.5%
- Percentage of males in transportation occupations:
Here: 2.7% city: 3.6%
- Percentage of males in material moving occupations:
Here: 12.0% city: 3.1%
Occupations of females:
- Percentage of females in management occupations (except farmers):
Here: 11.3% city: 11.0%
- Percentage of females in business and financial operations occupations:
Here: 1.1% city: 8.6%
- Percentage of females in computer and mathematical occupations:
Here: 5.4% city: 5.4%
- Percentage of females in life, physical, and social science occupations:
Here: 1.1% city: 1.7%
- Percentage of females in community and social services occupations:
Here: 6.7% city: 1.8%
- Percentage of females in education, training, and library occupations:
Here: 6.2% city: 8.1%
- Percentage of females in arts, design, entertainment, sports, and media occupations:
Here: 5.9% city: 2.0%
- Percentage of females in healthcare practitioners and technical occupations:
Here: 6.3% city: 6.8%
- Percentage of females in service occupations:
Here: 5.2% city: 21.7%
- Percentage of females in sales and office occupations:
Here: 35.4% city: 22.0%
- Percentage of females in farming, fishing, and forestry occupations:
Here: 9.3% city: 0.2%
- Percentage of females in production occupations:
Here: 2.1% city: 4.0%
- Percentage of females in material moving occupations:
Here: 3.4% city: 1.5%
Percentage of people 16-64 in Armed Forces:
| Julian (St.James): | 0.2% |
| San Jose: | 0.0% |
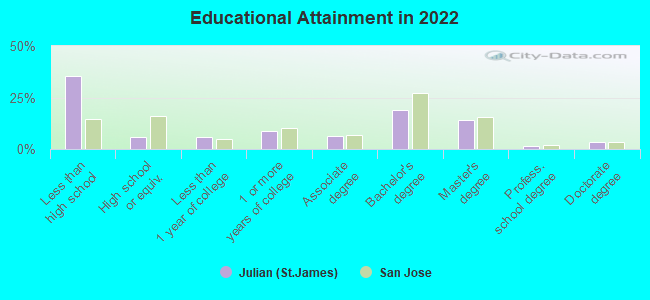
Education in this neighborhood (subdivision or community):
- Percentage of people 3 years and older in K-12 schools:
Julian (St.James): 22.1% San Jose: 16.1%
- Percentage of people 3 years and older in undergraduate colleges:
Julian (St.James): 14.0% San Jose: 6.5%
- Percentage of people 3 years and older in grad. or professional schools:
Julian (St.James): 3.7% San Jose: 2.0%
- Percentage of students K-12 enrolled in private schools:
Julian (St.James): 0.0% San Jose: 14.9%
Percentage of population below poverty level:
| Julian (St.James): | 13.3% |
| San Jose: | 9.0% |
Median year owner moved in (as recorded in 2022):
Median year renter moved in (as recorded in 2022):
| Julian (St.James): | 2003 |
| San Jose: | 2008 |
Median year renter moved in (as recorded in 2022):
| Julian (St.James): | 2016 |
| San Jose: | 2020 |
Percentage of married-couple families with both working:
| Julian (St.James): | 162.5% |
| San Jose: | 72.5% |

- 54.6%Utility gas
- 26.0%Electricity
- 11.2%Solar energy
- 4.2%No fuel used
- 2.1%Wood
- 1.9%Bottled, tank, or LP gas
Roads and streets:
E Saint James St
Length: 0.36 miles
Direction: SW-NE
Address range: 610 to 998
Direction: SW-NE
Address range: 610 to 998
E St John St
Length: 0.28 miles
Directions: N-S, SW-NE
Address range: 650 to 898
Directions: N-S, SW-NE
Address range: 650 to 898
N 14th St
Length: 0.25 miles
Direction: SE-NW
Address range: 1 to 199
Direction: SE-NW
Address range: 1 to 199
N 18th St
Length: 0.25 miles
Directions: N-S, SE-NW
Address range: 100 to 299
Directions: N-S, SE-NW
Address range: 100 to 299
E Julian St
Length: 0.24 miles
Directions: E-W, SW-NE
Address range: 850 to 997
Directions: E-W, SW-NE
Address range: 850 to 997
N 15th St
Length: 0.18 miles
Direction: SE-NW
Address range: 51 to 199
Direction: SE-NW
Address range: 51 to 199
N 19th St
Length: 0.18 miles
Direction: SE-NW
Address range: 100 to 299
Direction: SE-NW
Address range: 100 to 299
N 17th St
Length: 0.12 miles
Direction: SE-NW
Address range: 100 to 199
Direction: SE-NW
Address range: 100 to 199
N 16th St
Length: 0.12 miles
Direction: SE-NW
Address range: 100 to 199
Direction: SE-NW
Address range: 100 to 199
Roosevelt St
Length: 0.07 miles
Direction: SW-NE
Address range: 900 to 1000
Direction: SW-NE
Address range: 900 to 1000
N 20th St
Length: 0.06 miles
Directions: N-S, SE-NW
Address range: 100 to 299
Directions: N-S, SE-NW
Address range: 100 to 299
Other features:
Coyote Crk
Length: 0.25 miles
Directions: N-S, SE-NW, SW-NE
Directions: N-S, SE-NW, SW-NE