Juniper Point neighborhood in Salem, Massachusetts (MA), 01970 detailed profile
Settings
X


Business Search - 14 Million verified businesses
Area: 0.153 square miles
Population: 36
Population density:
| Juniper Point: | 235 people per square mile |
| Salem: | 5,496 people per square mile |

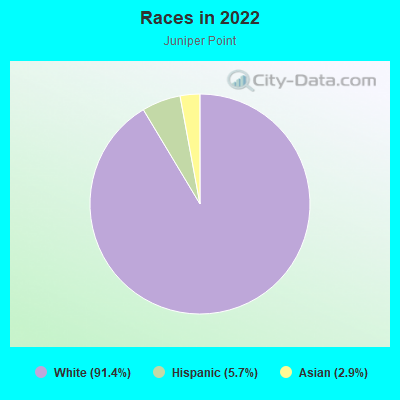
- 3291.4%White
- 25.7%Hispanic or Latino
- 12.9%Asian
Median household income in 2022:
| Juniper Point: | $82,072 |
| Salem: | $79,196 |
Distribution of median household income
![Distribution of median household income]()
- 1Less than $10,000
- 5$10,000 to $19,999
- 1$20,000 to $29,999
- 10$30,000 to $39,999
- 1$40,000 to $49,999
- 2$50,000 to $59,999
- 4$60,000 to $74,999
- 5$75,000 to $99,999
- 2$100,000 to $124,999
- 1$125,000 to $149,999
- 2$150,000 to $199,999
- 4$200,000 or more

Distribution of owner-occupied house/condo value
![Distribution of owner-occupied house/condo value]()
- 2$200,000 to $249,999
- 1$250,000 to $299,999
- 2$300,000 to $399,999
- 3$400,000 to $499,999
- 6$500,000 to $749,999
- 2$750,000 to $999,999
- 4$1,000,000 or more

Distribution of rent paid by renters
![Distribution of rent paid by renters]()
- 1$100 to $199
- 1$200 to $299
- 4$300 to $399
- 1$400 to $499
- 1$600 to $699
- 5$800 to $899
- 1$900 to $999
- 1$1,000 to $1,249
- 1$1,250 to $1,499
- 2$1,500 to $1,999
- 2$2,000 or more

Median rent in 2022:
| Juniper Point: | $1,371 |
| Salem: | $1,527 |
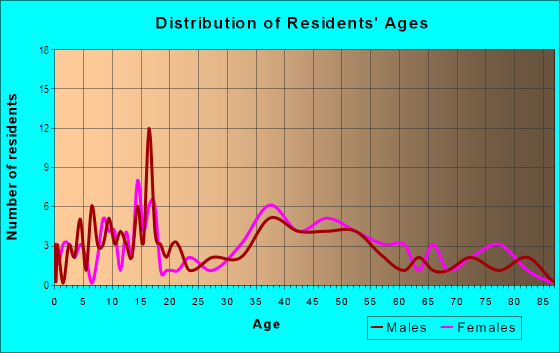
| Males: | 18 |
| Females: | 18 |
Males:
| This neighborhood: | 44.2 years |
| Whole city: | 36.3 years |
| This neighborhood: | 49.2 years |
| Whole city: | 40.1 years |
Average household size:
| Juniper Point: | 2.0 people |
| Salem: | 2.2 people |
Percentage of family households:
| Juniper Point: | 33.7% |
| Salem: | 38.9% |
| Here: | 46.5% |
| Salem: | 35.2% |
Percentage of married-couple families with children (among all households):
| Juniper Point: | 44.6% |
| Salem: | 26.9% |
Percentage of single-mother households (among all households):
| Juniper Point: | 3.0% |
| Salem: | 16.2% |
Percentage of never married males 15 years old and over:
Percentage of never married females 15 years old and over:
| Juniper Point: | 17.7% |
| Salem: | 19.3% |
Percentage of never married females 15 years old and over:
| Juniper Point: | 12.9% |
| city: | 24.8% |
Percentage of people that speak English not well or not at all:
| Juniper Point: | 8.6% |
| Salem: | 5.1% |
Percentage of people born in this state:
Percentage of people born in another U.S. state:
Percentage of native residents but born outside the U.S.:
Percentage of foreign born residents:
| Here: | 55.1% |
| Salem: | 61.2% |
Percentage of people born in another U.S. state:
| Juniper Point: | 31.2% |
| Salem: | 21.4% |
Percentage of native residents but born outside the U.S.:
| Here: | 1.5% |
| city: | 2.7% |
Percentage of foreign born residents:
| Here: | 12.2% |
| Salem: | 14.7% |
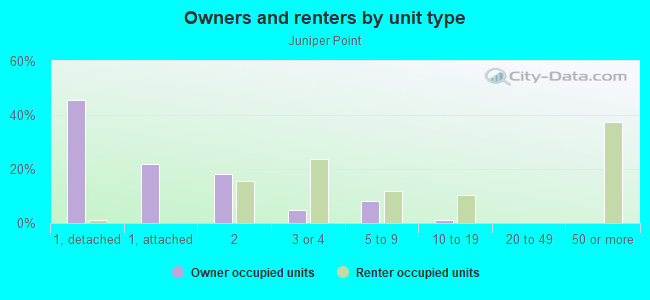
Owner-occupied
Renter-occupied

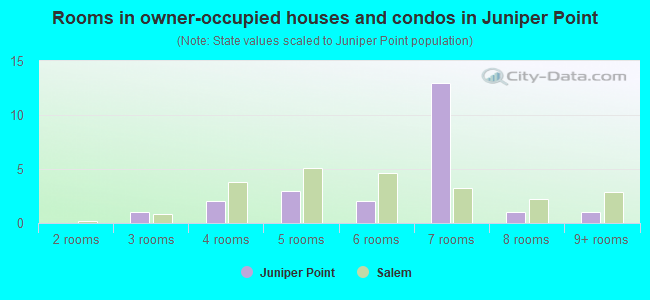
- Rooms in owner-occupied houses and condos in Juniper Point
- 01 room
- 02 rooms
- 13 rooms
- 24 rooms
- 35 rooms
- 26 rooms
- 137 rooms
- 18 rooms
- 19+ rooms
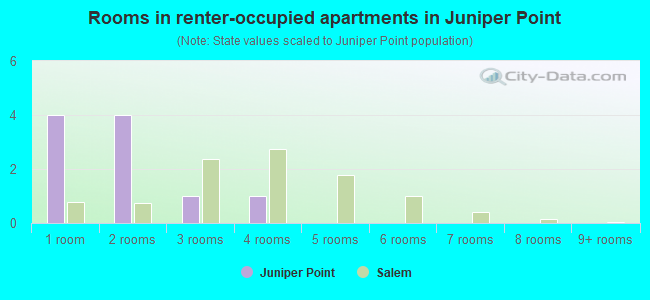
- Rooms in renter-occupied apartments in Juniper Point
- 41 room
- 42 rooms
- 13 rooms
- 14 rooms
- 05 rooms
- 06 rooms
- 07 rooms
- 08 rooms
- 09+ rooms
Owner-occupied
Renter-occupied
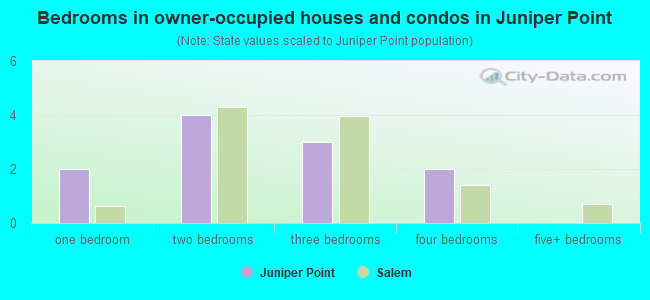
- Bedrooms in owner-occupied houses and condos in Juniper Point
- 0no bedroom
- 21 bedroom
- 42 bedrooms
- 33 bedrooms
- 24 bedrooms
- 05+ bedrooms
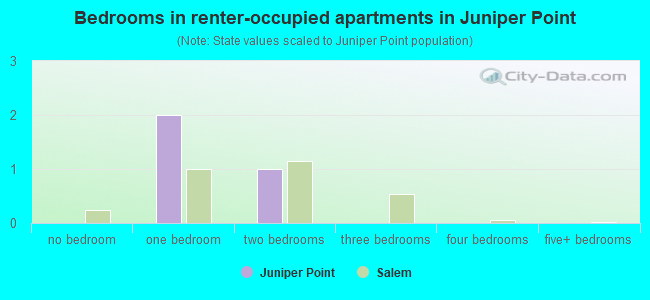
- Bedrooms in renter-occupied apartments in Juniper Point
- 0no bedroom
- 21 bedroom
- 12 bedrooms
- 03 bedrooms
- 04 bedrooms
- 05+ bedrooms
Average number of cars or other vehicles available in houses/condos:
Average number of cars or other vehicles available in apartments:
| This neighborhood: | 1.5 |
| Salem: | 1.6 |
Average number of cars or other vehicles available in apartments:
| Here: | 1.2 |
| city: | 1.0 |
Percentage of units with a mortgage:
| Juniper Point: | 68.8% |
| Salem: | 73.6% |
Housing prices:
- Average estimated value of detached houses in 2022 (42.1% of all units):
Juniper Point: $487,787 Massachusetts: $651,570
- Average estimated value of housing units in 2-unit structures in 2022 (26.3% of all units):
This neighborhood: $503,085 Massachusetts: $594,808
- Average estimated '22 value of housing units in 3-to-4-unit structures (10.5% of all units):
Juniper Point: $416,938 Massachusetts: $601,912
- Average estimated '22 value of housing units in 5-or-more-unit structures (15.8% of all units):
Juniper Point: $337,837 Massachusetts: $555,768
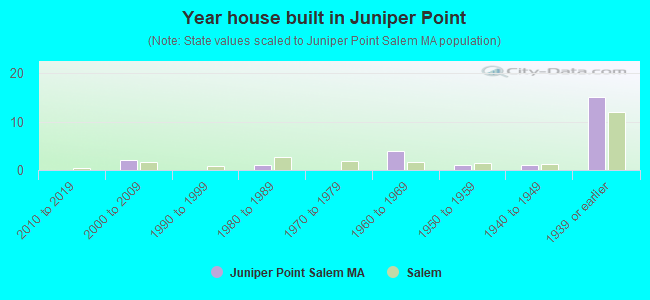
- Year house built in Juniper Point
- 02020 or later
- 02010 to 2019
- 22000 to 2009
- 01990 to 1999
- 11980 to 1989
- 01970 to 1979
- 41960 to 1969
- 11950 to 1959
- 11940 to 1949
- 151939 or earlier
City-data.com crime index for city in 2020 (higher means more crime):
| City: | 147.2 |
| U.S. average: | 219.5 |
Travel time to work (commute)
![Travel time to work (commute)]()
- 25 to 9 minutes
- 310 to 14 minutes
- 315 to 19 minutes
- 220 to 24 minutes
- 135 to 39 minutes
- 245 to 59 minutes
- 460 to 89 minutes

Means of transportation to work
![Means of transportation to work]()
- 44.1%9Drove a car alone
- 4.9%1Carpooled
- 4.9%1Subway or elevated rail
- 9.8%2Walked
- 19.6%4Worked at home

Time leaving home to go to work
![Time leaving home to go to work]()
- 26:30 a.m. to 6:59 a.m.
- 37:00 a.m. to 7:29 a.m.
- 37:30 a.m. to 7:59 a.m.
- 38:00 a.m. to 8:29 a.m.
- 18:30 a.m. to 8:59 a.m.
- 29:00 a.m. to 9:59 a.m.
- 112:00 p.m. to 3:59 p.m.
- 14:00 p.m. to 11:59 p.m.

Occupations of males:
- Percentage of males in management occupations (except farmers):
Here: 13.6% city: 13.6%
- Percentage of males in business and financial operations occupations:
Here: 12.4% city: 9.0%
- Percentage of males in computer and mathematical occupations:
Here: 13.7% city: 5.8%
- Percentage of males in architecture and engineering occupations:
Here: 1.6% city: 2.5%
- Percentage of males in life, physical, and social science occupations:
Here: 1.3% city: 1.2%
- Percentage of males in community and social services occupations:
Here: 1.8% city: 1.6%
- Percentage of males in education, training, and library occupations:
Here: 11.6% city: 7.0%
- Percentage of males in arts, design, entertainment, sports, and media occupations:
Here: 6.4% city: 2.0%
- Percentage of males in service occupations:
Here: 9.8% city: 15.1%
- Percentage of males in sales and office occupations:
Here: 18.1% city: 15.8%
- Percentage of males in farming, fishing, and forestry occupations:
Here: 2.1% city: 0.1%
- Percentage of males in construction, extraction, and maintenance occupations:
Here: 1.5% city: 4.9%
- Percentage of males in transportation occupations:
Here: 5.2% city: 5.9%
- Percentage of males in material moving occupations:
Here: 5.4% city: 4.1%
Occupations of females:
- Percentage of females in management occupations (except farmers):
Here: 17.2% city: 12.1%
- Percentage of females in business and financial operations occupations:
Here: 4.3% city: 7.6%
- Percentage of females in architecture and engineering occupations:
Here: 1.7% city: 0.7%
- Percentage of females in community and social services occupations:
Here: 2.7% city: 2.9%
- Percentage of females in legal occupations:
Here: 2.1% city: 1.4%
- Percentage of females in education, training, and library occupations:
Here: 12.8% city: 10.4%
- Percentage of females in arts, design, entertainment, sports, and media occupations:
Here: 2.7% city: 2.7%
- Percentage of females in healthcare practitioners and technical occupations:
Here: 11.1% city: 7.4%
- Percentage of females in service occupations:
Here: 10.7% city: 21.0%
- Percentage of females in sales and office occupations:
Here: 28.2% city: 25.7%
- Percentage of females in production occupations:
Here: 7.4% city: 3.1%
- Percentage of females in material moving occupations:
Here: 1.7% city: 0.7%
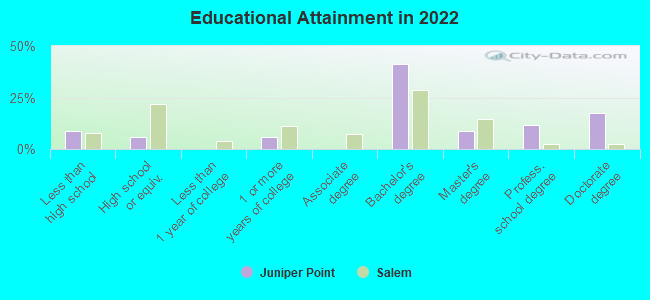
Education in this neighborhood (subdivision or community):
- Percentage of people 3 years and older in K-12 schools:
Juniper Point: 77.8% Salem: 10.1%
- Percentage of people 3 years and older in undergraduate colleges:
Juniper Point: 13.9% Salem: 7.7%
- Percentage of people 3 years and older in grad. or professional schools:
Juniper Point: 0.0% Salem: 1.7%
- Percentage of students K-12 enrolled in private schools:
Juniper Point: 7.1% Salem: 13.9%
Percentage of population below poverty level:
| Juniper Point: | 12.8% |
| Salem: | 13.7% |
Median year owner moved in (as recorded in 2022):
Median year renter moved in (as recorded in 2022):
| Juniper Point: | 2006 |
| Salem: | 2010 |
Median year renter moved in (as recorded in 2022):
| Juniper Point: | 2018 |
| Salem: | 2015 |
Percentage of married-couple families with both working:
| Juniper Point: | 262.5% |
| Salem: | 78.5% |
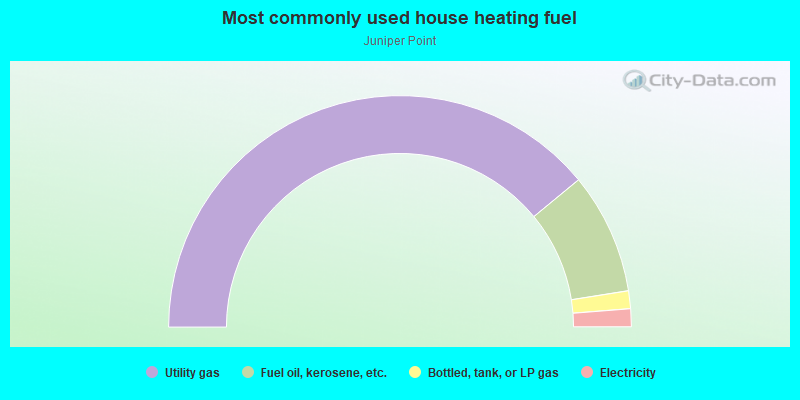
- 78.0%Utility gas
- 16.9%Fuel oil, kerosene, etc.
- 2.5%Bottled, tank, or LP gas
- 2.5%Electricity
Roads and streets:
Columbus Ave
Length: 0.42 miles
Directions: E-W, SW-NE
Address range: 13 to 132
Directions: E-W, SW-NE
Address range: 13 to 132
Bay View Ave
Length: 0.35 miles
Directions: E-W, SE-NW, SW-NE
Address range: 1 to 152
Directions: E-W, SE-NW, SW-NE
Address range: 1 to 152
Fort Ave
Length: 0.24 miles
Direction: SW-NE
Address range: 140 to 299
Direction: SW-NE
Address range: 140 to 299
Sutton Ave
Length: 0.18 miles
Directions: E-W, SW-NE
Address range: 1 to 27
Directions: E-W, SW-NE
Address range: 1 to 27
Beach Ave
Length: 0.17 miles
Direction: SE-NW
Address range: 1 to 99
Direction: SE-NW
Address range: 1 to 99
Juniper Ave
Length: 0.15 miles
Directions: E-W, SW-NE
Address range: 1 to 99
Directions: E-W, SW-NE
Address range: 1 to 99
Restaurant Row
Length: 0.14 miles
Directions: E-W, SE-NW, SW-NE
Address range: 51 to 99
Directions: E-W, SE-NW, SW-NE
Address range: 51 to 99
Cheval Ave
Length: 0.13 miles
Directions: E-W, SW-NE
Address range: 3 to 36
Directions: E-W, SW-NE
Address range: 3 to 36
High Ave
Length: 0.10 miles
Directions: E-W, SE-NW, SW-NE
Address range: 1 to 99
Directions: E-W, SE-NW, SW-NE
Address range: 1 to 99
Cross Ave
Length: 0.08 miles
Direction: SE-NW
Address range: 2 to 99
Direction: SE-NW
Address range: 2 to 99
Star Ave
Length: 0.08 miles
Directions: E-W, SE-NW
Address range: 1 to 99
Directions: E-W, SE-NW
Address range: 1 to 99
Lowell St
Length: 0.07 miles
Directions: E-W, SE-NW
Address range: 1 to 99
Directions: E-W, SE-NW
Address range: 1 to 99
Dustin St
Length: 0.06 miles
Direction: SE-NW
Address range: 1 to 99
Direction: SE-NW
Address range: 1 to 99
Island Ave
Length: 0.04 miles
Direction: SE-NW
Address range: 1 to 99
Direction: SE-NW
Address range: 1 to 99
Hosmer Ave
Length: 0.03 miles
Direction: SE-NW
Address range: 1 to 99
Direction: SE-NW
Address range: 1 to 99