Kendrick Farms (Kendrick Sub.) neighborhood in Mount Clemens, Michigan (MI), 48043 detailed profile
Settings
X


Business Search - 14 Million verified businesses
Area: 0.206 square miles
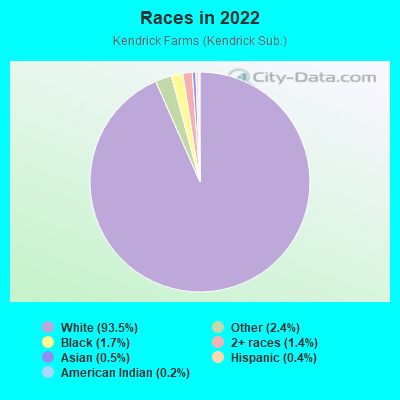
Population: 819
Population density:
| Kendrick Farms (Kendrick Sub.): | 3,982 people per square mile |
| Mount Clemens: | 3,720 people per square mile |

- 78993.5%White
- 202.4%Some other race
- 141.7%Black
- 121.4%Two or more races
- 40.5%Asian
- 30.4%Hispanic or Latino
- 20.2%American Indian
Median household income in 2022:
| Kendrick Farms (Kendrick Sub.): | $52,934 |
| Mount Clemens: | $55,154 |
Distribution of median household income
![Distribution of median household income]()
- 16Less than $10,000
- 33$10,000 to $19,999
- 24$20,000 to $29,999
- 22$30,000 to $39,999
- 41$40,000 to $49,999
- 13$50,000 to $59,999
- 32$60,000 to $74,999
- 68$75,000 to $99,999
- 67$100,000 to $124,999
- 19$125,000 to $149,999
- 6$150,000 to $199,999
- 14$200,000 or more

Distribution of owner-occupied house/condo value
![Distribution of owner-occupied house/condo value]()
- 75Less than $50,000
- 113$50,000 to $99,999
- 51$100,000 to $149,999
- 67$150,000 to $199,999
- 26$200,000 to $249,999
- 49$250,000 to $299,999
- 2$300,000 to $399,999
- 5$400,000 to $499,999
- 8$500,000 to $749,999
- 8$750,000 to $999,999
- 1$1,000,000 or more

Distribution of rent paid by renters
![Distribution of rent paid by renters]()
- 5Less than $100
- 8$100 to $199
- 10$200 to $299
- 13$300 to $399
- 33$400 to $499
- 17$500 to $599
- 147$600 to $699
- 31$700 to $799
- 22$800 to $899
- 16$900 to $999
- 58$1,000 to $1,249
- 8$1,250 to $1,499
- 4$1,500 to $1,999

Median rent in 2022:
| Kendrick Farms (Kendrick Sub.): | $1,144 |
| Mount Clemens: | $791 |
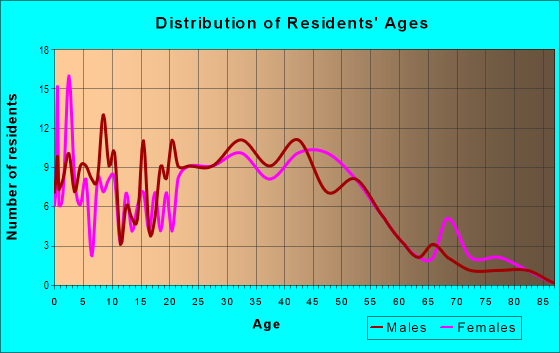
| Males: | 524 |
| Females: | 295 |
Males:
| This neighborhood: | 39.4 years |
| Whole city: | 37.9 years |
| This neighborhood: | 36.6 years |
| Whole city: | 41.8 years |
Average household size:
| Kendrick Farms (Kendrick Sub.): | 9.5 people |
| Mount Clemens: | 2.2 people |
Percentage of family households:
| Kendrick Farms (Kendrick Sub.): | 53.6% |
| Mount Clemens: | 42.3% |
| Here: | 30.7% |
| Mount Clemens: | 32.2% |
Percentage of married-couple families with children (among all households):
| Kendrick Farms (Kendrick Sub.): | 11.2% |
| Mount Clemens: | 24.0% |
Percentage of single-mother households (among all households):
| Kendrick Farms (Kendrick Sub.): | 12.5% |
| Mount Clemens: | 12.8% |
Percentage of never married males 15 years old and over:
Percentage of never married females 15 years old and over:
| Kendrick Farms (Kendrick Sub.): | 31.4% |
| Mount Clemens: | 21.2% |
Percentage of never married females 15 years old and over:
| Kendrick Farms (Kendrick Sub.): | 11.3% |
| city: | 17.5% |
Percentage of people that speak English not well or not at all:
| Kendrick Farms (Kendrick Sub.): | 0.0% |
| Mount Clemens: | 0.3% |
Percentage of people born in this state:
Percentage of people born in another U.S. state:
Percentage of native residents but born outside the U.S.:
Percentage of foreign born residents:
| Here: | 87.2% |
| Mount Clemens: | 82.8% |
Percentage of people born in another U.S. state:
| Kendrick Farms (Kendrick Sub.): | 11.0% |
| Mount Clemens: | 15.1% |
Percentage of native residents but born outside the U.S.:
| Here: | 0.2% |
| city: | 0.2% |
Percentage of foreign born residents:
| Here: | 1.9% |
| Mount Clemens: | 1.8% |
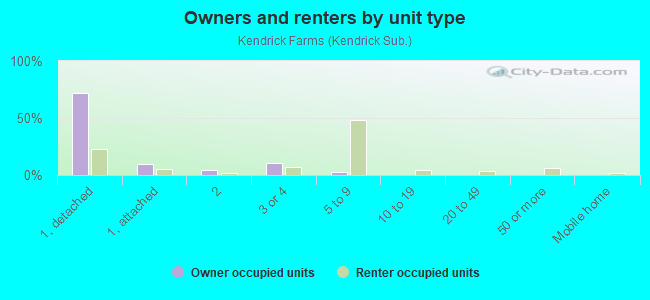
Owner-occupied
Renter-occupied

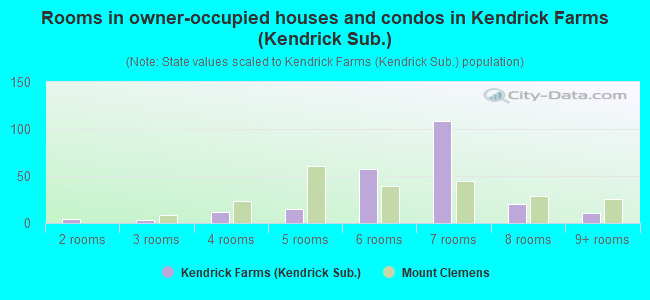
- Rooms in owner-occupied houses and condos in Kendrick Farms <
> - 01 room
- 42 rooms
- 33 rooms
- 124 rooms
- 155 rooms
- 576 rooms
- 1097 rooms
- 208 rooms
- 119+ rooms
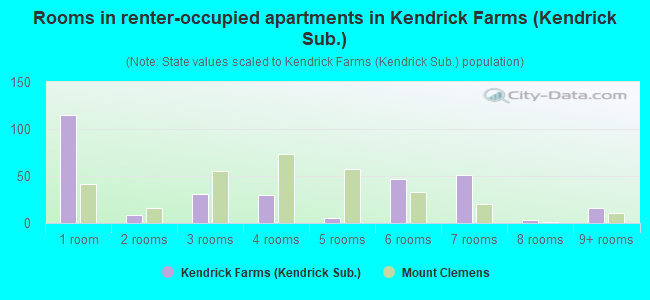
- Rooms in renter-occupied apartments in Kendrick Farms <
> - 1151 room
- 92 rooms
- 313 rooms
- 304 rooms
- 55 rooms
- 476 rooms
- 517 rooms
- 38 rooms
- 169+ rooms
Owner-occupied
Renter-occupied
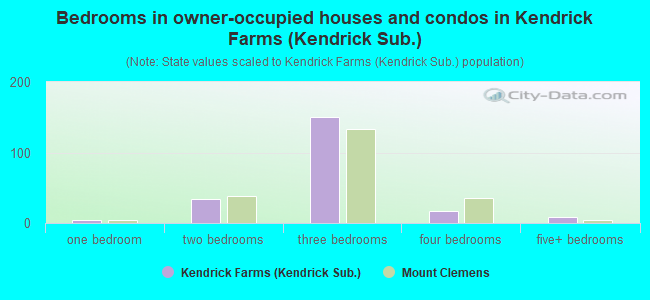
- Bedrooms in owner-occupied houses and condos in Kendrick Farms <
> - 0no bedroom
- 41 bedroom
- 342 bedrooms
- 1513 bedrooms
- 174 bedrooms
- 95+ bedrooms
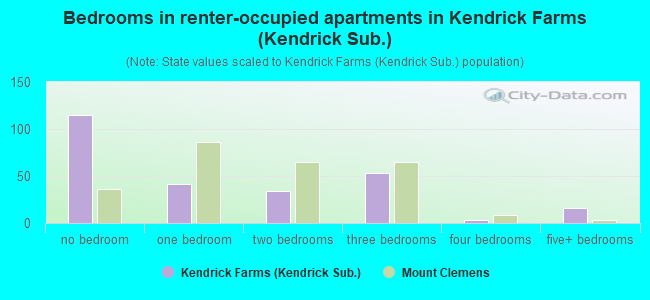
- Bedrooms in renter-occupied apartments in Kendrick Farms <
> - 115no bedroom
- 411 bedroom
- 342 bedrooms
- 533 bedrooms
- 34 bedrooms
- 165+ bedrooms
Average number of cars or other vehicles available in houses/condos:
Average number of cars or other vehicles available in apartments:
| This neighborhood: | 1.8 |
| Mount Clemens: | 1.9 |
Average number of cars or other vehicles available in apartments:
| Here: | 2.1 |
| city: | 1.1 |
Percentage of units with a mortgage:
| Kendrick Farms (Kendrick Sub.): | 73.6% |
| Mount Clemens: | 60.6% |
Average estimated value of detached houses in 2022 (89.1% of all units):
| Kendrick Farms (Kendrick Sub.): | $143,330 |
| Michigan: | $280,038 |
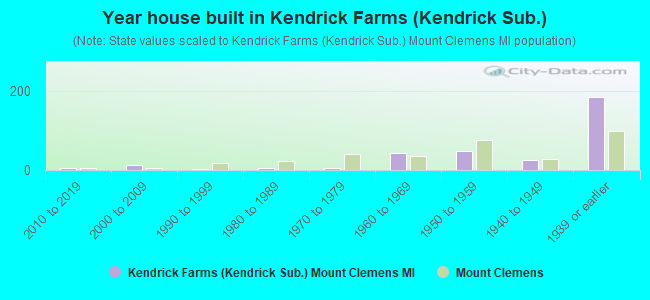
- Year house built in Kendrick Farms <
> - 02020 or later
- 52010 to 2019
- 122000 to 2009
- 31990 to 1999
- 51980 to 1989
- 51970 to 1979
- 431960 to 1969
- 481950 to 1959
- 241940 to 1949
- 1831939 or earlier
Travel time to work (commute)
![Travel time to work (commute)]()
- 26Less than 5 minutes
- 335 to 9 minutes
- 7810 to 14 minutes
- 12615 to 19 minutes
- 8220 to 24 minutes
- 4825 to 29 minutes
- 12130 to 34 minutes
- 1535 to 39 minutes
- 2940 to 44 minutes
- 5545 to 59 minutes
- 760 to 89 minutes
- 290 or more minutes

Means of transportation to work
![Means of transportation to work]()
- 84.6%396Drove a car alone
- 13.5%63Carpooled
- 2.6%12Bus
- 1.9%9Motorcycle
- 4.7%22Walked
- 0.2%1Other means
- 1.5%7Worked at home

Time leaving home to go to work
![Time leaving home to go to work]()
- 3912:00 a.m. to 4:59 a.m.
- 355:00 a.m. to 5:29 a.m.
- 455:30 a.m. to 5:59 a.m.
- 616:00 a.m. to 6:29 a.m.
- 1046:30 a.m. to 6:59 a.m.
- 497:00 a.m. to 7:29 a.m.
- 477:30 a.m. to 7:59 a.m.
- 468:00 a.m. to 8:29 a.m.
- 238:30 a.m. to 8:59 a.m.
- 249:00 a.m. to 9:59 a.m.
- 710:00 a.m. to 10:59 a.m.
- 1611:00 a.m. to 11:59 a.m.
- 5912:00 p.m. to 3:59 p.m.
- 854:00 p.m. to 11:59 p.m.

Occupations of males:
- Percentage of males in management occupations (except farmers):
Here: 3.1% city: 7.0%
- Percentage of males in computer and mathematical occupations:
Here: 3.4% city: 1.6%
- Percentage of males in community and social services occupations:
Here: 3.7% city: 1.1%
- Percentage of males in service occupations:
Here: 12.2% city: 18.2%
- Percentage of males in sales and office occupations:
Here: 4.5% city: 12.0%
- Percentage of males in construction, extraction, and maintenance occupations:
Here: 11.5% city: 7.8%
- Percentage of males in production occupations:
Here: 44.3% city: 21.8%
- Percentage of males in transportation occupations:
Here: 12.9% city: 7.1%
- Percentage of males in material moving occupations:
Here: 1.4% city: 7.2%
Occupations of females:
- Percentage of females in management occupations (except farmers):
Here: 9.6% city: 10.2%
- Percentage of females in business and financial operations occupations:
Here: 2.6% city: 5.5%
- Percentage of females in education, training, and library occupations:
Here: 28.5% city: 5.8%
- Percentage of females in service occupations:
Here: 18.2% city: 27.2%
- Percentage of females in sales and office occupations:
Here: 20.6% city: 24.5%
- Percentage of females in construction, extraction, and maintenance occupations:
Here: 15.8% city: 0.9%
- Percentage of females in material moving occupations:
Here: 4.1% city: 6.5%
Percentage of people 16-64 in Armed Forces:
| Kendrick Farms (Kendrick Sub.): | 1.5% |
| Mount Clemens: | 0.7% |
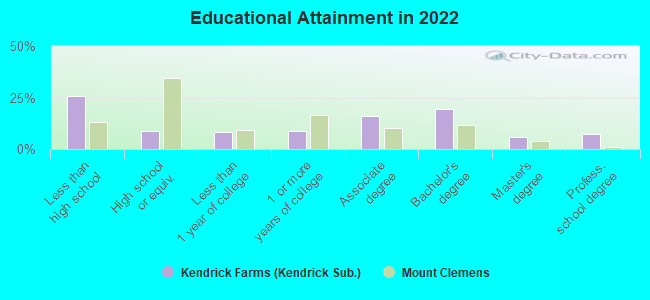
Education in this neighborhood (subdivision or community):
- Percentage of people 3 years and older in K-12 schools:
Kendrick Farms (Kendrick Sub.): 17.4% Mount Clemens: 14.0%
- Percentage of people 3 years and older in undergraduate colleges:
Kendrick Farms (Kendrick Sub.): 3.2% Mount Clemens: 4.4%
- Percentage of people 3 years and older in grad. or professional schools:
Kendrick Farms (Kendrick Sub.): 5.6% Mount Clemens: 1.1%
- Percentage of students K-12 enrolled in private schools:
Kendrick Farms (Kendrick Sub.): 0.0% Mount Clemens: 7.5%
Percentage of population below poverty level:
| Kendrick Farms (Kendrick Sub.): | 19.2% |
| Mount Clemens: | 16.8% |
Median year owner moved in (as recorded in 2022):
| Kendrick Farms (Kendrick Sub.): | 2008 |
| Mount Clemens: | 2006 |
Percentage of married-couple families with both working:
| Kendrick Farms (Kendrick Sub.): | 108.5% |
| Mount Clemens: | 74.4% |
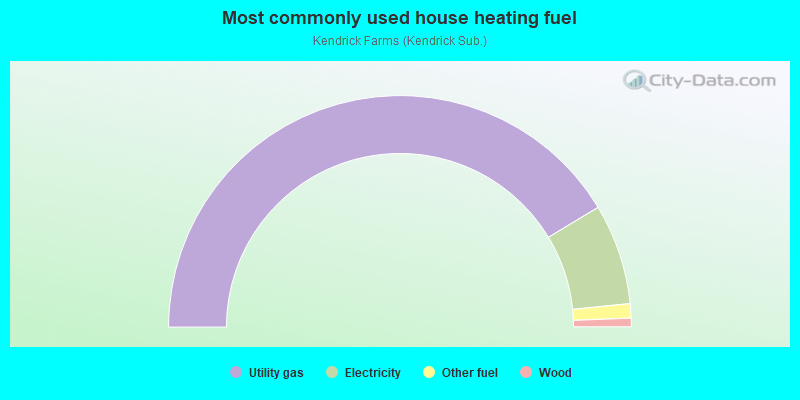
- 82.7%Utility gas
- 14.1%Electricity
- 2.0%Other fuel
- 1.2%Wood
Roads and streets:
Madison Ave
Length: 0.69 miles
Directions: N-S, SW-NE
Address range: 52 to 299
Directions: N-S, SW-NE
Address range: 52 to 299
Hubbard St
Length: 0.61 miles
Direction: E-W
Address range: 7 to 141
Direction: E-W
Address range: 7 to 141
North Ave
Length: 0.55 miles
Direction: N-S
Address range: 120 to 299
Direction: N-S
Address range: 120 to 299
Parkview St
Length: 0.35 miles
Direction: E-W
Address range: 1 to 199
Direction: E-W
Address range: 1 to 199
Gallup St
Length: 0.35 miles
Direction: E-W
Address range: 115 to 299
Direction: E-W
Address range: 115 to 299
Jones St
Length: 0.35 miles
Direction: E-W
Address range: 240 to 399
Direction: E-W
Address range: 240 to 399
Kendrick St
Length: 0.35 miles
Direction: E-W
Address range: 1 to 199
Direction: E-W
Address range: 1 to 199
Lafayette St
Length: 0.32 miles
Direction: E-W
Address range: 1 to 99
Direction: E-W
Address range: 1 to 99
Yeamans St
Length: 0.26 miles
Direction: E-W
Address range: 1 to 99
Direction: E-W
Address range: 1 to 99
Englewood St
Length: 0.26 miles
Direction: E-W
Address range: 1 to 99
Direction: E-W
Address range: 1 to 99
Leonore Ave
Length: 0.26 miles
Direction: E-W
Address range: 1 to 99
Direction: E-W
Address range: 1 to 99
Washington St
Length: 0.24 miles
Direction: N-S
Address range: 113 to 299
Direction: N-S
Address range: 113 to 299
Grove Park St
Length: 0.22 miles
Directions: N-S, SE-NW
Address range: 59 to 199
Directions: N-S, SE-NW
Address range: 59 to 199
Elizabeth St
Length: 0.21 miles
Direction: SE-NW
Address range: 100 to 299
Direction: SE-NW
Address range: 100 to 299
Dorothea Ave
Length: 0.20 miles
Direction: SE-NW
Address range: 1 to 99
Direction: SE-NW
Address range: 1 to 99
Eldredge St
Length: 0.08 miles
Direction: N-S
Address range: 101 to 199
Direction: N-S
Address range: 101 to 199
May St
Length: 0.06 miles
Directions: N-S, SW-NE
Address range: 1 to 99
Directions: N-S, SW-NE
Address range: 1 to 99
Parkview Ave
Length: 0.04 miles
Direction: E-W
Direction: E-W
Railroad features:
Conrail RR
Length: 0.82 miles
Direction: SW-NE
Direction: SW-NE