Kenwood neighborhood in Topeka, Kansas (KS), 66606 detailed profile
Settings
X

Business Search - 14 Million verified businesses
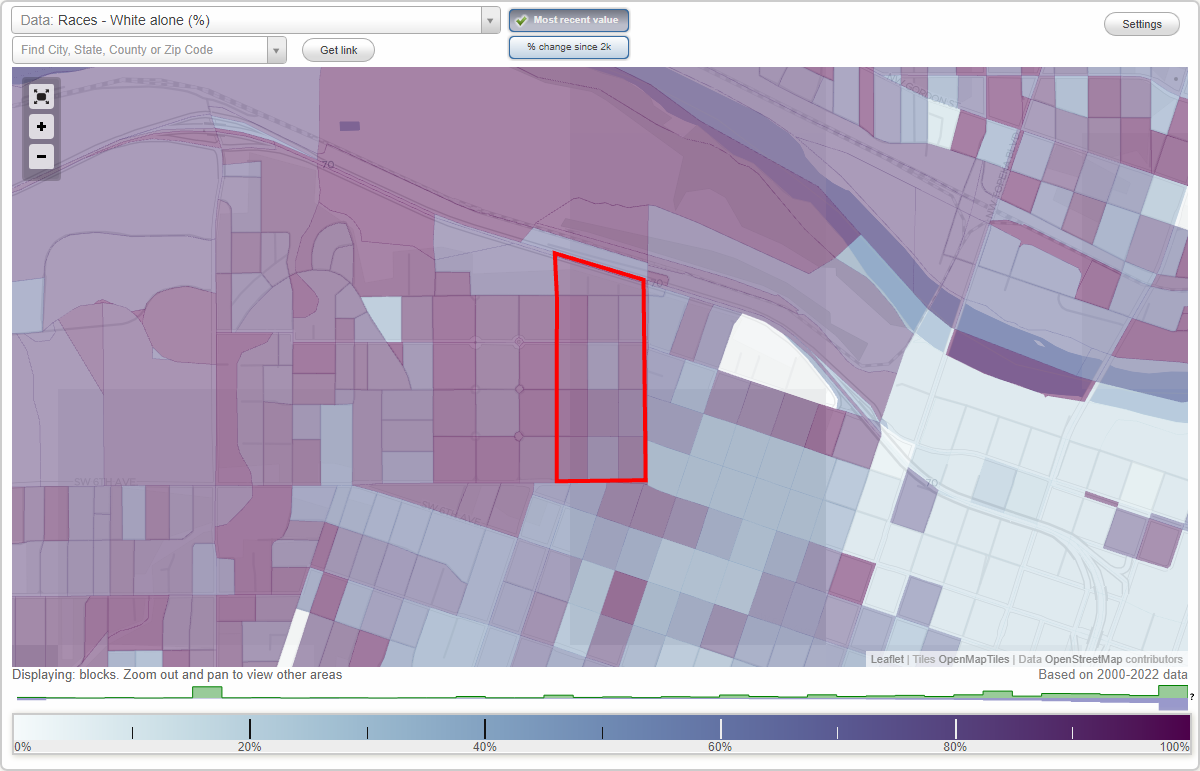
Area: 0.100 square miles
Population: 449
Population density:
| Kenwood: | 4,507 people per square mile |
| Topeka: | 2,240 people per square mile |

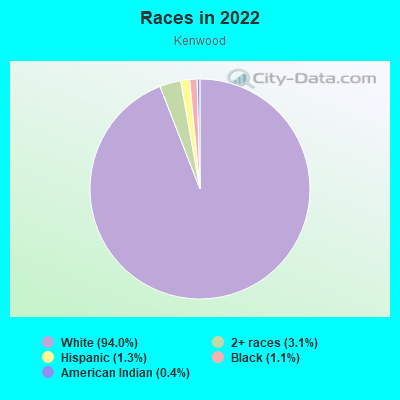
- 42294.0%White
- 143.1%Two or more races
- 61.3%Hispanic or Latino
- 51.1%Black
- 20.4%American Indian
Median household income in 2022:
| Kenwood: | $72,492 |
| Topeka: | $50,709 |
Distribution of median household income
![Distribution of median household income]()
- 4Less than $10,000
- 23$10,000 to $19,999
- 9$20,000 to $29,999
- 3$30,000 to $39,999
- 20$40,000 to $49,999
- 4$50,000 to $59,999
- 20$60,000 to $74,999
- 16$75,000 to $99,999
- 29$100,000 to $124,999
- 28$125,000 to $149,999
- 7$150,000 to $199,999
- 28$200,000 or more

Distribution of owner-occupied house/condo value
![Distribution of owner-occupied house/condo value]()
- 9Less than $50,000
- 36$50,000 to $99,999
- 36$100,000 to $149,999
- 32$150,000 to $199,999
- 15$200,000 to $249,999
- 20$250,000 to $299,999
- 15$400,000 to $499,999
- 1$500,000 to $749,999

Distribution of rent paid by renters
![Distribution of rent paid by renters]()
- 10$100 to $199
- 3$200 to $299
- 11$400 to $499
- 2$500 to $599
- 11$600 to $699
- 22$700 to $799
- 2$800 to $899
- 6$900 to $999

Median rent in 2022:
| Kenwood: | $719 |
| Topeka: | $670 |
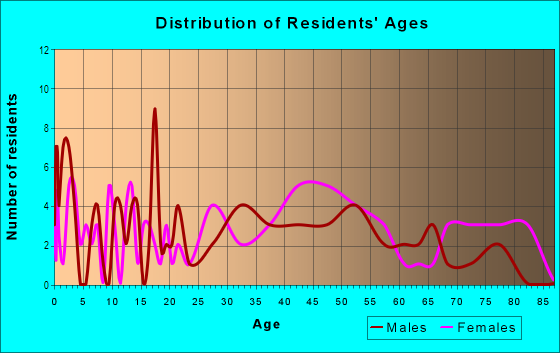
| Males: | 181 |
| Females: | 268 |
Males:
| This neighborhood: | 36.2 years |
| Whole city: | 37.1 years |
| This neighborhood: | 33.4 years |
| Whole city: | 38.8 years |
Average household size:
| Kenwood: | 2.5 people |
| Topeka: | 2.2 people |
Percentage of family households:
| Kenwood: | 60.7% |
| Topeka: | 38.2% |
| Here: | 60.5% |
| Topeka: | 35.2% |
Percentage of married-couple families with children (among all households):
| Kenwood: | 25.9% |
| Topeka: | 27.5% |
Percentage of single-mother households (among all households):
| Kenwood: | 10.7% |
| Topeka: | 10.7% |
Percentage of never married males 15 years old and over:
Percentage of never married females 15 years old and over:
| Kenwood: | 13.7% |
| Topeka: | 19.2% |
Percentage of never married females 15 years old and over:
| Kenwood: | 14.7% |
| city: | 17.5% |
Percentage of people that speak English not well or not at all:
| Kenwood: | 0.0% |
| Topeka: | 2.2% |
Percentage of people born in this state:
Percentage of people born in another U.S. state:
Percentage of native residents but born outside the U.S.:
Percentage of foreign born residents:
| Here: | 79.1% |
| Topeka: | 67.1% |
Percentage of people born in another U.S. state:
| Kenwood: | 20.9% |
| Topeka: | 25.0% |
Percentage of native residents but born outside the U.S.:
| Here: | 0.0% |
| city: | 1.7% |
Percentage of foreign born residents:
| Here: | 0.0% |
| Topeka: | 6.3% |
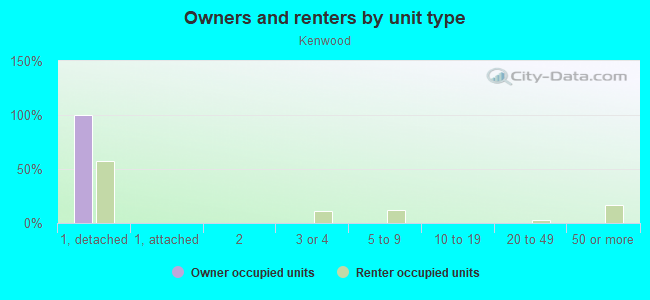
Owner-occupied
Renter-occupied

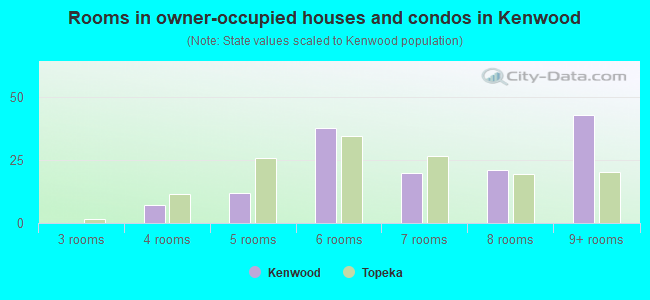
- Rooms in owner-occupied houses and condos in Kenwood
- 01 room
- 02 rooms
- 03 rooms
- 74 rooms
- 125 rooms
- 386 rooms
- 207 rooms
- 218 rooms
- 439+ rooms
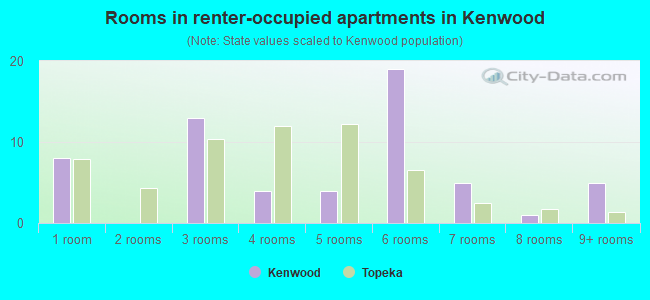
- Rooms in renter-occupied apartments in Kenwood
- 81 room
- 02 rooms
- 133 rooms
- 44 rooms
- 45 rooms
- 196 rooms
- 57 rooms
- 18 rooms
- 59+ rooms
Owner-occupied
Renter-occupied
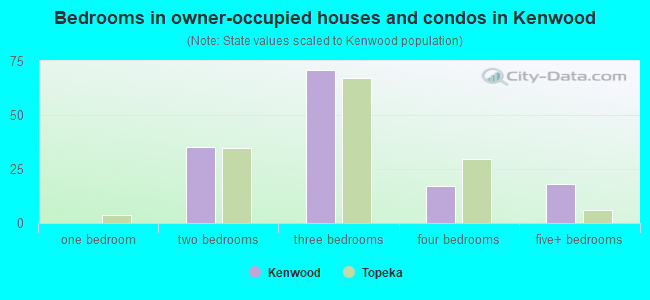
- Bedrooms in owner-occupied houses and condos in Kenwood
- 0no bedroom
- 01 bedroom
- 352 bedrooms
- 713 bedrooms
- 174 bedrooms
- 185+ bedrooms
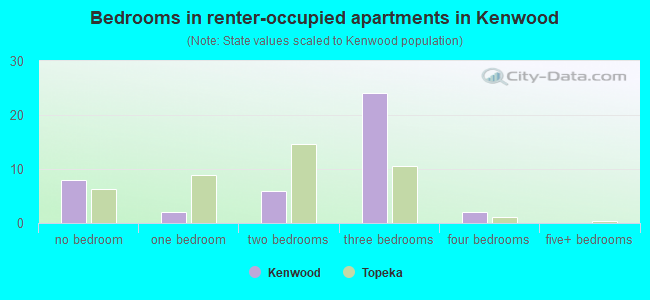
- Bedrooms in renter-occupied apartments in Kenwood
- 8no bedroom
- 21 bedroom
- 62 bedrooms
- 243 bedrooms
- 24 bedrooms
- 05+ bedrooms
Average number of cars or other vehicles available in houses/condos:
Average number of cars or other vehicles available in apartments:
| This neighborhood: | 2.2 |
| Topeka: | 1.9 |
Average number of cars or other vehicles available in apartments:
| Here: | 1.8 |
| city: | 1.2 |
Percentage of units with a mortgage:
| Kenwood: | 67.8% |
| Topeka: | 54.9% |
Average estimated value of detached houses in 2022 (98.8% of all units):
| Kenwood: | $173,288 |
| Kansas: | $264,181 |
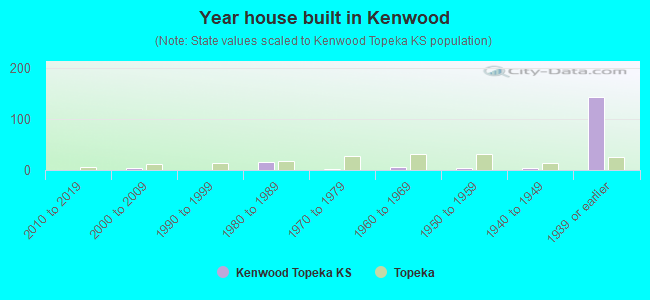
- Year house built in Kenwood
- 02020 or later
- 02010 to 2019
- 42000 to 2009
- 01990 to 1999
- 161980 to 1989
- 11970 to 1979
- 61960 to 1969
- 41950 to 1959
- 31940 to 1949
- 1431939 or earlier
City-data.com crime index for city in 2020 (higher means more crime):
| City: | 8.2 |
| U.S. average: | 219.5 |
Travel time to work (commute)
![Travel time to work (commute)]()
- 6Less than 5 minutes
- 335 to 9 minutes
- 5210 to 14 minutes
- 5315 to 19 minutes
- 1520 to 24 minutes
- 1125 to 29 minutes
- 930 to 34 minutes
- 360 to 89 minutes

Means of transportation to work
![Means of transportation to work]()
- 95.5%218Drove a car alone
- 1.8%4Carpooled
- 2.2%5Bus
- 0.9%2Walked
- 0.9%2Worked at home

Time leaving home to go to work
![Time leaving home to go to work]()
- 412:00 a.m. to 4:59 a.m.
- 15:00 a.m. to 5:29 a.m.
- 15:30 a.m. to 5:59 a.m.
- 36:00 a.m. to 6:29 a.m.
- 126:30 a.m. to 6:59 a.m.
- 337:00 a.m. to 7:29 a.m.
- 617:30 a.m. to 7:59 a.m.
- 228:00 a.m. to 8:29 a.m.
- 38:30 a.m. to 8:59 a.m.
- 89:00 a.m. to 9:59 a.m.
- 410:00 a.m. to 10:59 a.m.
- 511:00 a.m. to 11:59 a.m.
- 1112:00 p.m. to 3:59 p.m.
- 134:00 p.m. to 11:59 p.m.

Occupations of males:
- Percentage of males in management occupations (except farmers):
Here: 4.1% city: 9.3%
- Percentage of males in business and financial operations occupations:
Here: 5.1% city: 3.8%
- Percentage of males in computer and mathematical occupations:
Here: 2.7% city: 4.7%
- Percentage of males in architecture and engineering occupations:
Here: 1.8% city: 2.5%
- Percentage of males in legal occupations:
Here: 34.2% city: 1.4%
- Percentage of males in service occupations:
Here: 13.6% city: 16.6%
- Percentage of males in sales and office occupations:
Here: 17.1% city: 14.5%
- Percentage of males in construction, extraction, and maintenance occupations:
Here: 15.3% city: 9.7%
- Percentage of males in production occupations:
Here: 4.7% city: 8.2%
- Percentage of males in material moving occupations:
Here: 5.8% city: 8.9%
Occupations of females:
- Percentage of females in management occupations (except farmers):
Here: 15.6% city: 6.6%
- Percentage of females in business and financial operations occupations:
Here: 8.1% city: 6.9%
- Percentage of females in computer and mathematical occupations:
Here: 1.9% city: 1.7%
- Percentage of females in life, physical, and social science occupations:
Here: 7.7% city: 0.7%
- Percentage of females in community and social services occupations:
Here: 2.6% city: 2.8%
- Percentage of females in legal occupations:
Here: 5.5% city: 1.0%
- Percentage of females in education, training, and library occupations:
Here: 8.8% city: 8.7%
- Percentage of females in healthcare practitioners and technical occupations:
Here: 30.6% city: 11.5%
- Percentage of females in service occupations:
Here: 6.3% city: 22.2%
- Percentage of females in sales and office occupations:
Here: 15.4% city: 26.9%
- Percentage of females in production occupations:
Here: 3.0% city: 3.3%
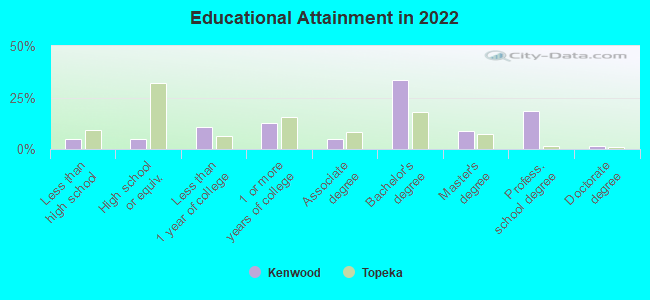
Education in this neighborhood (subdivision or community):
- Percentage of people 3 years and older in K-12 schools:
Kenwood: 22.2% Topeka: 14.7%
- Percentage of people 3 years and older in undergraduate colleges:
Kenwood: 6.8% Topeka: 4.3%
- Percentage of people 3 years and older in grad. or professional schools:
Kenwood: 1.4% Topeka: 1.1%
- Percentage of students K-12 enrolled in private schools:
Kenwood: 2.0% Topeka: 10.9%
Percentage of population below poverty level:
| Kenwood: | 18.5% |
| Topeka: | 17.7% |
Median year owner moved in (as recorded in 2022):
Median year renter moved in (as recorded in 2022):
| Kenwood: | 2006 |
| Topeka: | 2011 |
Median year renter moved in (as recorded in 2022):
| Kenwood: | 2017 |
| Topeka: | 2020 |
Percentage of married-couple families with both working:
| Kenwood: | 98.9% |
| Topeka: | 68.4% |
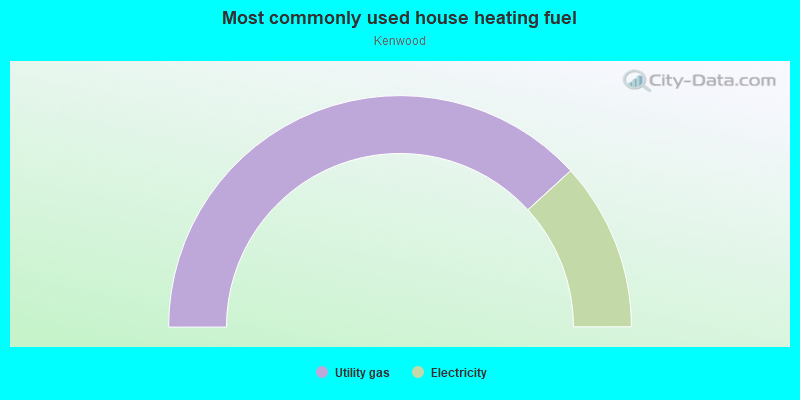
- 76.4%Utility gas
- 23.6%Electricity
Limited-access highways (interstate or state) in this neighborhood:
I- 70 (State Hwy 4, US Hwy 40)
Length: 0.19 miles
Direction: E-W
Direction: E-W
Roads and streets:
SW Courtland Ave
Length: 0.22 miles
Direction: N-S
Address range: 100 to 299
Direction: N-S
Address range: 100 to 299
SW Kendall Ave
Length: 0.22 miles
Direction: N-S
Address range: 100 to 299
Direction: N-S
Address range: 100 to 299
NW Courtland Ave
Length: 0.15 miles
Direction: N-S
Address range: 100 to 299
Direction: N-S
Address range: 100 to 299
NW Kendall Ave
Length: 0.13 miles
Direction: N-S
Address range: 100 to 299
Direction: N-S
Address range: 100 to 299
W 1st Ave
Length: 0.09 miles
Direction: E-W
Address range: 1300 to 1399
Direction: E-W
Address range: 1300 to 1399
SW 3rd St
Length: 0.09 miles
Direction: E-W
Address range: 1300 to 1399
Direction: E-W
Address range: 1300 to 1399
SW 2nd St
Length: 0.09 miles
Direction: E-W
Address range: 1300 to 1399
Direction: E-W
Address range: 1300 to 1399
NW Grove Ave
Length: 0.09 miles
Direction: E-W
Address range: 1300 to 1399
Direction: E-W
Address range: 1300 to 1399