Knollwood-Willow (Knollwood Willow) neighborhood in Lansing, Michigan (MI), 48906, 48915 detailed profile
Settings
X


Business Search - 14 Million verified businesses
Area: 0.221 square miles
Population: 1,098
Population density:
| Knollwood-Willow (Knollwood Willow): | 4,963 people per square mile |
| Lansing: | 3,223 people per square mile |

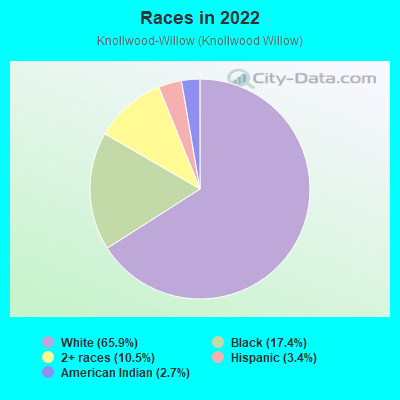
- 72265.9%White
- 19117.4%Black
- 11510.5%Two or more races
- 373.4%Hispanic or Latino
- 302.7%American Indian
Median household income in 2022:
| Knollwood-Willow (Knollwood Willow): | $45,021 |
| Lansing: | $48,962 |
Distribution of median household income
![Distribution of median household income]()
- 56Less than $10,000
- 64$10,000 to $19,999
- 101$20,000 to $29,999
- 84$30,000 to $39,999
- 89$40,000 to $49,999
- 30$50,000 to $59,999
- 53$60,000 to $74,999
- 10$75,000 to $99,999
- 51$100,000 to $124,999
- 28$125,000 to $149,999
- 12$200,000 or more

Distribution of owner-occupied house/condo value
![Distribution of owner-occupied house/condo value]()
- 48$50,000 to $99,999
- 26$100,000 to $149,999
- 17$150,000 to $199,999
- 22$200,000 to $249,999
- 57$300,000 to $399,999

Distribution of rent paid by renters
![Distribution of rent paid by renters]()
- 27$100 to $199
- 11$300 to $399
- 84$400 to $499
- 87$500 to $599
- 52$600 to $699
- 97$700 to $799
- 26$800 to $899
- 69$900 to $999
- 93$1,000 to $1,249
- 26$1,250 to $1,499
- 5$1,500 to $1,999

Median rent in 2022:
| Knollwood-Willow (Knollwood Willow): | $744 |
| Lansing: | $773 |
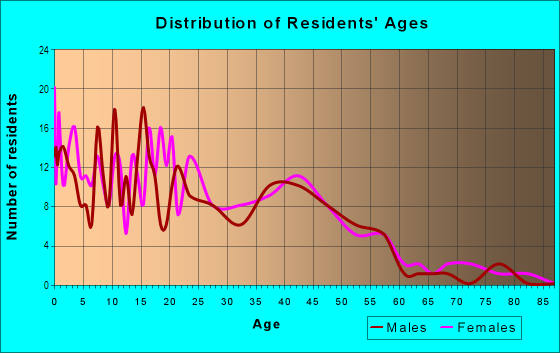
| Males: | 477 |
| Females: | 620 |
Males:
| This neighborhood: | 34.2 years |
| Whole city: | 33.0 years |
| This neighborhood: | 27.2 years |
| Whole city: | 34.5 years |
Average household size:
| Knollwood-Willow (Knollwood Willow): | 2.2 people |
| Lansing: | 2.1 people |
Percentage of family households:
| Knollwood-Willow (Knollwood Willow): | 29.7% |
| Lansing: | 33.9% |
| Here: | 20.7% |
| Lansing: | 27.4% |
Percentage of married-couple families with children (among all households):
| Knollwood-Willow (Knollwood Willow): | 10.2% |
| Lansing: | 23.0% |
Percentage of single-mother households (among all households):
| Knollwood-Willow (Knollwood Willow): | 34.5% |
| Lansing: | 14.1% |
Percentage of never married males 15 years old and over:
Percentage of never married females 15 years old and over:
| Knollwood-Willow (Knollwood Willow): | 24.2% |
| Lansing: | 24.9% |
Percentage of never married females 15 years old and over:
| Knollwood-Willow (Knollwood Willow): | 28.4% |
| city: | 21.6% |
Percentage of people that speak English not well or not at all:
| Knollwood-Willow (Knollwood Willow): | 0.0% |
| Lansing: | 2.3% |
Percentage of people born in this state:
Percentage of people born in another U.S. state:
Percentage of native residents but born outside the U.S.:
Percentage of foreign born residents:
| Here: | 62.7% |
| Lansing: | 72.5% |
Percentage of people born in another U.S. state:
| Knollwood-Willow (Knollwood Willow): | 17.5% |
| Lansing: | 19.1% |
Percentage of native residents but born outside the U.S.:
| Here: | 0.3% |
| city: | 0.8% |
Percentage of foreign born residents:
| Here: | 19.5% |
| Lansing: | 7.6% |
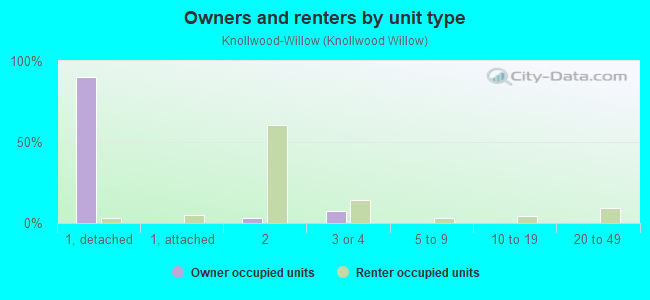
Owner-occupied
Renter-occupied

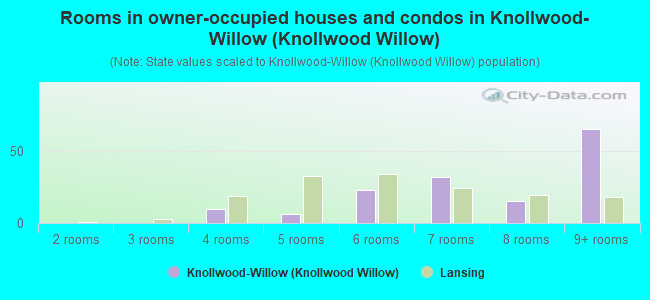
- Rooms in owner-occupied houses and condos in Knollwood-Willow <
> - 01 room
- 02 rooms
- 03 rooms
- 104 rooms
- 65 rooms
- 236 rooms
- 327 rooms
- 158 rooms
- 659+ rooms
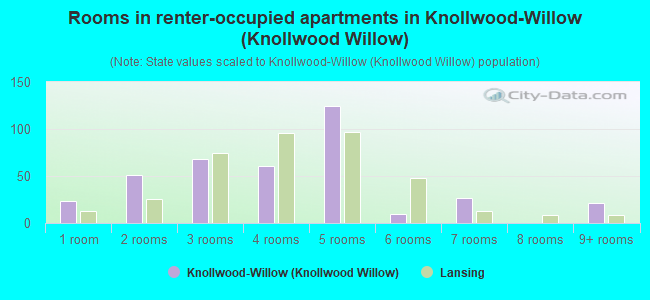
- Rooms in renter-occupied apartments in Knollwood-Willow <
> - 231 room
- 512 rooms
- 683 rooms
- 614 rooms
- 1245 rooms
- 106 rooms
- 277 rooms
- 08 rooms
- 219+ rooms
Owner-occupied
Renter-occupied
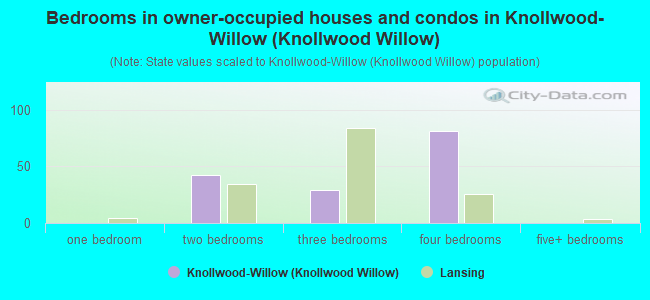
- Bedrooms in owner-occupied houses and condos in Knollwood-Willow <
> - 0no bedroom
- 01 bedroom
- 422 bedrooms
- 293 bedrooms
- 814 bedrooms
- 05+ bedrooms
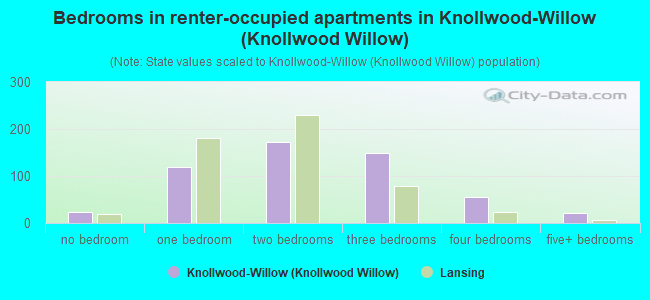
- Bedrooms in renter-occupied apartments in Knollwood-Willow <
> - 23no bedroom
- 1191 bedroom
- 1722 bedrooms
- 1493 bedrooms
- 554 bedrooms
- 215+ bedrooms
Average number of cars or other vehicles available in houses/condos:
Average number of cars or other vehicles available in apartments:
| This neighborhood: | 1.9 |
| Lansing: | 1.7 |
Average number of cars or other vehicles available in apartments:
| Here: | 1.5 |
| city: | 1.1 |
Percentage of units with a mortgage:
| Knollwood-Willow (Knollwood Willow): | 54.6% |
| Lansing: | 65.6% |
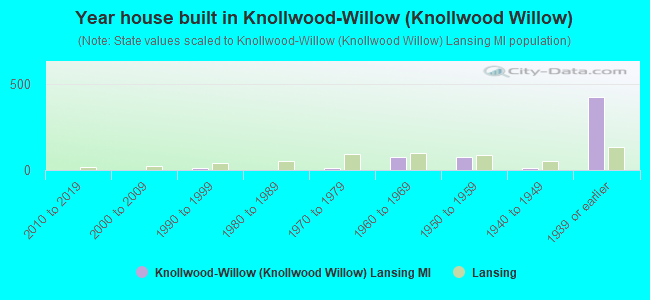
- Year house built in Knollwood-Willow <
> - 02020 or later
- 02010 to 2019
- 02000 to 2009
- 101990 to 1999
- 01980 to 1989
- 111970 to 1979
- 741960 to 1969
- 741950 to 1959
- 111940 to 1949
- 4211939 or earlier
City-data.com crime index for city in 2020 (higher means more crime):
| City: | 553.0 |
| U.S. average: | 219.5 |
Travel time to work (commute)
![Travel time to work (commute)]()
- 57Less than 5 minutes
- 745 to 9 minutes
- 19510 to 14 minutes
- 19215 to 19 minutes
- 13320 to 24 minutes
- 4925 to 29 minutes
- 9230 to 34 minutes
- 4635 to 39 minutes
- 540 to 44 minutes
- 2745 to 59 minutes
- 3160 to 89 minutes
- 690 or more minutes

Means of transportation to work
![Means of transportation to work]()
- 43.8%262Drove a car alone
- 38.2%229Carpooled
- 6.2%37Bus
- 7.0%42Walked
- 4.5%27Worked at home

Time leaving home to go to work
![Time leaving home to go to work]()
- 7112:00 a.m. to 4:59 a.m.
- 465:30 a.m. to 5:59 a.m.
- 926:00 a.m. to 6:29 a.m.
- 396:30 a.m. to 6:59 a.m.
- 827:00 a.m. to 7:29 a.m.
- 757:30 a.m. to 7:59 a.m.
- 1028:00 a.m. to 8:29 a.m.
- 958:30 a.m. to 8:59 a.m.
- 919:00 a.m. to 9:59 a.m.
- 4410:00 a.m. to 10:59 a.m.
- 5312:00 p.m. to 3:59 p.m.
- 1474:00 p.m. to 11:59 p.m.

Occupations of males:
- Percentage of males in management occupations (except farmers):
Here: 17.6% city: 6.2%
- Percentage of males in business and financial operations occupations:
Here: 2.6% city: 4.1%
- Percentage of males in computer and mathematical occupations:
Here: 35.3% city: 6.1%
- Percentage of males in architecture and engineering occupations:
Here: 11.9% city: 2.5%
- Percentage of males in community and social services occupations:
Here: 6.5% city: 1.5%
- Percentage of males in education, training, and library occupations:
Here: 4.5% city: 4.9%
- Percentage of males in arts, design, entertainment, sports, and media occupations:
Here: 9.7% city: 1.9%
- Percentage of males in service occupations:
Here: 11.4% city: 17.2%
- Percentage of males in sales and office occupations:
Here: 15.9% city: 13.3%
- Percentage of males in construction, extraction, and maintenance occupations:
Here: 13.6% city: 6.5%
- Percentage of males in production occupations:
Here: 9.4% city: 9.4%
- Percentage of males in transportation occupations:
Here: 9.1% city: 6.7%
- Percentage of males in material moving occupations:
Here: 18.2% city: 8.5%
Occupations of females:
- Percentage of females in management occupations (except farmers):
Here: 13.6% city: 6.9%
- Percentage of females in business and financial operations occupations:
Here: 3.5% city: 6.7%
- Percentage of females in computer and mathematical occupations:
Here: 3.8% city: 2.4%
- Percentage of females in architecture and engineering occupations:
Here: 1.6% city: 0.7%
- Percentage of females in life, physical, and social science occupations:
Here: 1.4% city: 1.6%
- Percentage of females in community and social services occupations:
Here: 1.4% city: 2.9%
- Percentage of females in education, training, and library occupations:
Here: 6.9% city: 8.7%
- Percentage of females in arts, design, entertainment, sports, and media occupations:
Here: 7.6% city: 1.7%
- Percentage of females in healthcare practitioners and technical occupations:
Here: 6.6% city: 6.7%
- Percentage of females in service occupations:
Here: 21.5% city: 25.0%
- Percentage of females in sales and office occupations:
Here: 27.7% city: 25.9%
- Percentage of females in construction, extraction, and maintenance occupations:
Here: 3.1% city: 0.2%
- Percentage of females in production occupations:
Here: 11.4% city: 5.6%
- Percentage of females in transportation occupations:
Here: 3.8% city: 1.5%
- Percentage of females in material moving occupations:
Here: 4.2% city: 2.3%
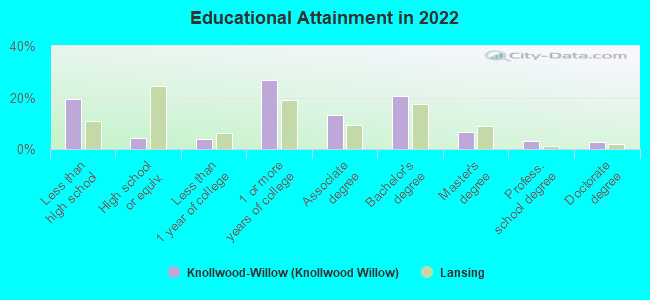
Education in this neighborhood (subdivision or community):
- Percentage of people 3 years and older in K-12 schools:
Knollwood-Willow (Knollwood Willow): 31.4% Lansing: 14.3%
- Percentage of people 3 years and older in undergraduate colleges:
Knollwood-Willow (Knollwood Willow): 7.6% Lansing: 4.6%
- Percentage of people 3 years and older in grad. or professional schools:
Knollwood-Willow (Knollwood Willow): 12.5% Lansing: 2.6%
- Percentage of students K-12 enrolled in private schools:
Knollwood-Willow (Knollwood Willow): 5.5% Lansing: 7.9%
Percentage of population below poverty level:
| Knollwood-Willow (Knollwood Willow): | 43.0% |
| Lansing: | 22.2% |
Median year owner moved in (as recorded in 2022):
Median year renter moved in (as recorded in 2022):
| Knollwood-Willow (Knollwood Willow): | 1989 |
| Lansing: | 2012 |
Median year renter moved in (as recorded in 2022):
| Knollwood-Willow (Knollwood Willow): | 2018 |
| Lansing: | 2020 |
Percentage of married-couple families with both working:
| Knollwood-Willow (Knollwood Willow): | 100.0% |
| Lansing: | 59.6% |
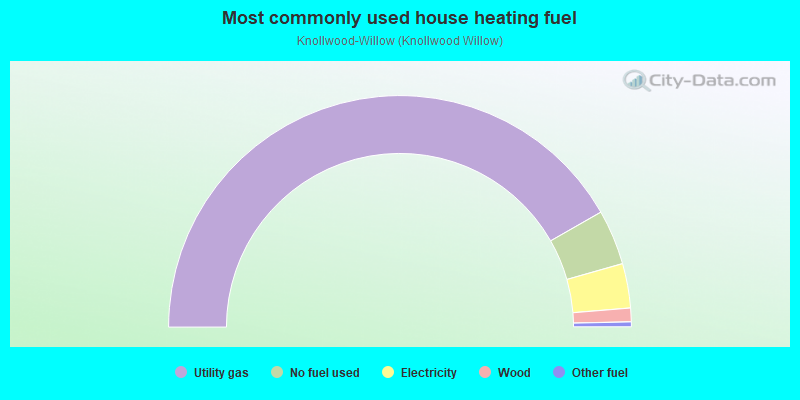
- 83.4%Utility gas
- 7.7%No fuel used
- 6.2%Electricity
- 1.9%Wood
- 0.7%Other fuel
Roads and streets:
Lansing Ave
Length: 0.51 miles
Directions: E-W, N-S
Address range: 1300 to 1799
Directions: E-W, N-S
Address range: 1300 to 1799
Roosevelt Ave
Length: 0.40 miles
Direction: N-S
Address range: 1300 to 1599
Direction: N-S
Address range: 1300 to 1599
Cross St
Length: 0.38 miles
Direction: E-W
Address range: 600 to 999
Direction: E-W
Address range: 600 to 999
Knollwood Ave
Length: 0.37 miles
Direction: N-S
Address range: 1300 to 1599
Direction: N-S
Address range: 1300 to 1599
Roseneath Ave
Length: 0.32 miles
Direction: N-S
Address range: 1400 to 1799
Direction: N-S
Address range: 1400 to 1799
Cypress St
Length: 0.26 miles
Directions: E-W, N-S, SE-NW
Address range: 700 to 899
Directions: E-W, N-S, SE-NW
Address range: 700 to 899
Christopher St
Length: 0.23 miles
Directions: N-S, SE-NW
Address range: 1300 to 1499
Directions: N-S, SE-NW
Address range: 1300 to 1499
W Willow St
Length: 0.18 miles
Directions: E-W, SW-NE
Address range: 712 to 899
Directions: E-W, SW-NE
Address range: 712 to 899
Muskegon Ave
Length: 0.12 miles
Direction: E-W
Direction: E-W
Emerson St
Length: 0.10 miles
Direction: N-S
Address range: 1327 to 1499
Direction: N-S
Address range: 1327 to 1499
N Chestnut St
Length: 0.09 miles
Direction: N-S
Address range: 1320 to 1499
Direction: N-S
Address range: 1320 to 1499
Pleasant St
Length: 0.08 miles
Direction: E-W
Address range: 400 to 499
Direction: E-W
Address range: 400 to 499
Edmore St
Length: 0.08 miles
Direction: E-W
Address range: 400 to 499
Direction: E-W
Address range: 400 to 499
Ontario St
Length: 0.08 miles
Direction: E-W
Address range: 1000 to 1025
Direction: E-W
Address range: 1000 to 1025
Queen St
Length: 0.08 miles
Direction: E-W
Address range: 1000 to 1024
Direction: E-W
Address range: 1000 to 1024
Greenwood St
Length: 0.07 miles
Direction: E-W
Address range: 1000 to 1025
Direction: E-W
Address range: 1000 to 1025
N Walnut St
Length: 0.06 miles
Direction: N-S
Address range: 1318 to 1399
Direction: N-S
Address range: 1318 to 1399