LO Daniel neighborhood in Dallas, Texas (TX), 75208 detailed profile
Settings
X


Business Search - 14 Million verified businesses
Area: 0.104 square miles
Population: 1,371
Population density:
| LO Daniel: | 13,231 people per square mile |
| Dallas: | 3,794 people per square mile |

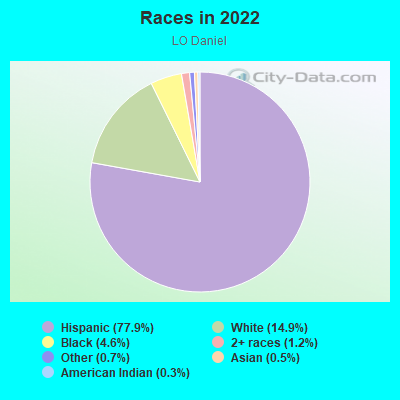
- 1,09477.9%Hispanic or Latino
- 20914.9%White
- 644.6%Black
- 171.2%Two or more races
- 100.7%Some other race
- 70.5%Asian
- 40.3%American Indian
Median household income in 2022:
| LO Daniel: | $79,731 |
| Dallas: | $65,400 |
Distribution of median household income
![Distribution of median household income]()
- 1Less than $10,000
- 23$10,000 to $19,999
- 30$20,000 to $29,999
- 104$30,000 to $39,999
- 82$40,000 to $49,999
- 32$50,000 to $59,999
- 59$60,000 to $74,999
- 42$75,000 to $99,999
- 52$100,000 to $124,999
- 48$125,000 to $149,999
- 14$150,000 to $199,999
- 37$200,000 or more

Distribution of owner-occupied house/condo value
![Distribution of owner-occupied house/condo value]()
- 12Less than $50,000
- 64$50,000 to $99,999
- 32$100,000 to $149,999
- 51$150,000 to $199,999
- 98$200,000 to $249,999
- 41$250,000 to $299,999
- 38$300,000 to $399,999
- 19$400,000 to $499,999
- 19$500,000 to $749,999
- 4$750,000 to $999,999
- 10$1,000,000 or more

Distribution of rent paid by renters
![Distribution of rent paid by renters]()
- 13$200 to $299
- 27$300 to $399
- 6$400 to $499
- 15$500 to $599
- 30$600 to $699
- 50$700 to $799
- 37$800 to $899
- 15$900 to $999
- 24$1,000 to $1,249
- 4$1,250 to $1,499
- 6$1,500 to $1,999
- 6$2,000 or more

Median rent in 2022:
| LO Daniel: | $807 |
| Dallas: | $1,208 |
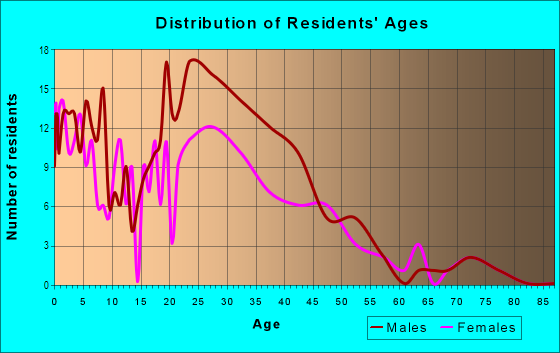
| Males: | 756 |
| Females: | 615 |
Males:
| This neighborhood: | 27.3 years |
| Whole city: | 32.8 years |
| This neighborhood: | 31.2 years |
| Whole city: | 33.4 years |
Average household size:
| LO Daniel: | 3.3 people |
| Dallas: | 2.4 people |
Percentage of family households:
| LO Daniel: | 62.2% |
| Dallas: | 42.6% |
| Here: | 36.9% |
| Dallas: | 33.8% |
Percentage of married-couple families with children (among all households):
| LO Daniel: | 9.3% |
| Dallas: | 24.8% |
Percentage of single-mother households (among all households):
| LO Daniel: | 16.8% |
| Dallas: | 13.3% |
Percentage of never married males 15 years old and over:
Percentage of never married females 15 years old and over:
| LO Daniel: | 23.3% |
| Dallas: | 22.1% |
Percentage of never married females 15 years old and over:
| LO Daniel: | 25.9% |
| city: | 21.8% |
Percentage of people that speak English not well or not at all:
| LO Daniel: | 12.7% |
| Dallas: | 10.7% |
Percentage of people born in this state:
Percentage of people born in another U.S. state:
Percentage of native residents but born outside the U.S.:
Percentage of foreign born residents:
| Here: | 59.8% |
| Dallas: | 52.8% |
Percentage of people born in another U.S. state:
| LO Daniel: | 18.2% |
| Dallas: | 22.0% |
Percentage of native residents but born outside the U.S.:
| Here: | 1.5% |
| city: | 1.3% |
Percentage of foreign born residents:
| Here: | 20.6% |
| Dallas: | 23.9% |
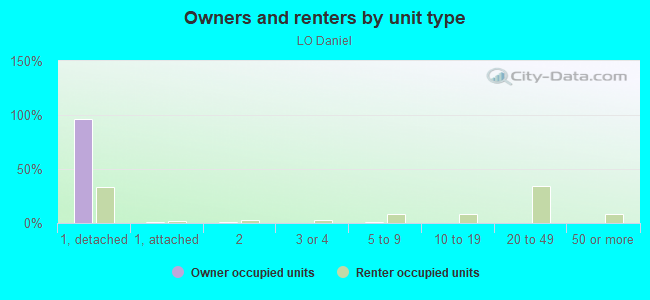
Owner-occupied
Renter-occupied

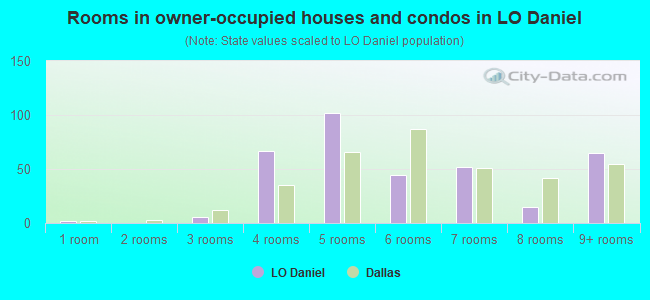
- Rooms in owner-occupied houses and condos in LO Daniel
- 21 room
- 02 rooms
- 63 rooms
- 674 rooms
- 1025 rooms
- 446 rooms
- 527 rooms
- 158 rooms
- 659+ rooms
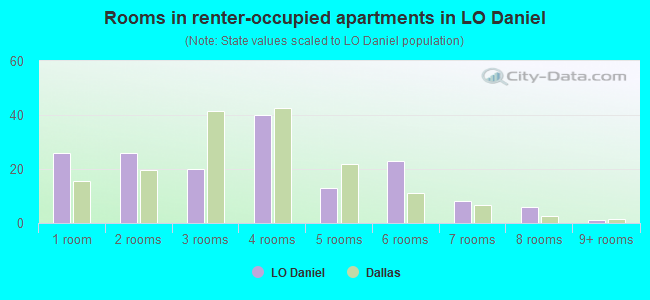
- Rooms in renter-occupied apartments in LO Daniel
- 261 room
- 262 rooms
- 203 rooms
- 404 rooms
- 135 rooms
- 236 rooms
- 87 rooms
- 68 rooms
- 19+ rooms
Owner-occupied
Renter-occupied

- Bedrooms in owner-occupied houses and condos in LO Daniel
- 2no bedroom
- 21 bedroom
- 1322 bedrooms
- 1593 bedrooms
- 154 bedrooms
- 405+ bedrooms
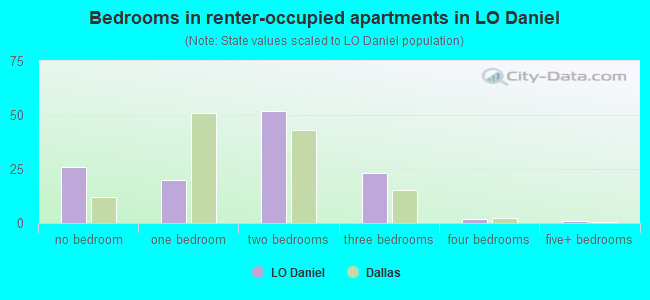
- Bedrooms in renter-occupied apartments in LO Daniel
- 26no bedroom
- 201 bedroom
- 522 bedrooms
- 233 bedrooms
- 24 bedrooms
- 15+ bedrooms
Average number of cars or other vehicles available in houses/condos:
Average number of cars or other vehicles available in apartments:
| This neighborhood: | 2.2 |
| Dallas: | 2.1 |
Average number of cars or other vehicles available in apartments:
| Here: | 1.8 |
| city: | 1.3 |
Percentage of units with a mortgage:
| LO Daniel: | 50.9% |
| Dallas: | 53.9% |
Average estimated value of detached houses in 2022 (98.9% of all units):
| LO Daniel: | $255,602 |
| Dallas: | $423,859 |
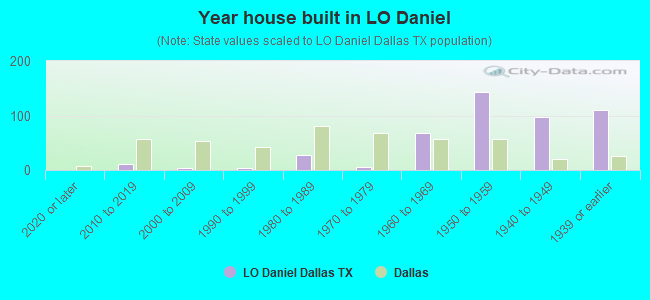
- Year house built in LO Daniel
- 02020 or later
- 112010 to 2019
- 32000 to 2009
- 31990 to 1999
- 281980 to 1989
- 61970 to 1979
- 671960 to 1969
- 1441950 to 1959
- 971940 to 1949
- 1101939 or earlier
City-data.com crime index for city in 2020 (higher means more crime):
| City: | 439.5 |
| U.S. average: | 219.5 |
Travel time to work (commute)
![Travel time to work (commute)]()
- 3Less than 5 minutes
- 205 to 9 minutes
- 3210 to 14 minutes
- 5315 to 19 minutes
- 6420 to 24 minutes
- 1125 to 29 minutes
- 3930 to 34 minutes
- 1035 to 39 minutes
- 1440 to 44 minutes
- 1245 to 59 minutes
- 1060 to 89 minutes
- 390 or more minutes

Means of transportation to work
![Means of transportation to work]()
- 80.0%491Drove a car alone
- 5.7%35Carpooled
- 1.8%11Bus
- 0.2%1Motorcycle
- 0.5%3Walked
- 8.1%50Other means
- 7.7%47Worked at home

Time leaving home to go to work
![Time leaving home to go to work]()
- 2612:00 a.m. to 4:59 a.m.
- 145:00 a.m. to 5:29 a.m.
- 75:30 a.m. to 5:59 a.m.
- 286:00 a.m. to 6:29 a.m.
- 126:30 a.m. to 6:59 a.m.
- 407:00 a.m. to 7:29 a.m.
- 277:30 a.m. to 7:59 a.m.
- 388:00 a.m. to 8:29 a.m.
- 168:30 a.m. to 8:59 a.m.
- 299:00 a.m. to 9:59 a.m.
- 1210:00 a.m. to 10:59 a.m.
- 511:00 a.m. to 11:59 a.m.
- 812:00 p.m. to 3:59 p.m.
- 144:00 p.m. to 11:59 p.m.

Occupations of males:
- Percentage of males in management occupations (except farmers):
Here: 5.7% city: 10.9%
- Percentage of males in business and financial operations occupations:
Here: 12.4% city: 7.3%
- Percentage of males in computer and mathematical occupations:
Here: 2.7% city: 4.7%
- Percentage of males in community and social services occupations:
Here: 1.6% city: 0.8%
- Percentage of males in legal occupations:
Here: 3.8% city: 1.8%
- Percentage of males in arts, design, entertainment, sports, and media occupations:
Here: 7.6% city: 2.2%
- Percentage of males in healthcare practitioners and technical occupations:
Here: 4.5% city: 2.7%
- Percentage of males in service occupations:
Here: 30.5% city: 12.3%
- Percentage of males in sales and office occupations:
Here: 6.1% city: 14.9%
- Percentage of males in construction, extraction, and maintenance occupations:
Here: 5.2% city: 15.2%
- Percentage of males in transportation occupations:
Here: 5.2% city: 5.9%
- Percentage of males in material moving occupations:
Here: 15.0% city: 6.2%
Occupations of females:
- Percentage of females in management occupations (except farmers):
Here: 15.5% city: 9.6%
- Percentage of females in community and social services occupations:
Here: 11.4% city: 1.8%
- Percentage of females in education, training, and library occupations:
Here: 17.2% city: 7.1%
- Percentage of females in arts, design, entertainment, sports, and media occupations:
Here: 2.2% city: 2.9%
- Percentage of females in healthcare practitioners and technical occupations:
Here: 2.3% city: 7.7%
- Percentage of females in service occupations:
Here: 18.6% city: 20.5%
- Percentage of females in sales and office occupations:
Here: 17.3% city: 27.7%
- Percentage of females in production occupations:
Here: 16.1% city: 3.6%
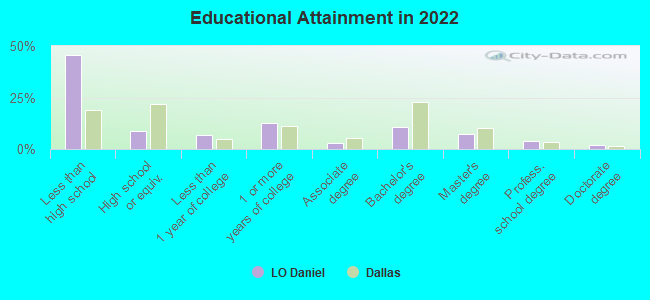
Education in this neighborhood (subdivision or community):
- Percentage of people 3 years and older in K-12 schools:
LO Daniel: 44.3% Dallas: 17.3%
- Percentage of people 3 years and older in undergraduate colleges:
LO Daniel: 3.0% Dallas: 4.1%
- Percentage of people 3 years and older in grad. or professional schools:
LO Daniel: 1.5% Dallas: 1.7%
- Percentage of students K-12 enrolled in private schools:
LO Daniel: 2.4% Dallas: 10.8%
Percentage of population below poverty level:
| LO Daniel: | 15.9% |
| Dallas: | 17.8% |
Median year owner moved in (as recorded in 2022):
Median year renter moved in (as recorded in 2022):
| LO Daniel: | 2005 |
| Dallas: | 2010 |
Median year renter moved in (as recorded in 2022):
| LO Daniel: | 2016 |
| Dallas: | 2020 |
Percentage of married-couple families with both working:
| LO Daniel: | 118.9% |
| Dallas: | 58.3% |
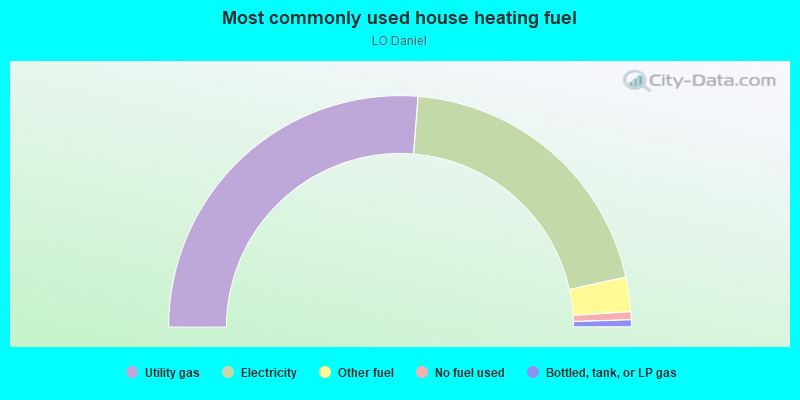
- 52.5%Utility gas
- 40.6%Electricity
- 4.8%Other fuel
- 1.1%No fuel used
- 1.0%Bottled, tank, or LP gas
Highways in this neighborhood:
State Hwy 180 (W Davis St)
Length: 0.20 miles
Direction: E-W
Direction: E-W
Roads and streets:
W Jefferson Blvd
Length: 0.95 miles
Direction: E-W
Address range: 1800 to 2299
Direction: E-W
Address range: 1800 to 2299
N Waverly Dr
Length: 0.20 miles
Direction: N-S
Address range: 200 to 399
Direction: N-S
Address range: 200 to 399
N Montreal Ave
Length: 0.18 miles
Direction: N-S
Address range: 300 to 589
Direction: N-S
Address range: 300 to 589
N Brighton Ave
Length: 0.17 miles
Directions: N-S, SW-NE
Address range: 200 to 399
Directions: N-S, SW-NE
Address range: 200 to 399
W 8th St
Length: 0.17 miles
Direction: E-W
Address range: 1715 to 1999
Direction: E-W
Address range: 1715 to 1999
N Tennant St
Length: 0.15 miles
Directions: N-S, SW-NE
Address range: 381 to 587
Directions: N-S, SW-NE
Address range: 381 to 587
Carnes St
Length: 0.12 miles
Direction: E-W
Address range: 2200 to 2299
Direction: E-W
Address range: 2200 to 2299
N Marlborough Ave
Length: 0.09 miles
Direction: N-S
Address range: 188 to 399
Direction: N-S
Address range: 188 to 399
N Oak Cliff Blvd
Length: 0.02 miles
Directions: N-S, SW-NE
Address range: 188 to 199
Directions: N-S, SW-NE
Address range: 188 to 199