La Casa neighborhood in Tampa, Florida (FL), 33605 detailed profile
Settings
X


Business Search - 14 Million verified businesses
Area: 0.051 square miles
Population: 361
Population density:
| La Casa: | 7,144 people per square mile |
| Tampa: | 3,553 people per square mile |

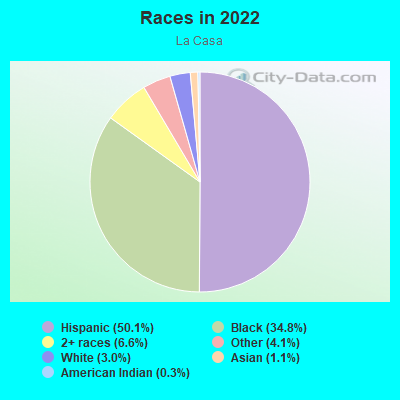
- 18350.1%Hispanic or Latino
- 12734.8%Black
- 246.6%Two or more races
- 154.1%Some other race
- 113.0%White
- 41.1%Asian
- 10.3%American Indian
Distribution of median household income
![Distribution of median household income]()
- 10Less than $10,000
- 73$10,000 to $19,999
- 21$20,000 to $29,999
- 39$30,000 to $39,999
- 12$40,000 to $49,999
- 7$50,000 to $59,999
- 11$60,000 to $74,999
- 11$75,000 to $99,999
- 21$100,000 to $124,999
- 3$125,000 to $149,999
- 2$150,000 to $199,999
- 9$200,000 or more

Distribution of owner-occupied house/condo value
![Distribution of owner-occupied house/condo value]()
- 5Less than $50,000
- 8$50,000 to $99,999
- 11$100,000 to $149,999
- 4$150,000 to $199,999
- 21$200,000 to $249,999
- 15$250,000 to $299,999
- 7$300,000 to $399,999
- 5$400,000 to $499,999
- 3$500,000 to $749,999
- 4$1,000,000 or more

Distribution of rent paid by renters
![Distribution of rent paid by renters]()
- 15$100 to $199
- 10$200 to $299
- 12$300 to $399
- 28$400 to $499
- 11$500 to $599
- 13$600 to $699
- 15$700 to $799
- 15$800 to $899
- 22$900 to $999
- 22$1,000 to $1,249
- 7$1,250 to $1,499
- 19$1,500 to $1,999

Median rent in 2022:
| La Casa: | $583 |
| Tampa: | $1,444 |
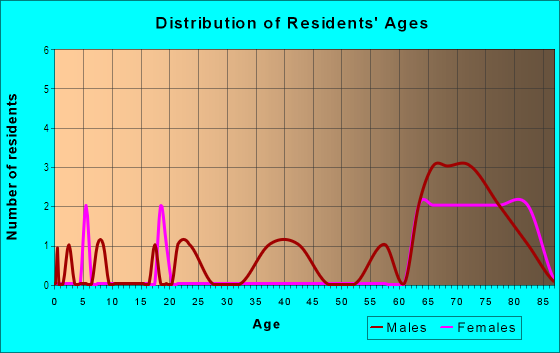
| Males: | 181 |
| Females: | 179 |
Males:
| This neighborhood: | 37.3 years |
| Whole city: | 35.5 years |
| This neighborhood: | 41.8 years |
| Whole city: | 35.1 years |
Average household size:
| La Casa: | 2.2 people |
| Tampa: | 2.3 people |
Percentage of family households:
| La Casa: | 48.3% |
| Tampa: | 39.9% |
| Here: | 31.3% |
| Tampa: | 35.4% |
Percentage of married-couple families with children (among all households):
| La Casa: | 11.5% |
| Tampa: | 25.1% |
Percentage of single-mother households (among all households):
| La Casa: | 34.4% |
| Tampa: | 12.2% |
Percentage of never married males 15 years old and over:
Percentage of never married females 15 years old and over:
| La Casa: | 23.3% |
| Tampa: | 23.6% |
Percentage of never married females 15 years old and over:
| La Casa: | 28.9% |
| city: | 20.9% |
Percentage of people that speak English not well or not at all:
| La Casa: | 17.1% |
| Tampa: | 6.4% |
Percentage of people born in this state:
Percentage of people born in another U.S. state:
Percentage of native residents but born outside the U.S.:
Percentage of foreign born residents:
| Here: | 55.5% |
| Tampa: | 39.7% |
Percentage of people born in another U.S. state:
| La Casa: | 23.6% |
| Tampa: | 35.7% |
Percentage of native residents but born outside the U.S.:
| Here: | 10.6% |
| city: | 4.6% |
Percentage of foreign born residents:
| Here: | 10.4% |
| Tampa: | 20.0% |
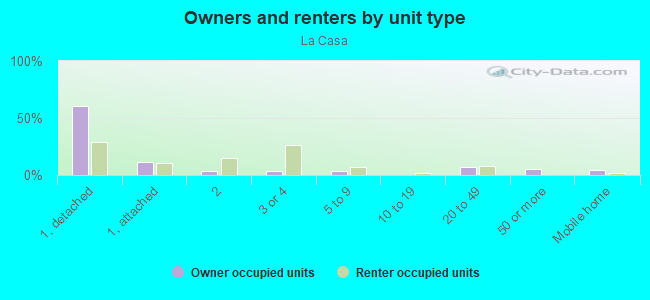
Owner-occupied
Renter-occupied

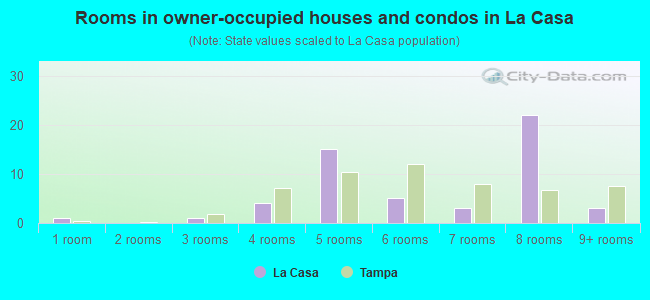
- Rooms in owner-occupied houses and condos in La Casa
- 11 room
- 02 rooms
- 13 rooms
- 44 rooms
- 155 rooms
- 56 rooms
- 37 rooms
- 228 rooms
- 39+ rooms
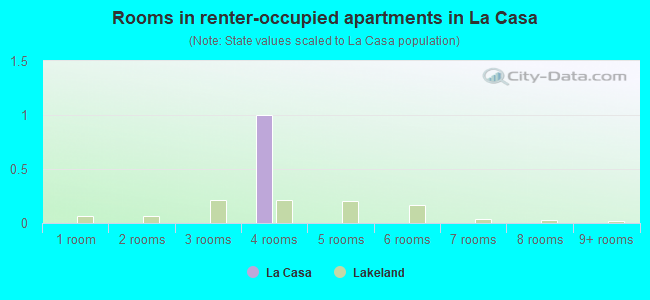
- Rooms in renter-occupied apartments in La Casa
- 01 room
- 02 rooms
- 613 rooms
- 214 rooms
- 435 rooms
- 226 rooms
- 77 rooms
- 08 rooms
- 49+ rooms
Owner-occupied
Renter-occupied
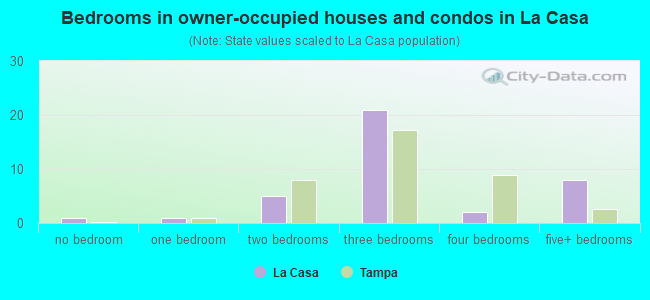
- Bedrooms in owner-occupied houses and condos in La Casa
- 1no bedroom
- 11 bedroom
- 52 bedrooms
- 213 bedrooms
- 24 bedrooms
- 85+ bedrooms
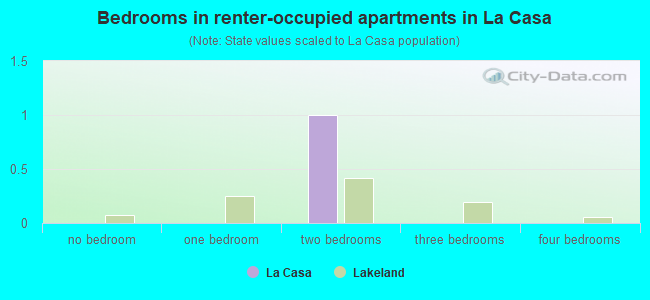
- Bedrooms in renter-occupied apartments in La Casa
- 0no bedroom
- 671 bedroom
- 212 bedrooms
- 373 bedrooms
- 214 bedrooms
- 75+ bedrooms
Average number of cars or other vehicles available in houses/condos:
Average number of cars or other vehicles available in apartments:
| This neighborhood: | 1.5 |
| Tampa: | 1.9 |
Average number of cars or other vehicles available in apartments:
| Here: | 0.8 |
| city: | 1.3 |
Percentage of units with a mortgage:
| La Casa: | 58.6% |
| Tampa: | 65.8% |
Average estimated value of detached houses in 2022 (47.6% of all units):
| La Casa: | $346,871 |
| Tampa: | $505,567 |
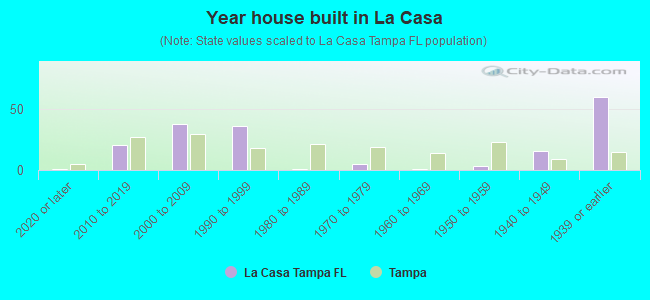
- Year house built in La Casa
- 12020 or later
- 212010 to 2019
- 382000 to 2009
- 361990 to 1999
- 11980 to 1989
- 51970 to 1979
- 11960 to 1969
- 31950 to 1959
- 161940 to 1949
- 601939 or earlier
City-data.com crime index for city in 2020 (higher means more crime):
| City: | 212.7 |
| U.S. average: | 219.5 |
Travel time to work (commute)
![Travel time to work (commute)]()
- 3Less than 5 minutes
- 155 to 9 minutes
- 1215 to 19 minutes
- 1120 to 24 minutes
- 425 to 29 minutes
- 1530 to 34 minutes
- 635 to 39 minutes
- 440 to 44 minutes
- 245 to 59 minutes
- 560 to 89 minutes
- 390 or more minutes

Means of transportation to work
![Means of transportation to work]()
- 74.4%75Drove a car alone
- 10.9%11Carpooled
- 2.0%2Bus
- 6.0%6Bicycle
- 12.9%13Walked
- 6.9%7Worked at home

Time leaving home to go to work
![Time leaving home to go to work]()
- 312:00 a.m. to 4:59 a.m.
- 165:00 a.m. to 5:29 a.m.
- 65:30 a.m. to 5:59 a.m.
- 16:00 a.m. to 6:29 a.m.
- 26:30 a.m. to 6:59 a.m.
- 197:00 a.m. to 7:29 a.m.
- 97:30 a.m. to 7:59 a.m.
- 108:00 a.m. to 8:29 a.m.
- 98:30 a.m. to 8:59 a.m.
- 129:00 a.m. to 9:59 a.m.
- 1110:00 a.m. to 10:59 a.m.
- 112:00 p.m. to 3:59 p.m.
- 34:00 p.m. to 11:59 p.m.

Occupations of males:
- Percentage of males in management occupations (except farmers):
Here: 4.2% city: 14.3%
- Percentage of males in business and financial operations occupations:
Here: 14.2% city: 7.8%
- Percentage of males in computer and mathematical occupations:
Here: 5.7% city: 6.0%
- Percentage of males in education, training, and library occupations:
Here: 4.0% city: 2.2%
- Percentage of males in arts, design, entertainment, sports, and media occupations:
Here: 28.3% city: 2.5%
- Percentage of males in healthcare practitioners and technical occupations:
Here: 7.5% city: 4.9%
- Percentage of males in service occupations:
Here: 7.7% city: 13.7%
- Percentage of males in farming, fishing, and forestry occupations:
Here: 7.5% city: 0.6%
- Percentage of males in construction, extraction, and maintenance occupations:
Here: 30.1% city: 8.2%
- Percentage of males in production occupations:
Here: 2.3% city: 3.7%
Occupations of females:
- Percentage of females in management occupations (except farmers):
Here: 7.1% city: 10.9%
- Percentage of females in business and financial operations occupations:
Here: 2.8% city: 8.5%
- Percentage of females in community and social services occupations:
Here: 31.3% city: 2.1%
- Percentage of females in education, training, and library occupations:
Here: 5.5% city: 7.2%
- Percentage of females in healthcare practitioners and technical occupations:
Here: 8.1% city: 10.3%
- Percentage of females in service occupations:
Here: 17.7% city: 19.1%
- Percentage of females in sales and office occupations:
Here: 18.7% city: 27.1%
- Percentage of females in material moving occupations:
Here: 11.6% city: 1.4%
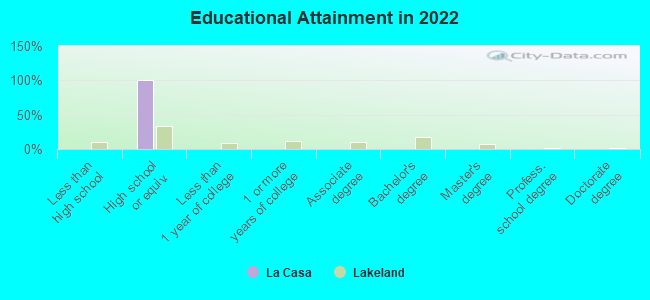
Education in this neighborhood (subdivision or community):
- Percentage of people 3 years and older in K-12 schools:
La Casa: 27.3% Tampa: 14.3%
- Percentage of people 3 years and older in undergraduate colleges:
La Casa: 5.4% Tampa: 7.8%
- Percentage of people 3 years and older in grad. or professional schools:
La Casa: 2.3% Tampa: 2.0%
- Percentage of students K-12 enrolled in private schools:
La Casa: 3.1% Tampa: 12.5%
Percentage of population below poverty level:
| La Casa: | 25.3% |
| Tampa: | 16.3% |
Median year owner moved in (as recorded in 2022):
Median year renter moved in (as recorded in 2022):
| La Casa: | 2007 |
| Tampa: | 2013 |
Median year renter moved in (as recorded in 2022):
| La Casa: | 2015 |
| Tampa: | 2020 |
Percentage of married-couple families with both working:
| La Casa: | 51.2% |
| Tampa: | 70.4% |
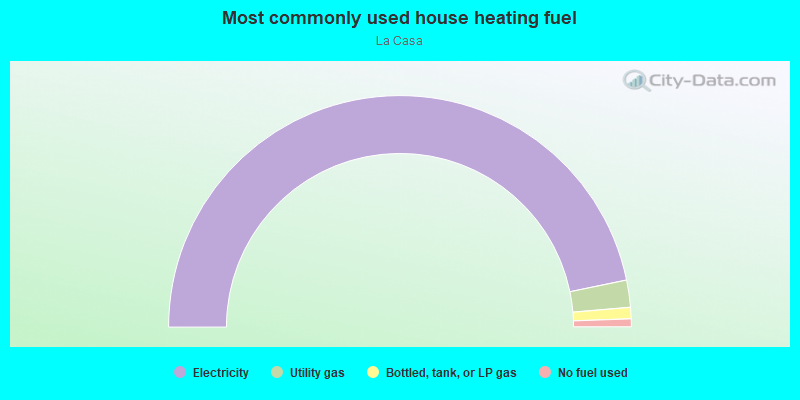
- 82.7%Electricity
- 14.3%Utility gas
- 1.8%No fuel used
- 1.3%Bottled, tank, or LP gas
Roads and streets:
N 17th St
Length: 0.15 miles
Direction: N-S
Address range: 2200 to 2599
Direction: N-S
Address range: 2200 to 2599
E 12th Ave
Length: 0.12 miles
Direction: E-W
Address range: 1458 to 1599
Direction: E-W
Address range: 1458 to 1599
N 16th St
Length: 0.10 miles
Direction: N-S
Address range: 2300 to 2599
Direction: N-S
Address range: 2300 to 2599
E 14th Ave
Length: 0.09 miles
Direction: E-W
Address range: 1600 to 1699
Direction: E-W
Address range: 1600 to 1699
E 15th Ave
Length: 0.09 miles
Direction: E-W
Address range: 1600 to 1699
Direction: E-W
Address range: 1600 to 1699
E 13th Ave
Length: 0.09 miles
Direction: E-W
Address range: 1600 to 1699
Direction: E-W
Address range: 1600 to 1699
Hacienda Ct
Length: 0.04 miles
Direction: N-S
Address range: 1600 to 1615
Direction: N-S
Address range: 1600 to 1615