Las Vegas Medical District neighborhood in Las Vegas, Nevada (NV), 89106 detailed profile
Settings
X


Business Search - 14 Million verified businesses
Area: 0.355 square miles
Population: 1,990
Population density:
| Las Vegas Medical District: | 5,599 people per square mile |
| Las Vegas: | 5,792 people per square mile |

- 76737.8%Black
- 52525.9%Hispanic or Latino
- 52225.7%White
- 874.3%Two or more races
- 603.0%American Indian
- 592.9%Asian
- 60.3%Native Hawaiian and Other
Pacific Islander - 20.10%Some other race

Distribution of median household income
![Distribution of median household income]()
- 398Less than $10,000
- 93$10,000 to $19,999
- 238$20,000 to $29,999
- 139$30,000 to $39,999
- 139$40,000 to $49,999
- 230$50,000 to $59,999
- 116$60,000 to $74,999
- 133$75,000 to $99,999
- 48$100,000 to $124,999
- 14$125,000 to $149,999
- 10$150,000 to $199,999
- 45$200,000 or more

Distribution of owner-occupied house/condo value
![Distribution of owner-occupied house/condo value]()
- 11Less than $50,000
- 33$50,000 to $99,999
- 10$100,000 to $149,999
- 62$150,000 to $199,999
- 42$200,000 to $249,999
- 41$250,000 to $299,999
- 21$300,000 to $399,999
- 22$400,000 to $499,999
- 21$500,000 to $749,999
- 20$750,000 to $999,999
- 32$1,000,000 or more

Distribution of rent paid by renters
![Distribution of rent paid by renters]()
- 5$400 to $499
- 43$500 to $599
- 52$600 to $699
- 25$700 to $799
- 19$800 to $899
- 95$900 to $999
- 190$1,000 to $1,249
- 354$1,250 to $1,499
- 145$1,500 to $1,999
- 19$2,000 or more

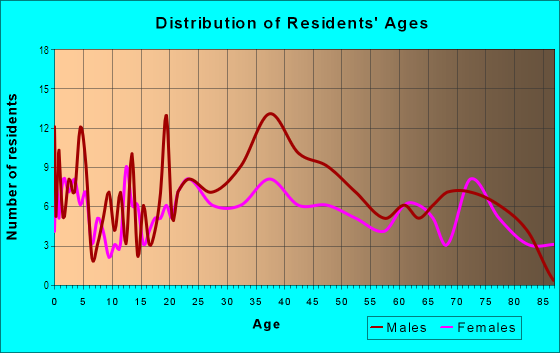
| Males: | 1,155 |
| Females: | 834 |
Males:
| This neighborhood: | 41.3 years |
| Whole city: | 38.4 years |
| This neighborhood: | 39.8 years |
| Whole city: | 38.9 years |
Average household size:
| Las Vegas Medical District: | 2.7 people |
| Las Vegas: | 2.7 people |
Percentage of family households:
| Las Vegas Medical District: | 33.0% |
| Las Vegas: | 45.8% |
| Here: | 13.6% |
| Las Vegas: | 40.9% |
Percentage of married-couple families with children (among all households):
| Las Vegas Medical District: | 7.8% |
| Las Vegas: | 23.4% |
Percentage of single-mother households (among all households):
| Las Vegas Medical District: | 13.2% |
| Las Vegas: | 10.1% |
Percentage of never married males 15 years old and over:
Percentage of never married females 15 years old and over:
| Las Vegas Medical District: | 35.1% |
| Las Vegas: | 19.7% |
Percentage of never married females 15 years old and over:
| Las Vegas Medical District: | 17.8% |
| city: | 17.0% |
Percentage of people that speak English not well or not at all:
| Las Vegas Medical District: | 2.4% |
| Las Vegas: | 7.0% |
Percentage of people born in this state:
Percentage of people born in another U.S. state:
Percentage of native residents but born outside the U.S.:
Percentage of foreign born residents:
| Here: | 26.5% |
| Las Vegas: | 27.3% |
Percentage of people born in another U.S. state:
| Las Vegas Medical District: | 52.5% |
| Las Vegas: | 49.8% |
Percentage of native residents but born outside the U.S.:
| Here: | 1.5% |
| city: | 1.9% |
Percentage of foreign born residents:
| Here: | 19.6% |
| Las Vegas: | 21.0% |

Owner-occupied
Renter-occupied

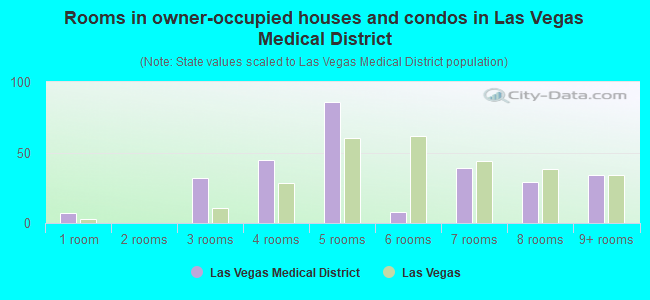
- Rooms in owner-occupied houses and condos in Las Vegas Medical District
- 71 room
- 02 rooms
- 323 rooms
- 454 rooms
- 865 rooms
- 86 rooms
- 397 rooms
- 298 rooms
- 349+ rooms

- Rooms in renter-occupied apartments in Las Vegas Medical District
- 3141 room
- 872 rooms
- 3473 rooms
- 2994 rooms
- 1395 rooms
- 306 rooms
- 297 rooms
- 158 rooms
- 49+ rooms
Owner-occupied
Renter-occupied

- Bedrooms in owner-occupied houses and condos in Las Vegas Medical District
- 7no bedroom
- 01 bedroom
- 352 bedrooms
- 253 bedrooms
- 404 bedrooms
- 195+ bedrooms

- Bedrooms in renter-occupied apartments in Las Vegas Medical District
- 345no bedroom
- 4561 bedroom
- 3392 bedrooms
- 383 bedrooms
- 44 bedrooms
- 45+ bedrooms
Average number of cars or other vehicles available in houses/condos:
Average number of cars or other vehicles available in apartments:
| This neighborhood: | |
| Las Vegas: |
Average number of cars or other vehicles available in apartments:
| Here: | 0.5 |
| city: | 1.3 |
Percentage of units with a mortgage:
| Las Vegas Medical District: | 59.8% |
| Las Vegas: | 69.3% |

- Year house built in Las Vegas Medical District
- 02020 or later
- 532010 to 2019
- 2392000 to 2009
- 4731990 to 1999
- 3481980 to 1989
- 1541970 to 1979
- 831960 to 1969
- 151950 to 1959
- 661940 to 1949
- 31939 or earlier

City-data.com crime index for city in 2020 (higher means more crime):
| City: | 280.7 |
| U.S. average: | 219.5 |
Travel time to work (commute)
![Travel time to work (commute)]()
- 20Less than 5 minutes
- 265 to 9 minutes
- 11910 to 14 minutes
- 19015 to 19 minutes
- 27020 to 24 minutes
- 4225 to 29 minutes
- 13930 to 34 minutes
- 5035 to 39 minutes
- 7545 to 59 minutes
- 3260 to 89 minutes
- 590 or more minutes

Means of transportation to work
![Means of transportation to work]()
- 47.2%327Drove a car alone
- 35.8%248Carpooled
- 18.2%126Bus
- 0.3%2Long-distance train or commuter rail
- 0.3%2Ferryboat
- 9.5%66Taxi
- 5.1%35Motorcycle
- 0.4%3Bicycle
- 33.8%234Walked
- 7.1%49Other means
- 10.1%70Worked at home

Time leaving home to go to work
![Time leaving home to go to work]()
- 3012:00 a.m. to 4:59 a.m.
- 245:00 a.m. to 5:29 a.m.
- 345:30 a.m. to 5:59 a.m.
- 986:00 a.m. to 6:29 a.m.
- 706:30 a.m. to 6:59 a.m.
- 1187:00 a.m. to 7:29 a.m.
- 467:30 a.m. to 7:59 a.m.
- 1048:00 a.m. to 8:29 a.m.
- 288:30 a.m. to 8:59 a.m.
- 819:00 a.m. to 9:59 a.m.
- 4310:00 a.m. to 10:59 a.m.
- 1211:00 a.m. to 11:59 a.m.
- 6612:00 p.m. to 3:59 p.m.
- 1754:00 p.m. to 11:59 p.m.

Occupations of males:
- Percentage of males in architecture and engineering occupations:
Here: 7.1% city: 1.8%
- Percentage of males in arts, design, entertainment, sports, and media occupations:
Here: 5.7% city: 2.5%
- Percentage of males in healthcare practitioners and technical occupations:
Here: 5.6% city: 3.3%
- Percentage of males in service occupations:
Here: 30.7% city: 23.3%
- Percentage of males in sales and office occupations:
Here: 14.8% city: 16.6%
- Percentage of males in construction, extraction, and maintenance occupations:
Here: 13.3% city: 10.6%
- Percentage of males in material moving occupations:
Here: 12.6% city: 5.4%
Occupations of females:
- Percentage of females in management occupations (except farmers):
Here: 4.0% city: 8.5%
- Percentage of females in healthcare practitioners and technical occupations:
Here: 8.9% city: 7.4%
- Percentage of females in sales and office occupations:
Here: 61.0% city: 30.5%
- Percentage of females in production occupations:
Here: 12.2% city: 1.8%
- Percentage of females in transportation occupations:
Here: 13.9% city: 1.6%
- Percentage of females in material moving occupations:
Here: 2.4% city: 2.2%
Education in this neighborhood (subdivision or community):
- Percentage of people 3 years and older in K-12 schools:
Las Vegas Medical District: 34.4% Las Vegas: 17.4%
- Percentage of people 3 years and older in undergraduate colleges:
Las Vegas Medical District: 5.3% Las Vegas: 4.2%
- Percentage of people 3 years and older in grad. or professional schools:
Las Vegas Medical District: 1.7% Las Vegas: 1.0%
- Percentage of students K-12 enrolled in private schools:
Las Vegas Medical District: 10.6% Las Vegas: 12.9%
Percentage of population below poverty level:
| Las Vegas Medical District: | 28.2% |
| Las Vegas: | 14.1% |
Percentage of married-couple families with both working:
| Las Vegas Medical District: | 32.4% |
| Las Vegas: | 62.0% |

- 71.8%Electricity
- 15.3%Utility gas
- 8.7%Bottled, tank, or LP gas
- 2.8%No fuel used
- 1.5%Solar energy
Highways in this neighborhood:
State Rte 159 (W Charleston Blvd)
Length: 0.11 miles
Direction: E-W
Address range: 2004 to 2099
Direction: E-W
Address range: 2004 to 2099
Roads and streets:
Pinto Ln
Length: 0.72 miles
Direction: E-W
Address range: 1400 to 2199
Direction: E-W
Address range: 1400 to 2199
Shadow Ln
Length: 0.47 miles
Direction: N-S
Address range: 506 to 1099
Direction: N-S
Address range: 506 to 1099
S Tonopah Dr
Length: 0.41 miles
Direction: N-S
Address range: 515 to 1099
Direction: N-S
Address range: 515 to 1099
Desert Ln
Length: 0.34 miles
Direction: N-S
Address range: 505 to 999
Direction: N-S
Address range: 505 to 999
Goldring Ave
Length: 0.31 miles
Direction: E-W
Address range: 1800 to 2099
Direction: E-W
Address range: 1800 to 2099
S Martin L King Blvd
Length: 0.29 miles
Direction: N-S
Address range: 600 to 1049
Direction: N-S
Address range: 600 to 1049
Rose St
Length: 0.27 miles
Directions: N-S, SW-NE
Address range: 514 to 898
Directions: N-S, SW-NE
Address range: 514 to 898
Kenyon Pl
Length: 0.23 miles
Direction: E-W
Address range: 1500 to 1799
Direction: E-W
Address range: 1500 to 1799
Bearden (Bearden Dr)
Length: 0.17 miles
Directions: E-W, N-S, SE-NW, SW-NE
Address range: 701 to 1799
Directions: E-W, N-S, SE-NW, SW-NE
Address range: 701 to 1799
Hastings Ave
Length: 0.16 miles
Direction: E-W
Address range: 1500 to 1699
Direction: E-W
Address range: 1500 to 1699
Hamilton Ln
Length: 0.15 miles
Direction: E-W
Address range: 2000 to 2099
Direction: E-W
Address range: 2000 to 2099
Valerie St
Length: 0.15 miles
Directions: E-W, SW-NE
Address range: 2000 to 2099
Directions: E-W, SW-NE
Address range: 2000 to 2099
Truluck Ln
Length: 0.13 miles
Direction: N-S
Address range: 600 to 699
Direction: N-S
Address range: 600 to 699
Rancho Ln
Length: 0.12 miles
Directions: E-W, SE-NW
Address range: 976 to 1099
Directions: E-W, SE-NW
Address range: 976 to 1099
Willow St
Length: 0.12 miles
Direction: N-S
Address range: 800 to 999
Direction: N-S
Address range: 800 to 999
Palomino Ln
Length: 0.09 miles
Direction: E-W
Address range: 2000 to 2098
Direction: E-W
Address range: 2000 to 2098
Alturas Ave
Length: 0.08 miles
Direction: E-W
Address range: 1800 to 1899
Direction: E-W
Address range: 1800 to 1899
Kingsbury Ln
Length: 0.07 miles
Direction: N-S
Address range: 600 to 699
Direction: N-S
Address range: 600 to 699