Lawrence Farms neighborhood in Bay Shore, New York (NY), 11718, 11706 detailed profile
Settings
X


Business Search - 14 Million verified businesses
Area: 0.287 square miles
Population: 1,470
Population density:
| Lawrence Farms: | 5,120 people per square mile |
| Bay Shore: | 5,796 people per square mile |

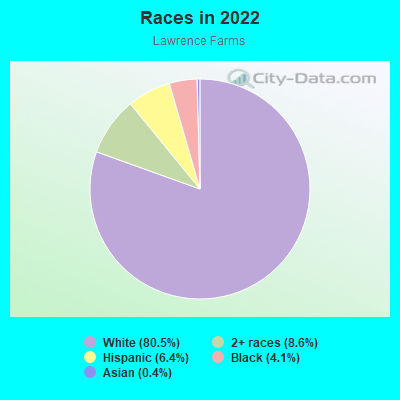
- 1,36080.5%White
- 1458.6%Two or more races
- 1086.4%Hispanic or Latino
- 694.1%Black
- 70.4%Asian
Median household income in 2022:
| Lawrence Farms: | $169,316 |
| Bay Shore: | $103,272 |
Distribution of median household income
![Distribution of median household income]()
- 8$10,000 to $19,999
- 10$20,000 to $29,999
- 11$30,000 to $39,999
- 23$40,000 to $49,999
- 6$50,000 to $59,999
- 19$60,000 to $74,999
- 24$75,000 to $99,999
- 31$100,000 to $124,999
- 54$125,000 to $149,999
- 79$150,000 to $199,999
- 192$200,000 or more

Distribution of owner-occupied house/condo value
![Distribution of owner-occupied house/condo value]()
- 8Less than $50,000
- 26$50,000 to $99,999
- 8$100,000 to $149,999
- 2$150,000 to $199,999
- 10$300,000 to $399,999
- 12$400,000 to $499,999
- 121$500,000 to $749,999
- 110$750,000 to $999,999
- 141$1,000,000 or more

Distribution of rent paid by renters
![Distribution of rent paid by renters]()
- 7$1,500 to $1,999
- 12$2,000 or more

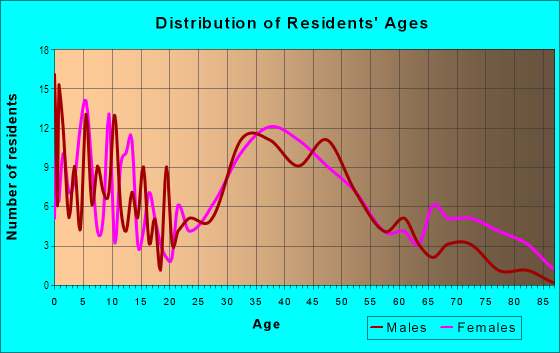
| Males: | 736 |
| Females: | 733 |
Males:
| This neighborhood: | 39.2 years |
| Whole city: | 35.0 years |
| This neighborhood: | 36.0 years |
| Whole city: | 38.1 years |
Average household size:
| Lawrence Farms: | 3.2 people |
| Bay Shore: | 3.1 people |
Percentage of family households:
| Lawrence Farms: | 71.5% |
| Bay Shore: | 46.8% |
| Here: | 82.0% |
| Bay Shore: | 43.8% |
Percentage of married-couple families with children (among all households):
| Lawrence Farms: | 29.1% |
| Bay Shore: | 24.1% |
Percentage of single-mother households (among all households):
| Lawrence Farms: | 0.5% |
| Bay Shore: | 7.1% |
Percentage of never married males 15 years old and over:
Percentage of never married females 15 years old and over:
| Lawrence Farms: | 16.8% |
| Bay Shore: | 22.6% |
Percentage of never married females 15 years old and over:
| Lawrence Farms: | 11.3% |
| place: | 17.6% |
Percentage of people that speak English not well or not at all:
| Lawrence Farms: | 0.0% |
| Bay Shore: | 6.1% |
Percentage of people born in this state:
Percentage of people born in another U.S. state:
Percentage of native residents but born outside the U.S.:
Percentage of foreign born residents:
| Here: | 87.5% |
| Bay Shore: | 63.0% |
Percentage of people born in another U.S. state:
| Lawrence Farms: | 5.7% |
| Bay Shore: | 5.5% |
Percentage of native residents but born outside the U.S.:
| Here: | 1.6% |
| place: | 3.8% |
Percentage of foreign born residents:
| Here: | 5.2% |
| Bay Shore: | 27.7% |
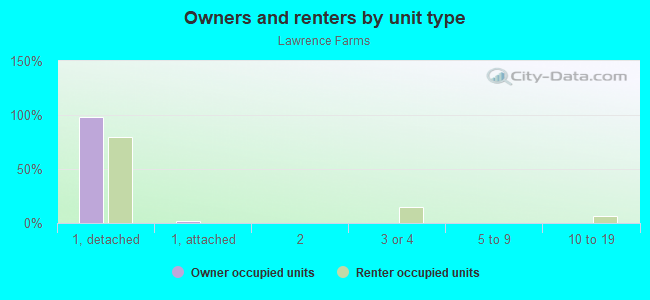
Owner-occupied
Renter-occupied

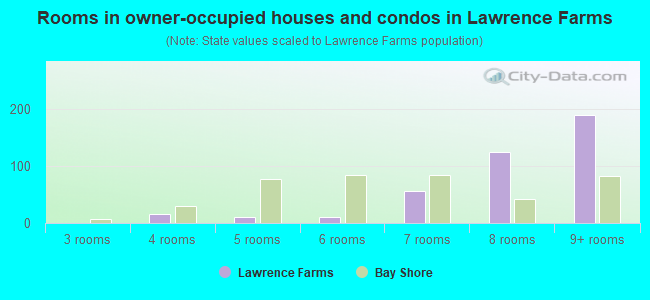
- Rooms in owner-occupied houses and condos in Lawrence Farms
- 01 room
- 02 rooms
- 03 rooms
- 154 rooms
- 115 rooms
- 106 rooms
- 567 rooms
- 1258 rooms
- 1909+ rooms
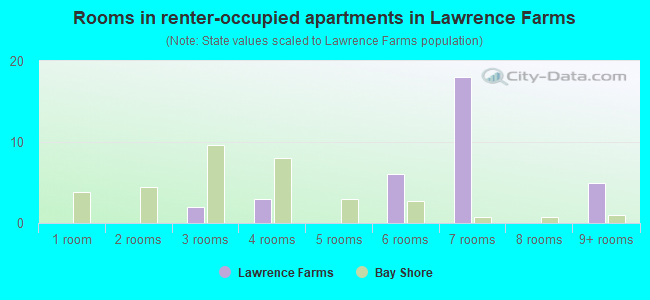
- Rooms in renter-occupied apartments in Lawrence Farms
- 01 room
- 02 rooms
- 23 rooms
- 34 rooms
- 05 rooms
- 66 rooms
- 187 rooms
- 08 rooms
- 59+ rooms
Owner-occupied
Renter-occupied

- Bedrooms in owner-occupied houses and condos in Lawrence Farms
- 0no bedroom
- 71 bedroom
- 272 bedrooms
- 1573 bedrooms
- 1734 bedrooms
- 445+ bedrooms
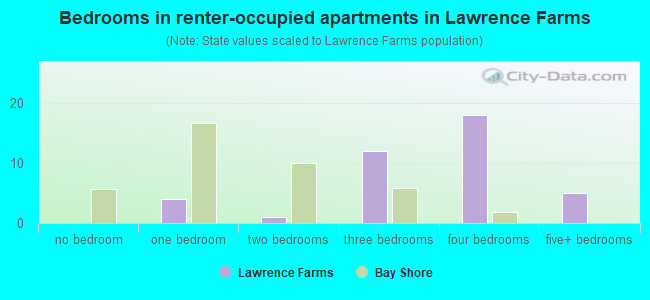
- Bedrooms in renter-occupied apartments in Lawrence Farms
- 0no bedroom
- 41 bedroom
- 12 bedrooms
- 123 bedrooms
- 184 bedrooms
- 55+ bedrooms
Average number of cars or other vehicles available in houses/condos:
Average number of cars or other vehicles available in apartments:
| This neighborhood: | 1.7 |
| Bay Shore: | 2.1 |
Average number of cars or other vehicles available in apartments:
| Here: | 0.8 |
| place: | 1.2 |
Percentage of units with a mortgage:
| Lawrence Farms: | 78.0% |
| Bay Shore: | 70.9% |
Average estimated value of detached houses in 2022 (98.6% of all units):
| Lawrence Farms: | $596,460 |
| Bay Shore: | $490,415 |
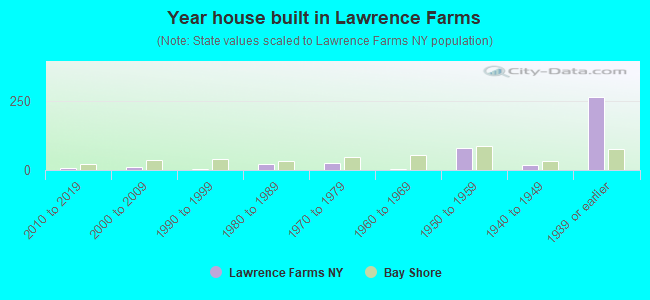
- Year house built in Lawrence Farms
- 02020 or later
- 62010 to 2019
- 112000 to 2009
- 41990 to 1999
- 201980 to 1989
- 241970 to 1979
- 31960 to 1969
- 801950 to 1959
- 181940 to 1949
- 2621939 or earlier
Travel time to work (commute)
![Travel time to work (commute)]()
- 18Less than 5 minutes
- 485 to 9 minutes
- 6510 to 14 minutes
- 5315 to 19 minutes
- 6220 to 24 minutes
- 2025 to 29 minutes
- 4330 to 34 minutes
- 135 to 39 minutes
- 2140 to 44 minutes
- 3045 to 59 minutes
- 2560 to 89 minutes
- 2190 or more minutes

Means of transportation to work
![Means of transportation to work]()
- 58.1%441Drove a car alone
- 2.5%19Carpooled
- 0.9%7Bus
- 3.7%28Long-distance train or commuter rail
- 3.3%25Walked
- 5.0%38Other means
- 26.1%198Worked at home

Time leaving home to go to work
![Time leaving home to go to work]()
- 312:00 a.m. to 4:59 a.m.
- 85:00 a.m. to 5:29 a.m.
- 115:30 a.m. to 5:59 a.m.
- 336:00 a.m. to 6:29 a.m.
- 166:30 a.m. to 6:59 a.m.
- 747:00 a.m. to 7:29 a.m.
- 167:30 a.m. to 7:59 a.m.
- 988:00 a.m. to 8:29 a.m.
- 408:30 a.m. to 8:59 a.m.
- 419:00 a.m. to 9:59 a.m.
- 2510:00 a.m. to 10:59 a.m.
- 311:00 a.m. to 11:59 a.m.
- 2012:00 p.m. to 3:59 p.m.
- 144:00 p.m. to 11:59 p.m.

Occupations of males:
- Percentage of males in management occupations (except farmers):
Here: 23.9% place: 11.9%
- Percentage of males in business and financial operations occupations:
Here: 14.0% place: 3.1%
- Percentage of males in computer and mathematical occupations:
Here: 1.6% place: 2.9%
- Percentage of males in architecture and engineering occupations:
Here: 4.8% place: 2.2%
- Percentage of males in life, physical, and social science occupations:
Here: 1.3% place: 0.7%
- Percentage of males in legal occupations:
Here: 3.7% place: 3.0%
- Percentage of males in education, training, and library occupations:
Here: 2.7% place: 2.1%
- Percentage of males in arts, design, entertainment, sports, and media occupations:
Here: 2.7% place: 1.3%
- Percentage of males in healthcare practitioners and technical occupations:
Here: 9.5% place: 2.8%
- Percentage of males in service occupations:
Here: 15.6% place: 14.9%
- Percentage of males in sales and office occupations:
Here: 15.4% place: 15.5%
- Percentage of males in construction, extraction, and maintenance occupations:
Here: 1.6% place: 9.5%
- Percentage of males in production occupations:
Here: 1.9% place: 6.1%
- Percentage of males in material moving occupations:
Here: 1.3% place: 5.9%
Occupations of females:
- Percentage of females in management occupations (except farmers):
Here: 13.9% place: 5.5%
- Percentage of females in business and financial operations occupations:
Here: 2.9% place: 4.7%
- Percentage of females in computer and mathematical occupations:
Here: 1.8% place: 0.5%
- Percentage of females in architecture and engineering occupations:
Here: 2.9% place: 0.0%
- Percentage of females in life, physical, and social science occupations:
Here: 2.9% place: 0.6%
- Percentage of females in community and social services occupations:
Here: 1.8% place: 4.3%
- Percentage of females in education, training, and library occupations:
Here: 22.7% place: 15.5%
- Percentage of females in arts, design, entertainment, sports, and media occupations:
Here: 6.9% place: 1.1%
- Percentage of females in healthcare practitioners and technical occupations:
Here: 3.3% place: 8.3%
- Percentage of females in service occupations:
Here: 3.7% place: 18.3%
- Percentage of females in sales and office occupations:
Here: 29.6% place: 32.4%
- Percentage of females in construction, extraction, and maintenance occupations:
Here: 5.1% place: 0.3%
- Percentage of females in production occupations:
Here: 2.2% place: 4.4%
Percentage of people 16-64 in Armed Forces:
| Lawrence Farms: | 0.3% |
| Bay Shore: | 0.1% |
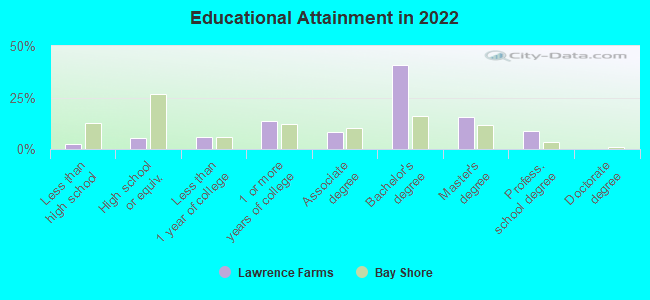
Education in this neighborhood (subdivision or community):
- Percentage of people 3 years and older in K-12 schools:
Lawrence Farms: 25.7% Bay Shore: 20.7%
- Percentage of people 3 years and older in undergraduate colleges:
Lawrence Farms: 3.4% Bay Shore: 5.1%
- Percentage of people 3 years and older in grad. or professional schools:
Lawrence Farms: 0.6% Bay Shore: 1.4%
- Percentage of students K-12 enrolled in private schools:
Lawrence Farms: 15.9% Bay Shore: 4.6%
Percentage of population below poverty level:
| Lawrence Farms: | 0.3% |
| Bay Shore: | 7.3% |
Median year owner moved in (as recorded in 2022):
| Lawrence Farms: | 2007 |
| Bay Shore: | 2007 |
Percentage of married-couple families with both working:
| Lawrence Farms: | 57.9% |
| Bay Shore: | 71.1% |
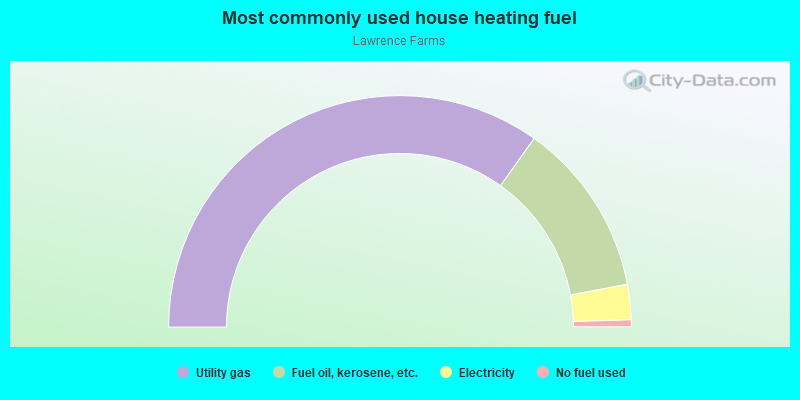
- 69.7%Utility gas
- 24.4%Fuel oil, kerosene, etc.
- 4.9%Electricity
- 1.0%No fuel used
Highways in this neighborhood:
Montauk Hwy (State Hwy 27A, Main St)
Length: 0.33 miles
Direction: SW-NE
Address range: 219 to 320
Direction: SW-NE
Address range: 219 to 320
W Main St (State Hwy 27A)
Length: 0.14 miles
Direction: SW-NE
Address range: 174 to 316
Direction: SW-NE
Address range: 174 to 316
Montauk Hwy (State Hwy 27A, S Country Rd)
Length: 0.08 miles
Direction: SW-NE
Direction: SW-NE
Roads and streets:
Windsor Ave (N Windsor Ave)
Length: 0.77 miles
Direction: SE-NW
Address range: 1 to 351
Direction: SE-NW
Address range: 1 to 351
Union Blvd
Length: 0.67 miles
Directions: E-W, SW-NE
Address range: 1326 to 1498
Directions: E-W, SW-NE
Address range: 1326 to 1498
Sunset Rd
Length: 0.63 miles
Direction: SE-NW
Address range: 1 to 99
Direction: SE-NW
Address range: 1 to 99
Clinton Ave
Length: 0.58 miles
Direction: SE-NW
Address range: 1 to 99
Direction: SE-NW
Address range: 1 to 99
Orinoco Dr
Length: 0.56 miles
Directions: E-W, SW-NE
Address range: 9 to 199
Directions: E-W, SW-NE
Address range: 9 to 199
Hemlock Ln
Length: 0.51 miles
Direction: SE-NW
Address range: 1 to 74
Direction: SE-NW
Address range: 1 to 74
Community Rd
Length: 0.50 miles
Directions: E-W, SE-NW
Address range: 1 to 66
Directions: E-W, SE-NW
Address range: 1 to 66
Cooper Ln
Length: 0.48 miles
Direction: SW-NE
Address range: 1 to 46
Direction: SW-NE
Address range: 1 to 46
Lanier Ln
Length: 0.42 miles
Direction: SE-NW
Address range: 1 to 99
Direction: SE-NW
Address range: 1 to 99
Seafield Ln
Length: 0.41 miles
Direction: SE-NW
Address range: 1 to 99
Direction: SE-NW
Address range: 1 to 99
Johnson Ln
Length: 0.20 miles
Direction: SE-NW
Address range: 45 to 74
Direction: SE-NW
Address range: 45 to 74
Garden Pl
Length: 0.19 miles
Direction: E-W
Address range: 1 to 26
Direction: E-W
Address range: 1 to 26
Hemlock Ct
Length: 0.18 miles
Direction: SE-NW
Address range: 2 to 8
Direction: SE-NW
Address range: 2 to 8
Bonniwell Pl
Length: 0.18 miles
Direction: E-W
Direction: E-W
E Orinoco Ct
Length: 0.10 miles
Direction: E-W
Direction: E-W
East Ct
Length: 0.05 miles
Direction: SE-NW
Direction: SE-NW
Ackerson St
Length: 0.04 miles
Direction: SW-NE
Address range: 12 to 24
Direction: SW-NE
Address range: 12 to 24
Richland Blvd
Length: 0.03 miles
Direction: SE-NW
Direction: SE-NW
Pine Acres Blvd
Length: 0.03 miles
Direction: N-S
Direction: N-S
Railroad features:
Long Island RR
Length: 0.64 miles
Direction: E-W
Direction: E-W