Lawrence Station neighborhood in Sunnyvale, California (CA), 95051, 94086 detailed profile
Settings
X


Business Search - 14 Million verified businesses
Area: 0.709 square miles
Population: 8,475
Population density:
| Lawrence Station: | 11,948 people per square mile |
| Sunnyvale: | 6,978 people per square mile |

- 2,99135.1%Asian
- 2,87533.7%White
- 1,74320.4%Hispanic or Latino
- 7689.0%Two or more races
- 530.6%Black
- 500.6%Some other race
- 450.5%American Indian

Median household income in 2022:
| Lawrence Station: | $250,001 |
| Sunnyvale: | $169,781 |
Distribution of median household income
![Distribution of median household income]()
- 24Less than $10,000
- 42$10,000 to $19,999
- 51$20,000 to $29,999
- 68$30,000 to $39,999
- 91$40,000 to $49,999
- 177$50,000 to $59,999
- 36$60,000 to $74,999
- 127$75,000 to $99,999
- 36$100,000 to $124,999
- 81$125,000 to $149,999
- 334$150,000 to $199,999
- 1,870$200,000 or more

Distribution of owner-occupied house/condo value
![Distribution of owner-occupied house/condo value]()
- 23Less than $50,000
- 19$200,000 to $249,999
- 74$500,000 to $749,999
- 91$750,000 to $999,999
- 1,628$1,000,000 or more

Distribution of rent paid by renters
![Distribution of rent paid by renters]()
- 7$200 to $299
- 15$800 to $899
- 22$900 to $999
- 12$1,250 to $1,499
- 263$1,500 to $1,999
- 1,577$2,000 or more

Median rent in 2022:
| Lawrence Station: | $3,501 |
| Sunnyvale: | $2,001 |
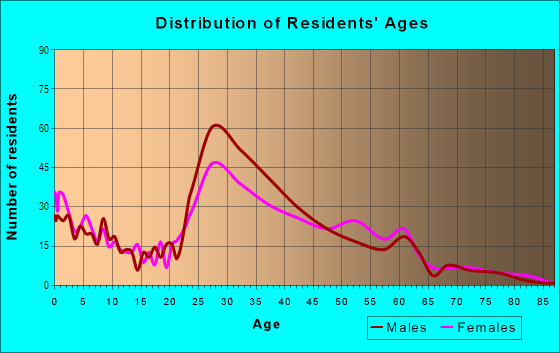
| Males: | 4,614 |
| Females: | 3,861 |
Males:
| This neighborhood: | 39.9 years |
| Whole city: | 34.2 years |
| This neighborhood: | 46.5 years |
| Whole city: | 37.1 years |
Average household size:
| Lawrence Station: | 33.0 people |
| Sunnyvale: | 2.6 people |
Percentage of family households:
| Lawrence Station: | 64.7% |
| Sunnyvale: | 47.1% |
| Here: | 75.9% |
| Sunnyvale: | 50.8% |
Percentage of married-couple families with children (among all households):
| Lawrence Station: | 30.4% |
| Sunnyvale: | 33.2% |
Percentage of single-mother households (among all households):
| Lawrence Station: | 4.4% |
| Sunnyvale: | 4.2% |
Percentage of never married males 15 years old and over:
Percentage of never married females 15 years old and over:
| Lawrence Station: | 14.6% |
| Sunnyvale: | 23.3% |
Percentage of never married females 15 years old and over:
| Lawrence Station: | 7.0% |
| city: | 13.4% |
Percentage of people that speak English not well or not at all:
| Lawrence Station: | 0.0% |
| Sunnyvale: | 8.1% |
Percentage of people born in this state:
Percentage of people born in another U.S. state:
Percentage of native residents but born outside the U.S.:
Percentage of foreign born residents:
| Here: | 31.1% |
| Sunnyvale: | 37.8% |
Percentage of people born in another U.S. state:
| Lawrence Station: | 12.2% |
| Sunnyvale: | 12.0% |
Percentage of native residents but born outside the U.S.:
| Here: | 1.2% |
| city: | 1.7% |
Percentage of foreign born residents:
| Here: | 55.5% |
| Sunnyvale: | 48.5% |

Owner-occupied
Renter-occupied


- Rooms in owner-occupied houses and condos in Lawrence Station
- 01 room
- 442 rooms
- 523 rooms
- 604 rooms
- 2195 rooms
- 5766 rooms
- 7377 rooms
- 2328 rooms
- 1119+ rooms

- Rooms in renter-occupied apartments in Lawrence Station
- 2411 room
- 7752 rooms
- 4853 rooms
- 704 rooms
- 7125 rooms
- 1356 rooms
- 1467 rooms
- 968 rooms
- 509+ rooms
Owner-occupied
Renter-occupied

- Bedrooms in owner-occupied houses and condos in Lawrence Station
- 0no bedroom
- 441 bedroom
- 802 bedrooms
- 8283 bedrooms
- 6624 bedrooms
- 1465+ bedrooms

- Bedrooms in renter-occupied apartments in Lawrence Station
- 243no bedroom
- 1,0071 bedroom
- 6612 bedrooms
- 8743 bedrooms
- 2024 bedrooms
- 05+ bedrooms
Average number of cars or other vehicles available in houses/condos:
Average number of cars or other vehicles available in apartments:
| This neighborhood: | 2.3 |
| Sunnyvale: | 2.0 |
Average number of cars or other vehicles available in apartments:
| Here: | 2.5 |
| city: | 1.5 |
Percentage of units with a mortgage:
| Lawrence Station: | 65.3% |
| Sunnyvale: | 57.7% |
Average estimated value of detached houses in 2022 (98.4% of all units):
| Lawrence Station: | $1,854,859 |
| Sunnyvale: | $2,056,322 |

- Year house built in Lawrence Station
- 02020 or later
- 452010 to 2019
- 2252000 to 2009
- 1241990 to 1999
- 1281980 to 1989
- 1,1521970 to 1979
- 1,3591960 to 1969
- 2171950 to 1959
- 201940 to 1949
- 231939 or earlier

City-data.com crime index for city in 2020 (higher means more crime):
| City: | 151.0 |
| U.S. average: | 219.5 |
Travel time to work (commute)
![Travel time to work (commute)]()
- 123Less than 5 minutes
- 2685 to 9 minutes
- 54310 to 14 minutes
- 63515 to 19 minutes
- 74020 to 24 minutes
- 21925 to 29 minutes
- 79430 to 34 minutes
- 9535 to 39 minutes
- 11040 to 44 minutes
- 12745 to 59 minutes
- 9060 to 89 minutes
- 17290 or more minutes

Means of transportation to work
![Means of transportation to work]()
- 72.6%2,789Drove a car alone
- 4.6%176Carpooled
- 6.1%234Bus
- 3.9%149Long-distance train or commuter rail
- 2.1%80Taxi
- 1.8%70Bicycle
- 0.9%35Walked
- 2.0%77Other means
- 17.9%687Worked at home

Time leaving home to go to work
![Time leaving home to go to work]()
- 25112:00 a.m. to 4:59 a.m.
- 575:00 a.m. to 5:29 a.m.
- 2505:30 a.m. to 5:59 a.m.
- 1206:00 a.m. to 6:29 a.m.
- 2176:30 a.m. to 6:59 a.m.
- 3237:00 a.m. to 7:29 a.m.
- 2107:30 a.m. to 7:59 a.m.
- 7098:00 a.m. to 8:29 a.m.
- 3298:30 a.m. to 8:59 a.m.
- 6659:00 a.m. to 9:59 a.m.
- 19910:00 a.m. to 10:59 a.m.
- 14711:00 a.m. to 11:59 a.m.
- 34112:00 p.m. to 3:59 p.m.
- 1124:00 p.m. to 11:59 p.m.

Occupations of males:
- Percentage of males in management occupations (except farmers):
Here: 13.4% city: 12.9%
- Percentage of males in business and financial operations occupations:
Here: 2.2% city: 3.9%
- Percentage of males in computer and mathematical occupations:
Here: 66.3% city: 36.0%
- Percentage of males in architecture and engineering occupations:
Here: 9.0% city: 11.7%
- Percentage of males in life, physical, and social science occupations:
Here: 6.0% city: 1.9%
- Percentage of males in legal occupations:
Here: 17.9% city: 0.5%
- Percentage of males in education, training, and library occupations:
Here: 21.9% city: 1.8%
- Percentage of males in arts, design, entertainment, sports, and media occupations:
Here: 1.4% city: 1.0%
- Percentage of males in healthcare practitioners and technical occupations:
Here: 23.0% city: 1.4%
- Percentage of males in service occupations:
Here: 107.3% city: 6.8%
- Percentage of males in sales and office occupations:
Here: 3.0% city: 9.4%
- Percentage of males in construction, extraction, and maintenance occupations:
Here: 51.5% city: 3.0%
- Percentage of males in production occupations:
Here: 4.6% city: 2.8%
- Percentage of males in transportation occupations:
Here: 19.5% city: 2.9%
- Percentage of males in material moving occupations:
Here: 53.1% city: 1.2%
Occupations of females:
- Percentage of females in management occupations (except farmers):
Here: 7.7% city: 12.6%
- Percentage of females in business and financial operations occupations:
Here: 18.0% city: 9.5%
- Percentage of females in computer and mathematical occupations:
Here: 19.0% city: 17.6%
- Percentage of females in architecture and engineering occupations:
Here: 9.3% city: 5.6%
- Percentage of females in life, physical, and social science occupations:
Here: 5.0% city: 3.1%
- Percentage of females in community and social services occupations:
Here: 2.3% city: 1.2%
- Percentage of females in legal occupations:
Here: 8.8% city: 1.2%
- Percentage of females in education, training, and library occupations:
Here: 7.0% city: 7.5%
- Percentage of females in arts, design, entertainment, sports, and media occupations:
Here: 2.3% city: 3.5%
- Percentage of females in healthcare practitioners and technical occupations:
Here: 150.9% city: 5.1%
- Percentage of females in service occupations:
Here: 11.7% city: 12.0%
- Percentage of females in sales and office occupations:
Here: 17.7% city: 16.1%
- Percentage of females in production occupations:
Here: 37.0% city: 2.9%
- Percentage of females in material moving occupations:
Here: 34.6% city: 1.0%
Education in this neighborhood (subdivision or community):
- Percentage of people 3 years and older in K-12 schools:
Lawrence Station: 15.0% Sunnyvale: 12.5%
- Percentage of people 3 years and older in undergraduate colleges:
Lawrence Station: 1.7% Sunnyvale: 5.1%
- Percentage of people 3 years and older in grad. or professional schools:
Lawrence Station: 4.4% Sunnyvale: 2.3%
- Percentage of students K-12 enrolled in private schools:
Lawrence Station: 22.9% Sunnyvale: 14.9%
Percentage of population below poverty level:
| Lawrence Station: | 3.5% |
| Sunnyvale: | 6.2% |
Median year owner moved in (as recorded in 2022):
Median year renter moved in (as recorded in 2022):
| Lawrence Station: | 1997 |
| Sunnyvale: | 2008 |
Median year renter moved in (as recorded in 2022):
| Lawrence Station: | 2019 |
| Sunnyvale: | 2021 |
Percentage of married-couple families with both working:
| Lawrence Station: | 46.9% |
| Sunnyvale: | 69.8% |

- 76.0%Utility gas
- 16.3%Electricity
- 5.1%No fuel used
- 2.6%Bottled, tank, or LP gas
Limited-access highways (interstate or state) in this neighborhood:
Central Expy
Length: 1.01 miles
Directions: E-W, N-S, SW-NE
Directions: E-W, N-S, SW-NE
Lawrence Expy
Length: 0.05 miles
Direction: N-S
Direction: N-S
Roads and streets:
Kifer Rd
Length: 1.27 miles
Directions: E-W, SW-NE
Address range: 800 to 1499
Directions: E-W, SW-NE
Address range: 800 to 1499
Reed Ave
Length: 0.98 miles
Directions: E-W, N-S, SE-NW, SW-NE
Address range: 981 to 1149
Directions: E-W, N-S, SE-NW, SW-NE
Address range: 981 to 1149
E Evelyn Ave
Length: 0.82 miles
Directions: E-W, N-S, SE-NW
Address range: 850 to 1099
Directions: E-W, N-S, SE-NW
Address range: 850 to 1099
Aster Ave
Length: 0.82 miles
Directions: E-W, N-S, SE-NW, SW-NE
Address range: 900 to 1199
Directions: E-W, N-S, SE-NW, SW-NE
Address range: 900 to 1199
Azalea Dr
Length: 0.63 miles
Directions: E-W, N-S, SE-NW, SW-NE
Address range: 800 to 1099
Directions: E-W, N-S, SE-NW, SW-NE
Address range: 800 to 1099
Bluebonnet Dr
Length: 0.56 miles
Directions: E-W, N-S, SW-NE
Address range: 900 to 1099
Directions: E-W, N-S, SW-NE
Address range: 900 to 1099
S Wolfe Rd
Length: 0.36 miles
Direction: N-S
Direction: N-S
Willow Ave
Length: 0.34 miles
Directions: E-W, N-S, SW-NE
Address range: 1100 to 1199
Directions: E-W, N-S, SW-NE
Address range: 1100 to 1199
San Zeno Way
Length: 0.24 miles
Directions: E-W, N-S, SE-NW
Address range: 100 to 199
Directions: E-W, N-S, SE-NW
Address range: 100 to 199
Reed Ter
Length: 0.24 miles
Directions: E-W, N-S, SW-NE
Address range: 1000 to 1099
Directions: E-W, N-S, SW-NE
Address range: 1000 to 1099
W Evelyn Ter (Evelyn Ter)
Length: 0.22 miles
Directions: E-W, N-S, SE-NW, SW-NE
Address range: 901 to 999
Directions: E-W, N-S, SE-NW, SW-NE
Address range: 901 to 999
San Ysidro Way
Length: 0.22 miles
Direction: N-S
Address range: 2900 to 2999
Direction: N-S
Address range: 2900 to 2999
W Evelyn Ter
Length: 0.21 miles
Directions: E-W, N-S, SE-NW, SW-NE
Directions: E-W, N-S, SE-NW, SW-NE
Pin Oak Dr
Length: 0.20 miles
Direction: N-S
Address range: 400 to 499
Direction: N-S
Address range: 400 to 499
Commercial St
Length: 0.19 miles
Directions: N-S, SE-NW
Address range: 100 to 195
Directions: N-S, SE-NW
Address range: 100 to 195
Sequoia Dr
Length: 0.19 miles
Direction: N-S
Address range: 400 to 599
Direction: N-S
Address range: 400 to 599
Sonora Ct
Length: 0.18 miles
Direction: E-W
Address range: 1100 to 1199
Direction: E-W
Address range: 1100 to 1199
Palo Verde Dr
Length: 0.18 miles
Directions: E-W, N-S, SE-NW
Address range: 400 to 499
Directions: E-W, N-S, SE-NW
Address range: 400 to 499
E Evelyn Ter
Length: 0.17 miles
Directions: E-W, N-S, SE-NW, SW-NE
Address range: 1001 to 1099
Directions: E-W, N-S, SE-NW, SW-NE
Address range: 1001 to 1099
Semiconductor Dr
Length: 0.17 miles
Direction: N-S
Address range: 2900 to 3099
Direction: N-S
Address range: 2900 to 3099
Enochs St
Length: 0.16 miles
Directions: E-W, N-S, SE-NW
Address range: 3600 to 3699
Directions: E-W, N-S, SE-NW
Address range: 3600 to 3699
San Lazaro Ave
Length: 0.15 miles
Directions: N-S, SW-NE
Address range: 100 to 199
Directions: N-S, SW-NE
Address range: 100 to 199
Red Oak Dr E
Length: 0.14 miles
Directions: E-W, N-S, SW-NE
Address range: 200 to 299
Directions: E-W, N-S, SW-NE
Address range: 200 to 299
Palmetto Dr
Length: 0.13 miles
Directions: E-W, N-S, SW-NE
Address range: 400 to 499
Directions: E-W, N-S, SW-NE
Address range: 400 to 499
Bougainvillea Ter
Length: 0.11 miles
Directions: N-S, SW-NE
Address range: 1000 to 1099
Directions: N-S, SW-NE
Address range: 1000 to 1099
Tahoe Way
Length: 0.10 miles
Direction: E-W
Address range: 3600 to 3799
Direction: E-W
Address range: 3600 to 3799
Bermuda Ct
Length: 0.10 miles
Direction: E-W
Address range: 900 to 999
Direction: E-W
Address range: 900 to 999
Red Oak Dr W
Length: 0.10 miles
Directions: E-W, N-S, SE-NW
Address range: 200 to 299
Directions: E-W, N-S, SE-NW
Address range: 200 to 299
Aster Ct
Length: 0.09 miles
Direction: E-W
Address range: 900 to 999
Direction: E-W
Address range: 900 to 999
San Lucar Ct
Length: 0.09 miles
Directions: E-W, N-S
Address range: 100 to 199
Directions: E-W, N-S
Address range: 100 to 199
Bluebell Way
Length: 0.07 miles
Direction: E-W
Address range: 900 to 999
Direction: E-W
Address range: 900 to 999
Evelyn Ter W
Length: 0.06 miles
Direction: SE-NW
Direction: SE-NW
Senna Ct
Length: 0.04 miles
Direction: N-S
Address range: 400 to 499
Direction: N-S
Address range: 400 to 499
Red Oak Dr
Length: 0.04 miles
Direction: N-S
Address range: 209 to 248
Direction: N-S
Address range: 209 to 248
Adonis Ct
Length: 0.04 miles
Direction: E-W
Address range: 800 to 899
Direction: E-W
Address range: 800 to 899
Palo Verde Way
Length: 0.04 miles
Direction: E-W
Address range: 416 to 499
Direction: E-W
Address range: 416 to 499
Railroad features:
Union Pacific RR
Length: 1.05 miles
Direction: E-W
Direction: E-W
Other features:
Stream
Length: 0.52 miles
Directions: E-W, N-S, SW-NE
Directions: E-W, N-S, SW-NE