Leeland neighborhood in Upper Marlboro, Maryland (MD), 20774 detailed profile
Settings
X


Business Search - 14 Million verified businesses
Area: 3.558 square miles
Population: 373
Population density:
| Leeland: | 105 people per square mile |
| Upper Marlboro: | 1,858 people per square mile |

- 19650.6%Black
- 17043.9%White
- 143.6%Two or more races
- 71.8%Hispanic or Latino

Median household income in 2022:
| Leeland: | $189,566 |
| Upper Marlboro: | $112,250 |
Distribution of median household income
![Distribution of median household income]()
- 2Less than $10,000
- 2$10,000 to $19,999
- 11$20,000 to $29,999
- 5$30,000 to $39,999
- 19$40,000 to $49,999
- 7$50,000 to $59,999
- 10$60,000 to $74,999
- 8$75,000 to $99,999
- 1$100,000 to $124,999
- 2$125,000 to $149,999
- 47$150,000 to $199,999
- 59$200,000 or more

Distribution of owner-occupied house/condo value
![Distribution of owner-occupied house/condo value]()
- 2Less than $50,000
- 7$250,000 to $299,999
- 1$300,000 to $399,999
- 11$400,000 to $499,999
- 78$500,000 to $749,999
- 50$750,000 to $999,999
- 13$1,000,000 or more

Distribution of rent paid by renters
![Distribution of rent paid by renters]()
- 5$600 to $699
- 74$1,500 to $1,999
- 4$2,000 or more

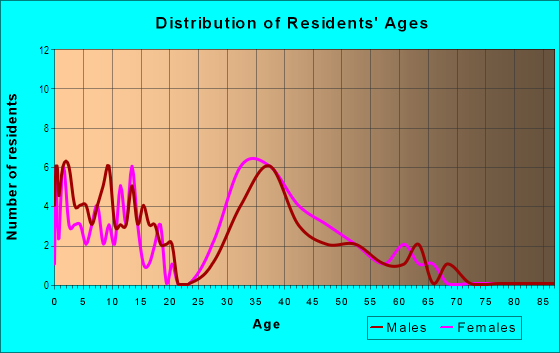
| Males: | 198 |
| Females: | 175 |
Males:
| This neighborhood: | 52.7 years |
| Whole city: | 33.1 years |
| This neighborhood: | 55.0 years |
| Whole city: | 38.4 years |
Average household size:
| Leeland: | 2.4 people |
| Upper Marlboro: | 2.2 people |
Percentage of family households:
| Leeland: | 48.0% |
| Upper Marlboro: | 41.1% |
| Here: | 78.3% |
| Upper Marlboro: | 23.5% |
Percentage of married-couple families with children (among all households):
| Leeland: | 37.1% |
| Upper Marlboro: | 26.0% |
Percentage of single-mother households (among all households):
| Leeland: | 7.7% |
| Upper Marlboro: | 8.0% |
Percentage of never married males 15 years old and over:
Percentage of never married females 15 years old and over:
| Leeland: | 6.5% |
| Upper Marlboro: | 22.9% |
Percentage of never married females 15 years old and over:
| Leeland: | 5.7% |
| town: | 28.5% |
Percentage of people that speak English not well or not at all:
| Leeland: | 1.3% |
| Upper Marlboro: | 0.0% |
Percentage of people born in this state:
Percentage of people born in another U.S. state:
Percentage of native residents but born outside the U.S.:
Percentage of foreign born residents:
| Here: | 32.8% |
| Upper Marlboro: | 30.0% |
Percentage of people born in another U.S. state:
| Leeland: | 58.9% |
| Upper Marlboro: | 67.2% |
Percentage of native residents but born outside the U.S.:
| Here: | 0.9% |
| town: | 0.7% |
Percentage of foreign born residents:
| Here: | 7.4% |
| Upper Marlboro: | 2.1% |

Owner-occupied
Renter-occupied


- Rooms in owner-occupied houses and condos in Leeland
- 01 room
- 02 rooms
- 03 rooms
- 04 rooms
- 45 rooms
- 96 rooms
- 47 rooms
- 248 rooms
- 1109+ rooms

- Rooms in renter-occupied apartments in Leeland
- 01 room
- 142 rooms
- 493 rooms
- 134 rooms
- 05 rooms
- 06 rooms
- 37 rooms
- 08 rooms
- 49+ rooms
Owner-occupied
Renter-occupied

- Bedrooms in owner-occupied houses and condos in Leeland
- 0no bedroom
- 01 bedroom
- 02 bedrooms
- 273 bedrooms
- 794 bedrooms
- 455+ bedrooms

- Bedrooms in renter-occupied apartments in Leeland
- 0no bedroom
- 481 bedroom
- 322 bedrooms
- 03 bedrooms
- 04 bedrooms
- 45+ bedrooms
Average number of cars or other vehicles available in houses/condos:
Average number of cars or other vehicles available in apartments:
| This neighborhood: | 4.5 |
| Upper Marlboro: | 2.0 |
Average number of cars or other vehicles available in apartments:
| Here: | 23.4 |
| town: | 1.5 |
Percentage of units with a mortgage:
| Leeland: | 63.7% |
| Upper Marlboro: | 92.5% |
Average estimated value of detached houses in 2022 (95.1% of all units):
| Leeland: | $692,846 |
| Maryland: | $526,819 |

- Year house built in Leeland
- 02020 or later
- 132010 to 2019
- 402000 to 2009
- 661990 to 1999
- 441980 to 1989
- 41970 to 1979
- 121960 to 1969
- 31950 to 1959
- 01940 to 1949
- 111939 or earlier

City-data.com crime index for town in 2020 (higher means more crime):
| City: | 121.5 |
| U.S. average: | 219.5 |
Travel time to work (commute)
![Travel time to work (commute)]()
- 1Less than 5 minutes
- 35 to 9 minutes
- 1210 to 14 minutes
- 315 to 19 minutes
- 7020 to 24 minutes
- 1725 to 29 minutes
- 6330 to 34 minutes
- 4435 to 39 minutes
- 1440 to 44 minutes
- 5145 to 59 minutes
- 4760 to 89 minutes
- 990 or more minutes

Means of transportation to work
![Means of transportation to work]()
- 78.7%151Drove a car alone
- 1.0%2Carpooled
- 12.5%24Subway or elevated rail
- 2.1%4Long-distance train or commuter rail
- 0.5%1Other means
- 20.3%39Worked at home

Time leaving home to go to work
![Time leaving home to go to work]()
- 1812:00 a.m. to 4:59 a.m.
- 195:00 a.m. to 5:29 a.m.
- 265:30 a.m. to 5:59 a.m.
- 406:00 a.m. to 6:29 a.m.
- 296:30 a.m. to 6:59 a.m.
- 497:00 a.m. to 7:29 a.m.
- 467:30 a.m. to 7:59 a.m.
- 718:00 a.m. to 8:29 a.m.
- 188:30 a.m. to 8:59 a.m.
- 109:00 a.m. to 9:59 a.m.
- 910:00 a.m. to 10:59 a.m.
- 411:00 a.m. to 11:59 a.m.
- 512:00 p.m. to 3:59 p.m.
- 134:00 p.m. to 11:59 p.m.

Occupations of males:
- Percentage of males in management occupations (except farmers):
Here: 25.8% town: 15.7%
- Percentage of males in business and financial operations occupations:
Here: 4.7% town: 6.8%
- Percentage of males in computer and mathematical occupations:
Here: 2.2% town: 16.2%
- Percentage of males in architecture and engineering occupations:
Here: 3.0% town: 2.1%
- Percentage of males in life, physical, and social science occupations:
Here: 2.2% town: 0.0%
- Percentage of males in healthcare practitioners and technical occupations:
Here: 1.8% town: 1.0%
- Percentage of males in service occupations:
Here: 20.2% town: 8.4%
- Percentage of males in sales and office occupations:
Here: 11.8% town: 4.2%
- Percentage of males in construction, extraction, and maintenance occupations:
Here: 16.8% town: 3.1%
- Percentage of males in production occupations:
Here: 5.1% town: 0.0%
- Percentage of males in material moving occupations:
Here: 17.2% town: 13.1%
Occupations of females:
- Percentage of females in management occupations (except farmers):
Here: 31.5% town: 19.7%
- Percentage of females in business and financial operations occupations:
Here: 1.5% town: 14.6%
- Percentage of females in computer and mathematical occupations:
Here: 2.2% town: 1.7%
- Percentage of females in community and social services occupations:
Here: 6.4% town: 5.8%
- Percentage of females in education, training, and library occupations:
Here: 27.0% town: 16.7%
- Percentage of females in arts, design, entertainment, sports, and media occupations:
Here: 3.0% town: 0.7%
- Percentage of females in healthcare practitioners and technical occupations:
Here: 9.7% town: 3.7%
- Percentage of females in service occupations:
Here: 2.6% town: 17.7%
- Percentage of females in sales and office occupations:
Here: 23.6% town: 12.6%
- Percentage of females in transportation occupations:
Here: 1.9% town: 0.0%
Percentage of people 16-64 in Armed Forces:
| Leeland: | 2.6% |
| Upper Marlboro: | 1.7% |
Education in this neighborhood (subdivision or community):
- Percentage of people 3 years and older in K-12 schools:
Leeland: 19.3% Upper Marlboro: 16.5%
- Percentage of people 3 years and older in undergraduate colleges:
Leeland: 6.7% Upper Marlboro: 3.1%
- Percentage of people 3 years and older in grad. or professional schools:
Leeland: 1.9% Upper Marlboro: 5.7%
- Percentage of students K-12 enrolled in private schools:
Leeland: 50.0% Upper Marlboro: 29.8%
Percentage of population below poverty level:
| Leeland: | 4.7% |
| Upper Marlboro: | 1.1% |
Median year owner moved in (as recorded in 2022):
| Leeland: | 2003 |
| Upper Marlboro: | 2014 |
Percentage of married-couple families with both working:
| Leeland: | 103.1% |
| Upper Marlboro: | 88.6% |

- 38.9%Utility gas
- 21.5%Bottled, tank, or LP gas
- 21.5%Electricity
- 11.9%Other fuel
- 3.3%Fuel oil, kerosene, etc.
- 1.6%Wood
- 1.1%Solar energy
Highways in this neighborhood:
Blue Star Memorial Hwy (US Hwy 301, Crain Hwy)
Length: 2.16 miles
Direction: N-S
Address range: 500 to 898
Direction: N-S
Address range: 500 to 898
Roads and streets:
Prince Georges Blvd
Length: 3.17 miles
Directions: N-S, SE-NW, SW-NE
Address range: 300 to 730
Directions: N-S, SE-NW, SW-NE
Address range: 300 to 730
Leeland Rd
Length: 2.02 miles
Directions: E-W, N-S, SE-NW
Address range: 14705 to 16099
Directions: E-W, N-S, SE-NW
Address range: 14705 to 16099
Commerce Dr
Length: 1.00 miles
Directions: N-S, SE-NW, SW-NE
Address range: 201 to 901
Directions: N-S, SE-NW, SW-NE
Address range: 201 to 901
Trade Zone Ave
Length: 0.93 miles
Direction: E-W
Address range: 15900 to 116298
Direction: E-W
Address range: 15900 to 116298
Oak Grove Rd
Length: 0.91 miles
Direction: E-W
Address range: 13511 to 14890
Direction: E-W
Address range: 13511 to 14890
Willow Brook Pkwy
Length: 0.66 miles
Directions: E-W, N-S, SE-NW, SW-NE
Directions: E-W, N-S, SE-NW, SW-NE
Queens Ct
Length: 0.30 miles
Directions: E-W, SE-NW, SW-NE
Address range: 16108 to 16299
Directions: E-W, SE-NW, SW-NE
Address range: 16108 to 16299
Commerce Ct
Length: 0.15 miles
Direction: SE-NW
Address range: 15801 to 15899
Direction: SE-NW
Address range: 15801 to 15899
Branch Ct
Length: 0.14 miles
Direction: SE-NW
Address range: 16116 to 16299
Direction: SE-NW
Address range: 16116 to 16299
Moores Plains Blvd
Length: 0.07 miles
Direction: N-S
Direction: N-S
Chipping Campden Way
Length: 0.07 miles
Direction: E-W
Direction: E-W
Railroad features:
Conrail RR (Csx RR)
Length: 0.92 miles
Direction: N-S
Direction: N-S
Other features:
Collington Br
Length: 3.34 miles
Directions: E-W, N-S, SE-NW, SW-NE
Directions: E-W, N-S, SE-NW, SW-NE
Stream
Length: 2.27 miles
Directions: E-W, N-S, SE-NW, SW-NE
Directions: E-W, N-S, SE-NW, SW-NE
East Branch Collington Br
Length: 0.09 miles
Directions: N-S, SW-NE
Directions: N-S, SW-NE