Leyva neighborhood in San Jose, California (CA), 95122 detailed profile
Settings
X


Business Search - 14 Million verified businesses
Area: 0.107 square miles
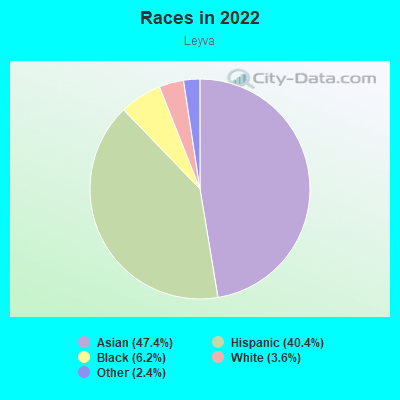
Population: 599
Population density:
| Leyva: | 5,581 people per square mile |
| San Jose: | 5,554 people per square mile |

- 29147.4%Asian
- 24840.4%Hispanic or Latino
- 386.2%Black
- 223.6%White
- 152.4%Some other race
Median household income in 2022:
| Leyva: | $96,877 |
| San Jose: | $133,835 |
Distribution of median household income
![Distribution of median household income]()
- 4Less than $10,000
- 11$10,000 to $19,999
- 7$20,000 to $29,999
- 20$30,000 to $39,999
- 8$40,000 to $49,999
- 16$50,000 to $59,999
- 7$60,000 to $74,999
- 19$75,000 to $99,999
- 20$100,000 to $124,999
- 13$125,000 to $149,999
- 17$150,000 to $199,999
- 27$200,000 or more

Distribution of owner-occupied house/condo value
![Distribution of owner-occupied house/condo value]()
- 4$150,000 to $199,999
- 18$200,000 to $249,999
- 3$250,000 to $299,999
- 10$300,000 to $399,999
- 3$400,000 to $499,999
- 24$500,000 to $749,999
- 11$750,000 to $999,999
- 20$1,000,000 or more

Distribution of rent paid by renters
![Distribution of rent paid by renters]()
- 3$100 to $199
- 20$200 to $299
- 10$300 to $399
- 2$400 to $499
- 3$500 to $599
- 1$600 to $699
- 3$800 to $899
- 2$900 to $999
- 17$1,000 to $1,249
- 4$1,250 to $1,499
- 4$1,500 to $1,999
- 47$2,000 or more

Median rent in 2022:
| Leyva: | $2,605 |
| San Jose: | $2,001 |
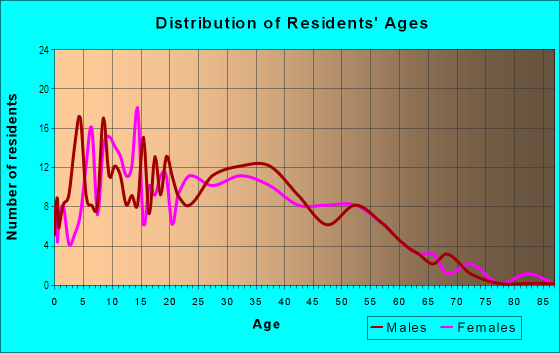
| Males: | 278 |
| Females: | 321 |
Males:
| This neighborhood: | 31.0 years |
| Whole city: | 37.6 years |
| This neighborhood: | 33.9 years |
| Whole city: | 39.1 years |
Average household size:
| Leyva: | 34.3 people |
| San Jose: | 2.9 people |
Percentage of family households:
| Leyva: | 45.5% |
| San Jose: | 49.9% |
| Here: | 57.5% |
| San Jose: | 53.0% |
Percentage of married-couple families with children (among all households):
| Leyva: | 22.3% |
| San Jose: | 25.8% |
Percentage of single-mother households (among all households):
| Leyva: | 10.1% |
| San Jose: | 5.2% |
Percentage of never married males 15 years old and over:
Percentage of never married females 15 years old and over:
| Leyva: | 23.7% |
| San Jose: | 20.9% |
Percentage of never married females 15 years old and over:
| Leyva: | 24.3% |
| city: | 16.7% |
Percentage of people that speak English not well or not at all:
| Leyva: | 16.1% |
| San Jose: | 11.4% |
Percentage of people born in this state:
Percentage of people born in another U.S. state:
Percentage of native residents but born outside the U.S.:
Percentage of foreign born residents:
| Here: | 41.3% |
| San Jose: | 46.1% |
Percentage of people born in another U.S. state:
| Leyva: | 3.9% |
| San Jose: | 10.4% |
Percentage of native residents but born outside the U.S.:
| Here: | 2.6% |
| city: | 1.7% |
Percentage of foreign born residents:
| Here: | 52.3% |
| San Jose: | 41.8% |
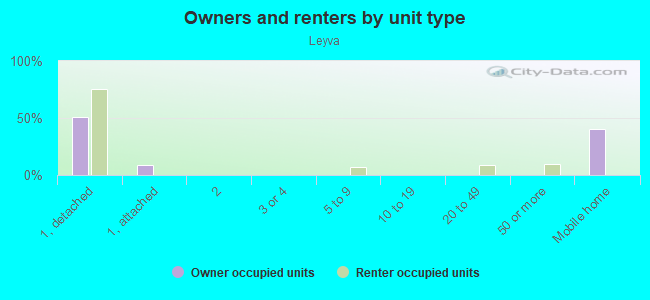
Owner-occupied
Renter-occupied

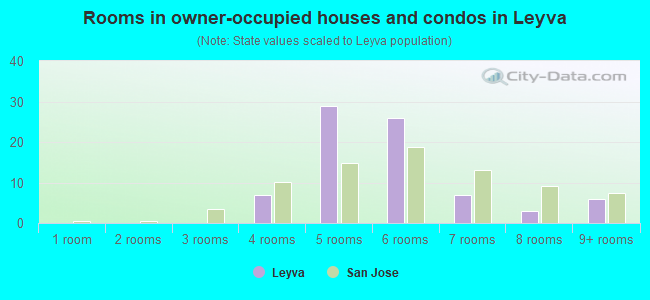
- Rooms in owner-occupied houses and condos in Leyva
- 01 room
- 02 rooms
- 03 rooms
- 74 rooms
- 295 rooms
- 266 rooms
- 77 rooms
- 38 rooms
- 69+ rooms
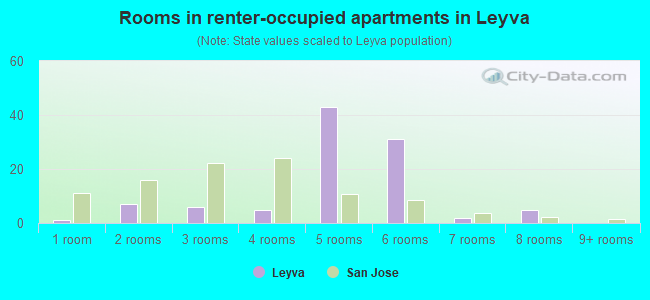
- Rooms in renter-occupied apartments in Leyva
- 11 room
- 72 rooms
- 63 rooms
- 54 rooms
- 435 rooms
- 316 rooms
- 27 rooms
- 58 rooms
- 09+ rooms
Owner-occupied
Renter-occupied
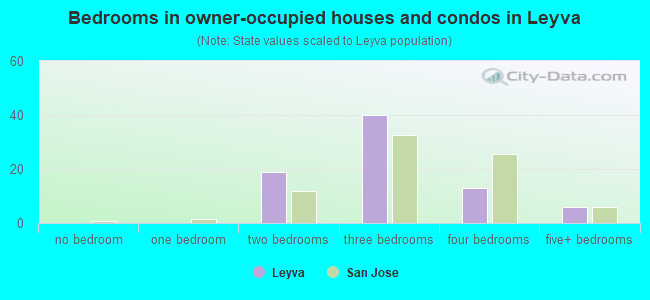
- Bedrooms in owner-occupied houses and condos in Leyva
- 0no bedroom
- 01 bedroom
- 192 bedrooms
- 403 bedrooms
- 134 bedrooms
- 65+ bedrooms
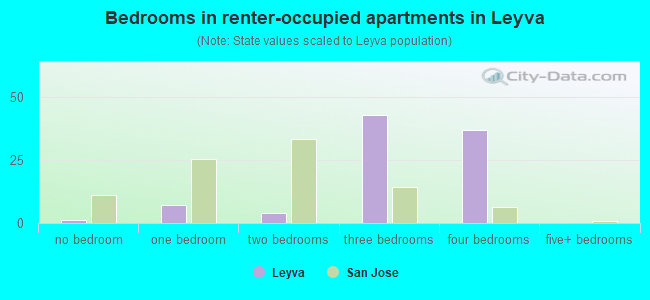
- Bedrooms in renter-occupied apartments in Leyva
- 1no bedroom
- 71 bedroom
- 42 bedrooms
- 433 bedrooms
- 374 bedrooms
- 05+ bedrooms
Average number of cars or other vehicles available in houses/condos:
Average number of cars or other vehicles available in apartments:
| This neighborhood: | 2.5 |
| San Jose: | 2.3 |
Average number of cars or other vehicles available in apartments:
| Here: | 1.6 |
| city: | 1.6 |
Percentage of units with a mortgage:
| Leyva: | 69.2% |
| San Jose: | 66.9% |
Housing prices:
- Average estimated value of detached houses in 2022 (79.1% of all units):
Leyva: $769,435 San Jose: $1,532,815
- Average estimated value of mobile home in 2022 (20.9% of all units):
Leyva: $253,112 San Jose: $237,683
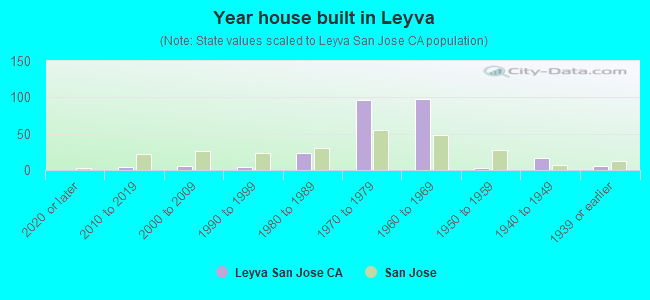
- Year house built in Leyva
- 02020 or later
- 42010 to 2019
- 52000 to 2009
- 41990 to 1999
- 231980 to 1989
- 971970 to 1979
- 981960 to 1969
- 31950 to 1959
- 161940 to 1949
- 51939 or earlier
City-data.com crime index for city in 2020 (higher means more crime):
| City: | 268.4 |
| U.S. average: | 219.5 |
Travel time to work (commute)
![Travel time to work (commute)]()
- 95 to 9 minutes
- 2410 to 14 minutes
- 3315 to 19 minutes
- 6320 to 24 minutes
- 2025 to 29 minutes
- 6330 to 34 minutes
- 135 to 39 minutes
- 240 to 44 minutes
- 1045 to 59 minutes
- 2360 to 89 minutes
- 990 or more minutes

Means of transportation to work
![Means of transportation to work]()
- 77.2%206Drove a car alone
- 12.7%34Carpooled
- 7.1%19Subway or elevated rail
- 3.7%10Light rail, streetcar or trolley
- 0.4%1Taxi
- 0.7%2Walked
- 3.4%9Other means
- 9.4%25Worked at home

Time leaving home to go to work
![Time leaving home to go to work]()
- 912:00 a.m. to 4:59 a.m.
- 225:00 a.m. to 5:29 a.m.
- 115:30 a.m. to 5:59 a.m.
- 286:00 a.m. to 6:29 a.m.
- 86:30 a.m. to 6:59 a.m.
- 297:00 a.m. to 7:29 a.m.
- 217:30 a.m. to 7:59 a.m.
- 358:00 a.m. to 8:29 a.m.
- 88:30 a.m. to 8:59 a.m.
- 279:00 a.m. to 9:59 a.m.
- 510:00 a.m. to 10:59 a.m.
- 611:00 a.m. to 11:59 a.m.
- 3612:00 p.m. to 3:59 p.m.
- 164:00 p.m. to 11:59 p.m.

Occupations of males:
- Percentage of males in business and financial operations occupations:
Here: 1.5% city: 4.6%
- Percentage of males in architecture and engineering occupations:
Here: 2.4% city: 10.2%
- Percentage of males in life, physical, and social science occupations:
Here: 2.2% city: 1.1%
- Percentage of males in legal occupations:
Here: 12.9% city: 0.8%
- Percentage of males in arts, design, entertainment, sports, and media occupations:
Here: 3.3% city: 1.8%
- Percentage of males in healthcare practitioners and technical occupations:
Here: 3.4% city: 2.0%
- Percentage of males in service occupations:
Here: 41.9% city: 12.7%
- Percentage of males in sales and office occupations:
Here: 4.6% city: 12.8%
- Percentage of males in farming, fishing, and forestry occupations:
Here: 1.2% city: 0.4%
- Percentage of males in construction, extraction, and maintenance occupations:
Here: 7.5% city: 7.8%
- Percentage of males in production occupations:
Here: 4.7% city: 5.5%
- Percentage of males in transportation occupations:
Here: 14.1% city: 3.6%
- Percentage of males in material moving occupations:
Here: 4.2% city: 3.1%
Occupations of females:
- Percentage of females in business and financial operations occupations:
Here: 3.6% city: 8.6%
- Percentage of females in architecture and engineering occupations:
Here: 4.2% city: 2.8%
- Percentage of females in life, physical, and social science occupations:
Here: 13.3% city: 1.7%
- Percentage of females in community and social services occupations:
Here: 2.4% city: 1.8%
- Percentage of females in service occupations:
Here: 52.2% city: 21.7%
- Percentage of females in sales and office occupations:
Here: 30.8% city: 22.0%
- Percentage of females in material moving occupations:
Here: 3.8% city: 1.5%
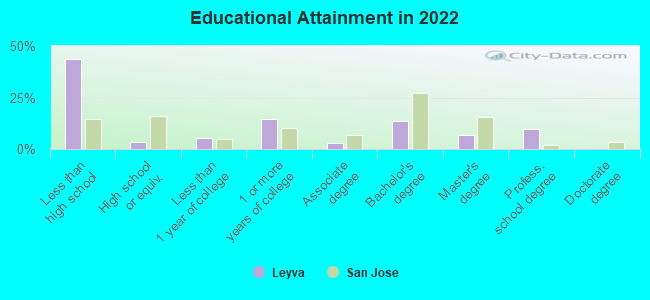
Education in this neighborhood (subdivision or community):
- Percentage of people 3 years and older in K-12 schools:
Leyva: 24.5% San Jose: 16.1%
- Percentage of people 3 years and older in undergraduate colleges:
Leyva: 12.9% San Jose: 6.5%
- Percentage of people 3 years and older in grad. or professional schools:
Leyva: 8.8% San Jose: 2.0%
- Percentage of students K-12 enrolled in private schools:
Leyva: 9.6% San Jose: 14.9%
Percentage of population below poverty level:
| Leyva: | 16.5% |
| San Jose: | 9.0% |
Median year owner moved in (as recorded in 2022):
Median year renter moved in (as recorded in 2022):
| Leyva: | 2001 |
| San Jose: | 2008 |
Median year renter moved in (as recorded in 2022):
| Leyva: | 2014 |
| San Jose: | 2020 |
Percentage of married-couple families with both working:
| Leyva: | 65.5% |
| San Jose: | 72.5% |
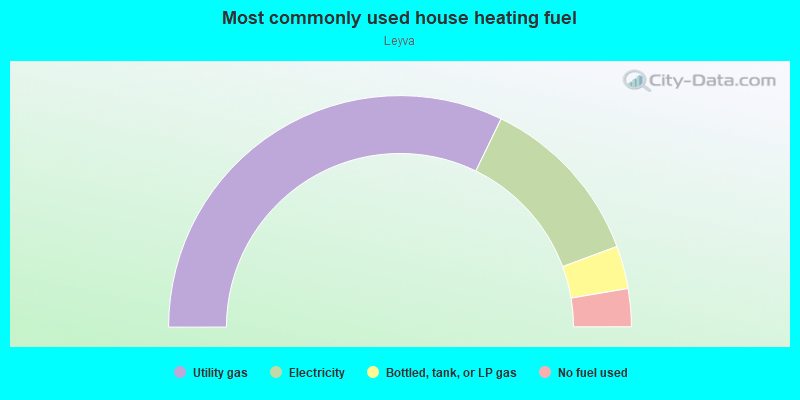
- 64.4%Utility gas
- 24.3%Electricity
- 6.0%Bottled, tank, or LP gas
- 5.3%No fuel used
Roads and streets:
Kyra Cir
Length: 0.22 miles
Directions: E-W, N-S, SE-NW, SW-NE
Address range: 1700 to 1899
Directions: E-W, N-S, SE-NW, SW-NE
Address range: 1700 to 1899
Monrovia Dr
Length: 0.20 miles
Direction: E-W
Address range: 1800 to 1899
Direction: E-W
Address range: 1800 to 1899
Atwood Dr
Length: 0.20 miles
Directions: N-S, SE-NW
Address range: 2900 to 2999
Directions: N-S, SE-NW
Address range: 2900 to 2999
Barberry Ln
Length: 0.17 miles
Directions: E-W, SW-NE
Directions: E-W, SW-NE
Vanport Dr ()
Length: 0.16 miles
Directions: N-S, SE-NW, SW-NE
Address range: 1758 to 2975
Directions: N-S, SE-NW, SW-NE
Address range: 1758 to 2975
Tustin Dr
Length: 0.08 miles
Directions: E-W, SW-NE
Address range: 1800 to 1899
Directions: E-W, SW-NE
Address range: 1800 to 1899
Bradbury Dr
Length: 0.05 miles
Direction: N-S
Address range: 2900 to 2919
Direction: N-S
Address range: 2900 to 2919
(Vanport Ct)
Length: 0.03 miles
Directions: E-W, SE-NW
Address range: 1700 to 1799
Directions: E-W, SE-NW
Address range: 1700 to 1799