Lincolnshire Historic District neighborhood in Evansville, Indiana (IN), 47714 detailed profile
Settings
X


Business Search - 14 Million verified businesses
Area: 0.074 square miles
Population: 502
Population density:
| Lincolnshire Historic District: | 6,777 people per square mile |
| Evansville: | 2,912 people per square mile |

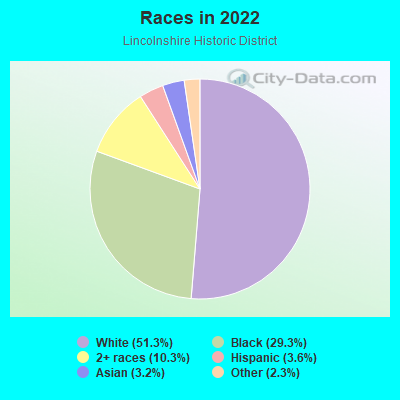
- 27051.3%White
- 15429.3%Black
- 5410.3%Two or more races
- 193.6%Hispanic or Latino
- 173.2%Asian
- 122.3%Some other race
Median household income in 2022:
| Lincolnshire Historic District: | $57,560 |
| Evansville: | $48,127 |
Distribution of median household income
![Distribution of median household income]()
- 15Less than $10,000
- 33$10,000 to $19,999
- 34$20,000 to $29,999
- 20$30,000 to $39,999
- 19$40,000 to $49,999
- 28$50,000 to $59,999
- 24$60,000 to $74,999
- 25$75,000 to $99,999
- 15$100,000 to $124,999
- 27$125,000 to $149,999
- 29$150,000 to $199,999
- 14$200,000 or more

Distribution of owner-occupied house/condo value
![Distribution of owner-occupied house/condo value]()
- 45Less than $50,000
- 52$50,000 to $99,999
- 16$100,000 to $149,999
- 46$150,000 to $199,999
- 13$200,000 to $249,999
- 3$250,000 to $299,999
- 19$300,000 to $399,999
- 11$400,000 to $499,999
- 3$500,000 to $749,999
- 3$750,000 to $999,999

Distribution of rent paid by renters
![Distribution of rent paid by renters]()
- 6Less than $100
- 3$200 to $299
- 14$300 to $399
- 21$400 to $499
- 24$500 to $599
- 32$600 to $699
- 21$700 to $799
- 23$800 to $899
- 7$900 to $999
- 12$1,000 to $1,249
- 5$1,250 to $1,499
- 11$1,500 to $1,999

Median rent in 2022:
| Lincolnshire Historic District: | $719 |
| Evansville: | $691 |
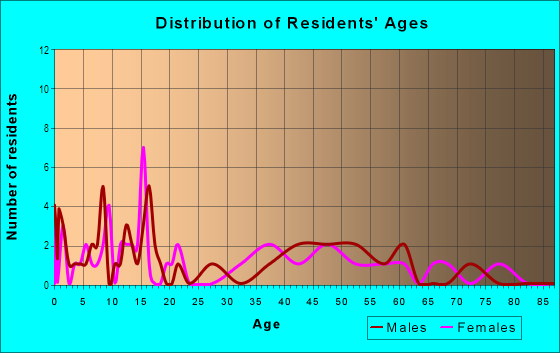
| Males: | 259 |
| Females: | 242 |
Males:
| This neighborhood: | 32.9 years |
| Whole city: | 36.6 years |
| This neighborhood: | 34.4 years |
| Whole city: | 38.9 years |
Average household size:
| Lincolnshire Historic District: | 2.3 people |
| Evansville: | 2.1 people |
Percentage of family households:
| Lincolnshire Historic District: | 40.8% |
| Evansville: | 38.3% |
| Here: | 24.5% |
| Evansville: | 33.7% |
Percentage of married-couple families with children (among all households):
| Lincolnshire Historic District: | 19.8% |
| Evansville: | 25.3% |
Percentage of single-mother households (among all households):
| Lincolnshire Historic District: | 17.1% |
| Evansville: | 15.6% |
Percentage of never married males 15 years old and over:
Percentage of never married females 15 years old and over:
| Lincolnshire Historic District: | 29.0% |
| Evansville: | 19.5% |
Percentage of never married females 15 years old and over:
| Lincolnshire Historic District: | 21.5% |
| city: | 17.0% |
Percentage of people that speak English not well or not at all:
| Lincolnshire Historic District: | 0.0% |
| Evansville: | 0.7% |
Percentage of people born in this state:
Percentage of people born in another U.S. state:
Percentage of native residents but born outside the U.S.:
Percentage of foreign born residents:
| Here: | 63.0% |
| Evansville: | 70.5% |
Percentage of people born in another U.S. state:
| Lincolnshire Historic District: | 29.0% |
| Evansville: | 25.5% |
Percentage of native residents but born outside the U.S.:
| Here: | 2.6% |
| city: | 0.8% |
Percentage of foreign born residents:
| Here: | 5.5% |
| Evansville: | 3.2% |
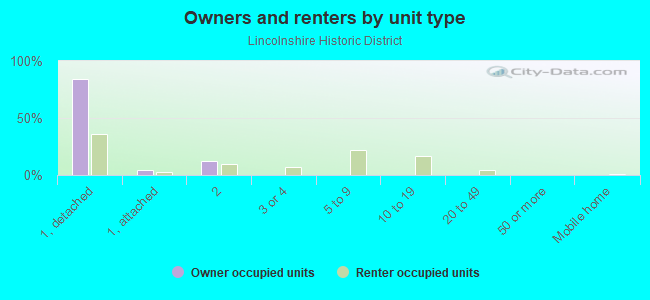
Owner-occupied
Renter-occupied

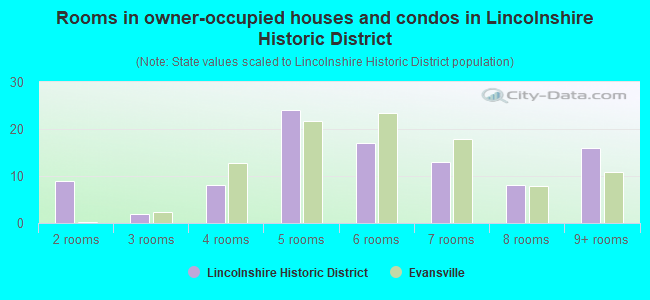
- Rooms in owner-occupied houses and condos in Lincolnshire Historic District
- 01 room
- 92 rooms
- 23 rooms
- 84 rooms
- 245 rooms
- 176 rooms
- 137 rooms
- 88 rooms
- 169+ rooms
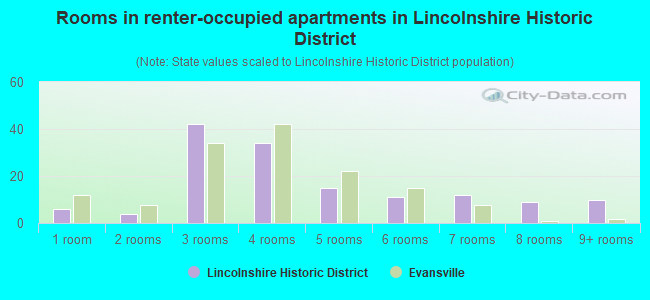
- Rooms in renter-occupied apartments in Lincolnshire Historic District
- 61 room
- 42 rooms
- 423 rooms
- 344 rooms
- 155 rooms
- 116 rooms
- 127 rooms
- 98 rooms
- 109+ rooms
Owner-occupied
Renter-occupied
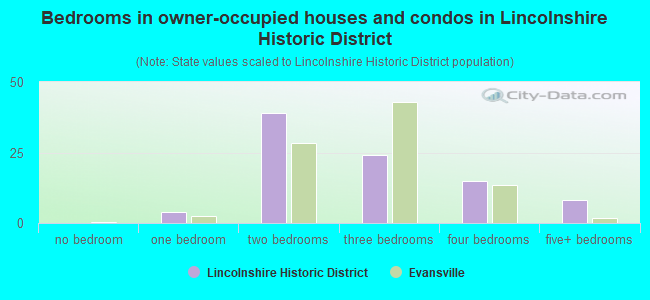
- Bedrooms in owner-occupied houses and condos in Lincolnshire Historic District
- 0no bedroom
- 41 bedroom
- 392 bedrooms
- 243 bedrooms
- 154 bedrooms
- 85+ bedrooms
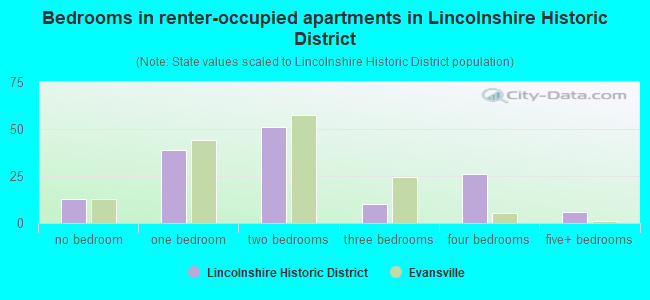
- Bedrooms in renter-occupied apartments in Lincolnshire Historic District
- 13no bedroom
- 391 bedroom
- 512 bedrooms
- 103 bedrooms
- 264 bedrooms
- 65+ bedrooms
Average number of cars or other vehicles available in houses/condos:
Average number of cars or other vehicles available in apartments:
| This neighborhood: | 1.9 |
| Evansville: | 1.8 |
Average number of cars or other vehicles available in apartments:
| Here: | 1.0 |
| city: | 1.1 |
Percentage of units with a mortgage:
| Lincolnshire Historic District: | 79.4% |
| Evansville: | 58.5% |
Average estimated value of detached houses in 2022 (58.6% of all units):
| Lincolnshire Historic District: | $137,982 |
| Indiana: | $257,916 |
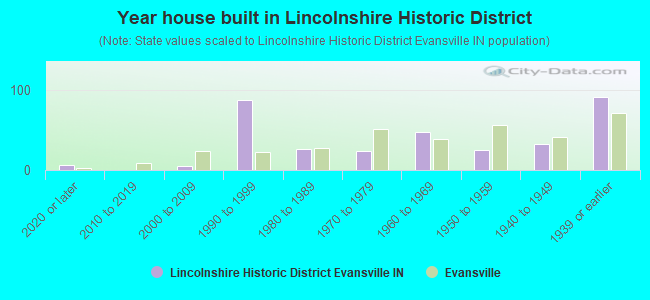
- Year house built in Lincolnshire Historic District
- 62020 or later
- 02010 to 2019
- 52000 to 2009
- 881990 to 1999
- 261980 to 1989
- 241970 to 1979
- 471960 to 1969
- 251950 to 1959
- 321940 to 1949
- 911939 or earlier
City-data.com crime index for city in 2020 (higher means more crime):
| City: | 440.8 |
| U.S. average: | 219.5 |
Travel time to work (commute)
![Travel time to work (commute)]()
- 7Less than 5 minutes
- 285 to 9 minutes
- 5510 to 14 minutes
- 2715 to 19 minutes
- 3020 to 24 minutes
- 525 to 29 minutes
- 1230 to 34 minutes
- 435 to 39 minutes
- 140 to 44 minutes
- 1345 to 59 minutes
- 260 to 89 minutes
- 490 or more minutes

Means of transportation to work
![Means of transportation to work]()
- 76.8%166Drove a car alone
- 11.1%24Carpooled
- 7.4%16Bus
- 13.4%29Walked
- 0.5%1Other means
- 3.2%7Worked at home

Time leaving home to go to work
![Time leaving home to go to work]()
- 412:00 a.m. to 4:59 a.m.
- 125:00 a.m. to 5:29 a.m.
- 85:30 a.m. to 5:59 a.m.
- 96:00 a.m. to 6:29 a.m.
- 156:30 a.m. to 6:59 a.m.
- 317:00 a.m. to 7:29 a.m.
- 207:30 a.m. to 7:59 a.m.
- 178:00 a.m. to 8:29 a.m.
- 118:30 a.m. to 8:59 a.m.
- 69:00 a.m. to 9:59 a.m.
- 1010:00 a.m. to 10:59 a.m.
- 611:00 a.m. to 11:59 a.m.
- 712:00 p.m. to 3:59 p.m.
- 194:00 p.m. to 11:59 p.m.

Occupations of males:
- Percentage of males in management occupations (except farmers):
Here: 11.0% city: 8.4%
- Percentage of males in computer and mathematical occupations:
Here: 4.9% city: 3.0%
- Percentage of males in architecture and engineering occupations:
Here: 2.9% city: 3.0%
- Percentage of males in education, training, and library occupations:
Here: 3.7% city: 2.7%
- Percentage of males in arts, design, entertainment, sports, and media occupations:
Here: 2.5% city: 1.4%
- Percentage of males in service occupations:
Here: 6.4% city: 15.9%
- Percentage of males in sales and office occupations:
Here: 14.5% city: 14.7%
- Percentage of males in construction, extraction, and maintenance occupations:
Here: 5.4% city: 7.3%
- Percentage of males in production occupations:
Here: 12.9% city: 14.9%
- Percentage of males in transportation occupations:
Here: 9.4% city: 7.3%
- Percentage of males in material moving occupations:
Here: 15.2% city: 8.2%
Occupations of females:
- Percentage of females in management occupations (except farmers):
Here: 8.5% city: 6.4%
- Percentage of females in business and financial operations occupations:
Here: 4.3% city: 4.6%
- Percentage of females in community and social services occupations:
Here: 1.3% city: 2.7%
- Percentage of females in education, training, and library occupations:
Here: 9.1% city: 5.7%
- Percentage of females in arts, design, entertainment, sports, and media occupations:
Here: 1.6% city: 1.3%
- Percentage of females in healthcare practitioners and technical occupations:
Here: 4.7% city: 8.9%
- Percentage of females in service occupations:
Here: 41.3% city: 26.1%
- Percentage of females in sales and office occupations:
Here: 20.2% city: 30.9%
- Percentage of females in production occupations:
Here: 8.5% city: 5.3%
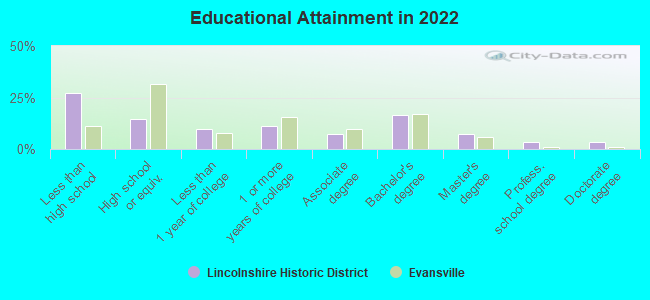
Education in this neighborhood (subdivision or community):
- Percentage of people 3 years and older in K-12 schools:
Lincolnshire Historic District: 28.1% Evansville: 15.5%
- Percentage of people 3 years and older in undergraduate colleges:
Lincolnshire Historic District: 8.3% Evansville: 5.1%
- Percentage of people 3 years and older in grad. or professional schools:
Lincolnshire Historic District: 1.2% Evansville: 0.8%
- Percentage of students K-12 enrolled in private schools:
Lincolnshire Historic District: 61.0% Evansville: 15.2%
Percentage of population below poverty level:
| Lincolnshire Historic District: | 12.4% |
| Evansville: | 19.3% |
Median year owner moved in (as recorded in 2022):
Median year renter moved in (as recorded in 2022):
| Lincolnshire Historic District: | 2012 |
| Evansville: | 2011 |
Median year renter moved in (as recorded in 2022):
| Lincolnshire Historic District: | 2018 |
| Evansville: | 2020 |
Percentage of married-couple families with both working:
| Lincolnshire Historic District: | 98.7% |
| Evansville: | 71.5% |
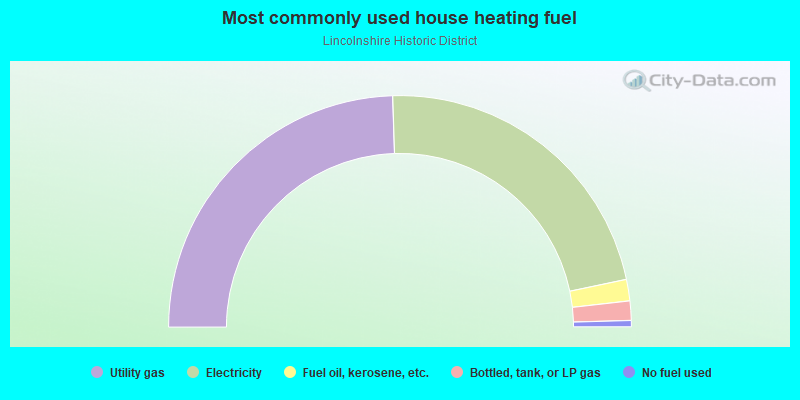
- 49.0%Utility gas
- 44.4%Electricity
- 3.0%Fuel oil, kerosene, etc.
- 2.7%Bottled, tank, or LP gas
- 0.9%No fuel used
Roads and streets:
Lodge Ave
Length: 0.37 miles
Direction: N-S
Address range: 700 to 999
Direction: N-S
Address range: 700 to 999
E Powell Ave
Length: 0.21 miles
Direction: E-W
Address range: 1300 to 1399
Direction: E-W
Address range: 1300 to 1399
Washington Ave
Length: 0.15 miles
Direction: E-W
Address range: 1300 to 1399
Direction: E-W
Address range: 1300 to 1399
Bellemeade Ave
Length: 0.12 miles
Direction: E-W
Address range: 1400 to 1499
Direction: E-W
Address range: 1400 to 1499
S Willow Rd
Length: 0.12 miles
Direction: N-S
Address range: 700 to 799
Direction: N-S
Address range: 700 to 799
S Bennighof Ave
Length: 0.10 miles
Direction: N-S
Address range: 624 to 699
Direction: N-S
Address range: 624 to 699
Southeast Blvd
Length: 0.06 miles
Directions: E-W, SE-NW
Directions: E-W, SE-NW
Bayard Park Dr
Length: 0.04 miles
Direction: E-W
Address range: 1353 to 1399
Direction: E-W
Address range: 1353 to 1399