Lincolnwood Estates neighborhood in Rockford, Illinois (IL), 61102 detailed profile
Settings
X


Business Search - 14 Million verified businesses
Area: 0.131 square miles
Population: 503
Population density:
| Lincolnwood Estates: | 3,831 people per square mile |
| Rockford: | 2,604 people per square mile |

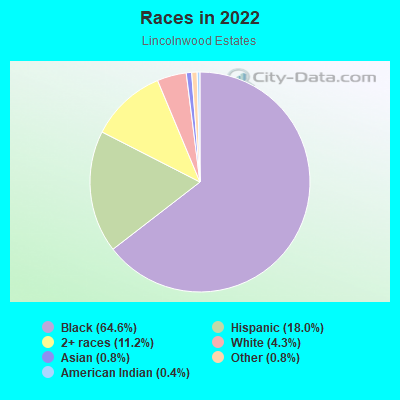
- 33064.6%Black
- 9218.0%Hispanic or Latino
- 5711.2%Two or more races
- 224.3%White
- 40.8%Asian
- 40.8%Some other race
- 20.4%American Indian
Distribution of median household income
![Distribution of median household income]()
- 12Less than $10,000
- 46$10,000 to $19,999
- 42$20,000 to $29,999
- 37$30,000 to $39,999
- 15$40,000 to $49,999
- 6$50,000 to $59,999
- 31$60,000 to $74,999
- 20$75,000 to $99,999
- 12$100,000 to $124,999
- 17$125,000 to $149,999
- 3$150,000 to $199,999
- 1$200,000 or more

Distribution of owner-occupied house/condo value
![Distribution of owner-occupied house/condo value]()
- 65Less than $50,000
- 63$50,000 to $99,999
- 7$100,000 to $149,999
- 13$150,000 to $199,999
- 2$200,000 to $249,999
- 2$300,000 to $399,999

Distribution of rent paid by renters
![Distribution of rent paid by renters]()
- 23$100 to $199
- 5$200 to $299
- 25$300 to $399
- 29$400 to $499
- 82$500 to $599
- 15$600 to $699
- 73$700 to $799
- 30$800 to $899
- 18$900 to $999
- 10$1,000 to $1,249
- 3$1,500 to $1,999

Median rent in 2022:
| Lincolnwood Estates: | $605 |
| Rockford: | $728 |
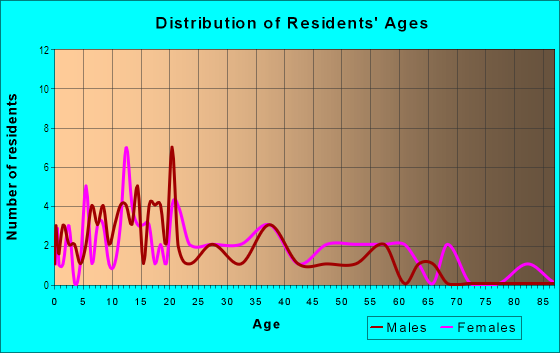
| Males: | 225 |
| Females: | 277 |
Males:
| This neighborhood: | 34.8 years |
| Whole city: | 35.2 years |
| This neighborhood: | 31.4 years |
| Whole city: | 39.3 years |
Average household size:
| Lincolnwood Estates: | 3.0 people |
| Rockford: | 2.4 people |
Percentage of family households:
| Lincolnwood Estates: | 71.5% |
| Rockford: | 39.3% |
| Here: | 30.9% |
| Rockford: | 36.1% |
Percentage of married-couple families with children (among all households):
| Lincolnwood Estates: | 10.5% |
| Rockford: | 19.8% |
Percentage of single-mother households (among all households):
| Lincolnwood Estates: | 19.9% |
| Rockford: | 16.9% |
Percentage of never married males 15 years old and over:
Percentage of never married females 15 years old and over:
| Lincolnwood Estates: | 20.6% |
| Rockford: | 20.2% |
Percentage of never married females 15 years old and over:
| Lincolnwood Estates: | 23.5% |
| city: | 19.9% |
Percentage of people that speak English not well or not at all:
| Lincolnwood Estates: | 2.2% |
| Rockford: | 2.9% |
Percentage of people born in this state:
Percentage of people born in another U.S. state:
Percentage of native residents but born outside the U.S.:
Percentage of foreign born residents:
| Here: | 77.5% |
| Rockford: | 70.1% |
Percentage of people born in another U.S. state:
| Lincolnwood Estates: | 14.6% |
| Rockford: | 17.3% |
Percentage of native residents but born outside the U.S.:
| Here: | 2.8% |
| city: | 2.2% |
Percentage of foreign born residents:
| Here: | 7.5% |
| Rockford: | 10.4% |
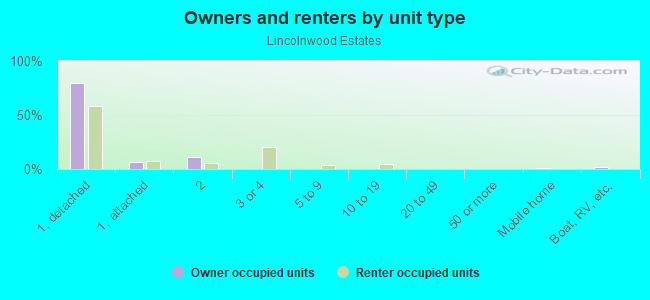
Owner-occupied
Renter-occupied

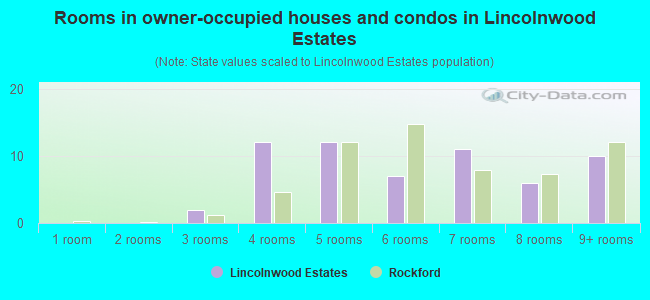
- Rooms in owner-occupied houses and condos in Lincolnwood Estates
- 01 room
- 02 rooms
- 23 rooms
- 124 rooms
- 125 rooms
- 76 rooms
- 117 rooms
- 68 rooms
- 109+ rooms
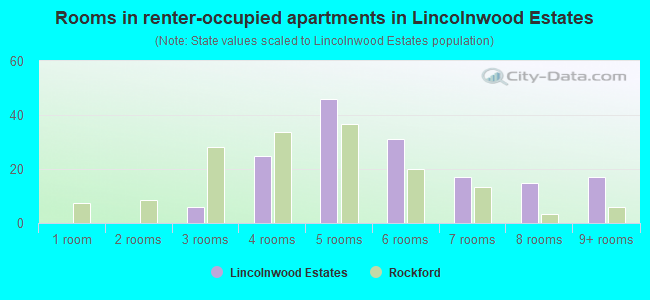
- Rooms in renter-occupied apartments in Lincolnwood Estates
- 01 room
- 02 rooms
- 63 rooms
- 254 rooms
- 465 rooms
- 316 rooms
- 177 rooms
- 158 rooms
- 179+ rooms
Owner-occupied
Renter-occupied
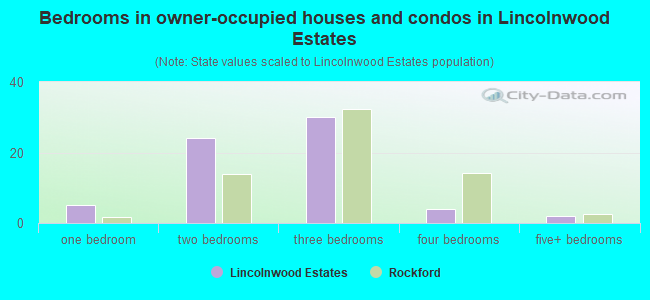
- Bedrooms in owner-occupied houses and condos in Lincolnwood Estates
- 0no bedroom
- 51 bedroom
- 242 bedrooms
- 303 bedrooms
- 44 bedrooms
- 25+ bedrooms
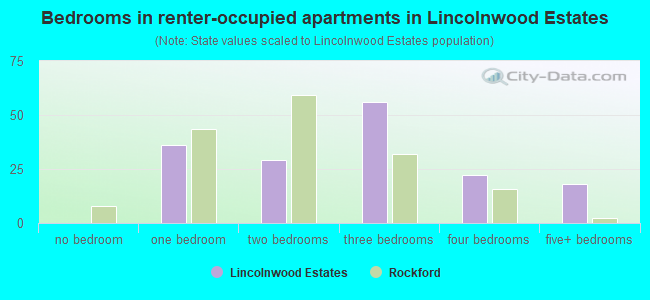
- Bedrooms in renter-occupied apartments in Lincolnwood Estates
- 0no bedroom
- 361 bedroom
- 292 bedrooms
- 563 bedrooms
- 224 bedrooms
- 185+ bedrooms
Average number of cars or other vehicles available in houses/condos:
Average number of cars or other vehicles available in apartments:
| This neighborhood: | 1.9 |
| Rockford: | 1.9 |
Average number of cars or other vehicles available in apartments:
| Here: | 1.3 |
| city: | 1.1 |
Percentage of units with a mortgage:
| Lincolnwood Estates: | 49.4% |
| Rockford: | 63.1% |
Average estimated value of detached houses in 2022 (85.6% of all units):
| Lincolnwood Estates: | $39,448 |
| Illinois: | $310,164 |
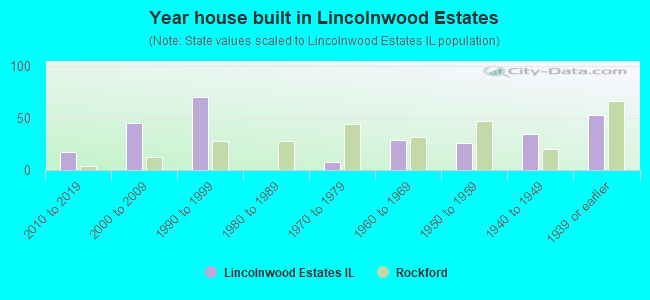
- Year house built in Lincolnwood Estates
- 02020 or later
- 172010 to 2019
- 452000 to 2009
- 701990 to 1999
- 01980 to 1989
- 81970 to 1979
- 291960 to 1969
- 261950 to 1959
- 351940 to 1949
- 531939 or earlier
City-data.com crime index for city in 2020 (higher means more crime):
| City: | 525.8 |
| U.S. average: | 219.5 |
Travel time to work (commute)
![Travel time to work (commute)]()
- 105 to 9 minutes
- 1410 to 14 minutes
- 4515 to 19 minutes
- 2020 to 24 minutes
- 1025 to 29 minutes
- 1830 to 34 minutes
- 235 to 39 minutes
- 1140 to 44 minutes
- 4345 to 59 minutes
- 260 to 89 minutes
- 990 or more minutes

Means of transportation to work
![Means of transportation to work]()
- 73.3%126Drove a car alone
- 17.5%30Carpooled
- 2.3%4Bus
- 1.2%2Walked
- 0.6%1Other means
- 9.9%17Worked at home

Time leaving home to go to work
![Time leaving home to go to work]()
- 2112:00 a.m. to 4:59 a.m.
- 25:00 a.m. to 5:29 a.m.
- 135:30 a.m. to 5:59 a.m.
- 236:00 a.m. to 6:29 a.m.
- 76:30 a.m. to 6:59 a.m.
- 107:00 a.m. to 7:29 a.m.
- 77:30 a.m. to 7:59 a.m.
- 108:00 a.m. to 8:29 a.m.
- 28:30 a.m. to 8:59 a.m.
- 69:00 a.m. to 9:59 a.m.
- 1610:00 a.m. to 10:59 a.m.
- 311:00 a.m. to 11:59 a.m.
- 1112:00 p.m. to 3:59 p.m.
- 194:00 p.m. to 11:59 p.m.

Occupations of males:
- Percentage of males in management occupations (except farmers):
Here: 15.0% city: 7.0%
- Percentage of males in computer and mathematical occupations:
Here: 2.1% city: 2.7%
- Percentage of males in service occupations:
Here: 9.2% city: 12.6%
- Percentage of males in sales and office occupations:
Here: 8.2% city: 16.0%
- Percentage of males in construction, extraction, and maintenance occupations:
Here: 8.3% city: 6.8%
- Percentage of males in production occupations:
Here: 4.8% city: 18.7%
- Percentage of males in transportation occupations:
Here: 5.3% city: 6.0%
- Percentage of males in material moving occupations:
Here: 46.7% city: 10.5%
Occupations of females:
- Percentage of females in management occupations (except farmers):
Here: 7.7% city: 6.2%
- Percentage of females in community and social services occupations:
Here: 5.3% city: 2.0%
- Percentage of females in education, training, and library occupations:
Here: 6.8% city: 6.1%
- Percentage of females in sales and office occupations:
Here: 29.9% city: 25.9%
- Percentage of females in production occupations:
Here: 38.0% city: 7.5%
- Percentage of females in transportation occupations:
Here: 1.6% city: 2.0%
- Percentage of females in material moving occupations:
Here: 11.3% city: 4.8%
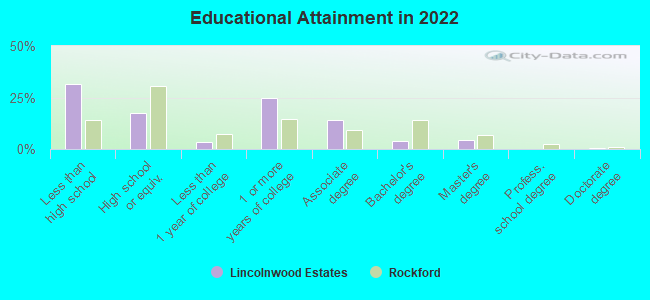
Education in this neighborhood (subdivision or community):
- Percentage of people 3 years and older in K-12 schools:
Lincolnwood Estates: 31.7% Rockford: 17.1%
- Percentage of people 3 years and older in undergraduate colleges:
Lincolnwood Estates: 6.6% Rockford: 3.4%
- Percentage of people 3 years and older in grad. or professional schools:
Lincolnwood Estates: 2.1% Rockford: 0.7%
- Percentage of students K-12 enrolled in private schools:
Lincolnwood Estates: 9.4% Rockford: 14.7%
Percentage of population below poverty level:
| Lincolnwood Estates: | 42.5% |
| Rockford: | 21.1% |
Median year owner moved in (as recorded in 2022):
Median year renter moved in (as recorded in 2022):
| Lincolnwood Estates: | 2004 |
| Rockford: | 2010 |
Median year renter moved in (as recorded in 2022):
| Lincolnwood Estates: | 2017 |
| Rockford: | 2019 |
Percentage of married-couple families with both working:
| Lincolnwood Estates: | 143.6% |
| Rockford: | 64.5% |
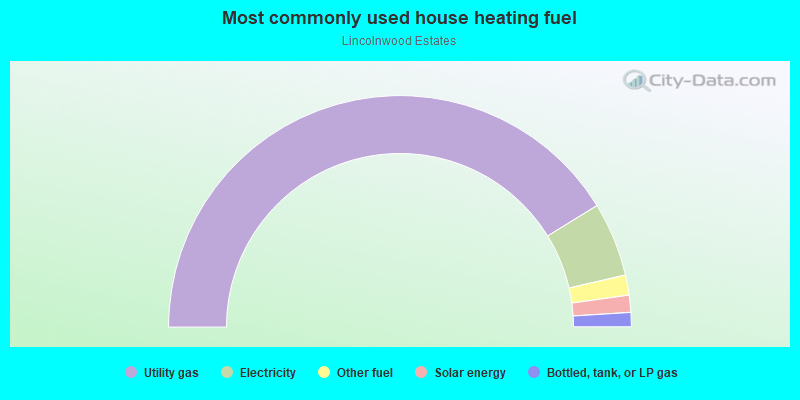
- 82.5%Utility gas
- 10.4%Electricity
- 2.8%Other fuel
- 2.4%Solar energy
- 2.0%Bottled, tank, or LP gas
Highways in this neighborhood:
US Hwy 20 Bus (W State Rd, W State St)
Length: 0.44 miles
Direction: E-W
Address range: 2500 to 2899
Direction: E-W
Address range: 2500 to 2899
Roads and streets:
Elm St
Length: 0.66 miles
Direction: E-W
Address range: 2300 to 3099
Direction: E-W
Address range: 2300 to 3099
Green St
Length: 0.43 miles
Direction: E-W
Address range: 2700 to 3099
Direction: E-W
Address range: 2700 to 3099
Chestnut St
Length: 0.42 miles
Direction: E-W
Address range: 2300 to 3099
Direction: E-W
Address range: 2300 to 3099
S Horace Ave
Length: 0.22 miles
Direction: N-S
Address range: 100 to 399
Direction: N-S
Address range: 100 to 399
S Day Ave
Length: 0.21 miles
Direction: N-S
Address range: 100 to 399
Direction: N-S
Address range: 100 to 399
S Henrietta Ave
Length: 0.21 miles
Direction: N-S
Address range: 100 to 399
Direction: N-S
Address range: 100 to 399
Foster Ave
Length: 0.18 miles
Direction: N-S
Address range: 148 to 399
Direction: N-S
Address range: 148 to 399
Vista Ter
Length: 0.14 miles
Direction: N-S
Address range: 248 to 399
Direction: N-S
Address range: 248 to 399
S Johnston Ave
Length: 0.14 miles
Direction: N-S
Address range: 100 to 299
Direction: N-S
Address range: 100 to 299
S Burbank Ave (Klines Ave)
Length: 0.05 miles
Direction: N-S
Address range: 200 to 300
Direction: N-S
Address range: 200 to 300