Linden Heights neighborhood in Des Moines, Iowa (IA), 50312 detailed profile
Settings
X


Business Search - 14 Million verified businesses
Area: 0.286 square miles
Population: 580
Population density:
| Linden Heights: | 2,029 people per square mile |
| Des Moines: | 2,783 people per square mile |

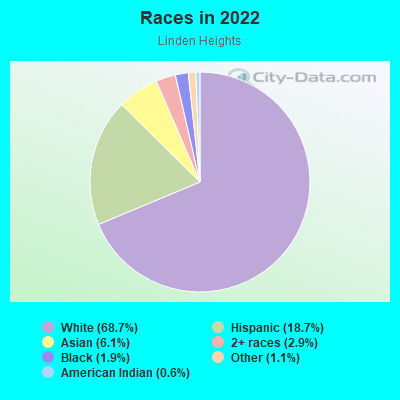
- 48168.7%White
- 13118.7%Hispanic or Latino
- 436.1%Asian
- 202.9%Two or more races
- 131.9%Black
- 81.1%Some other race
- 40.6%American Indian
Median household income in 2022:
| Linden Heights: | $85,870 |
| Des Moines: | $58,018 |
Distribution of median household income
![Distribution of median household income]()
- 4Less than $10,000
- 17$10,000 to $19,999
- 14$20,000 to $29,999
- 12$30,000 to $39,999
- 10$40,000 to $49,999
- 17$50,000 to $59,999
- 25$60,000 to $74,999
- 54$75,000 to $99,999
- 14$100,000 to $124,999
- 7$125,000 to $149,999
- 14$150,000 to $199,999
- 80$200,000 or more

Distribution of owner-occupied house/condo value
![Distribution of owner-occupied house/condo value]()
- 2Less than $50,000
- 5$50,000 to $99,999
- 9$100,000 to $149,999
- 12$150,000 to $199,999
- 20$200,000 to $249,999
- 19$250,000 to $299,999
- 41$300,000 to $399,999
- 13$400,000 to $499,999
- 30$500,000 to $749,999
- 22$750,000 to $999,999
- 15$1,000,000 or more

Distribution of rent paid by renters
![Distribution of rent paid by renters]()
- 3Less than $100
- 2$200 to $299
- 3$300 to $399
- 10$500 to $599
- 18$600 to $699
- 2$700 to $799
- 8$800 to $899
- 3$900 to $999
- 42$1,000 to $1,249
- 4$1,250 to $1,499
- 6$1,500 to $1,999
- 12$2,000 or more

Median rent in 2022:
| Linden Heights: | $1,071 |
| Des Moines: | $873 |
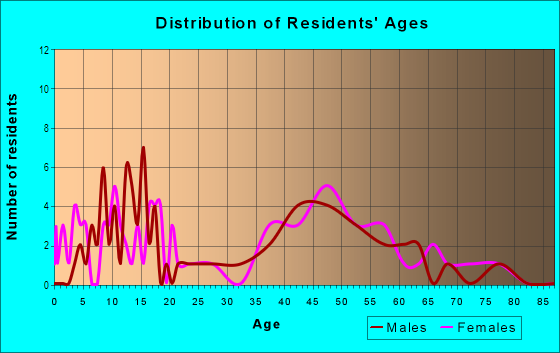
| Males: | 301 |
| Females: | 278 |
Males:
| This neighborhood: | 41.4 years |
| Whole city: | 34.7 years |
| This neighborhood: | 41.7 years |
| Whole city: | 35.5 years |
Average household size:
| Linden Heights: | 2.3 people |
| Des Moines: | 2.2 people |
Percentage of family households:
| Linden Heights: | 46.1% |
| Des Moines: | 40.8% |
| Here: | 50.1% |
| Des Moines: | 32.7% |
Percentage of married-couple families with children (among all households):
| Linden Heights: | 30.8% |
| Des Moines: | 26.2% |
Percentage of single-mother households (among all households):
| Linden Heights: | 12.7% |
| Des Moines: | 14.0% |
Percentage of never married males 15 years old and over:
Percentage of never married females 15 years old and over:
| Linden Heights: | 10.2% |
| Des Moines: | 21.4% |
Percentage of never married females 15 years old and over:
| Linden Heights: | 11.3% |
| city: | 19.3% |
Percentage of people that speak English not well or not at all:
| Linden Heights: | 0.2% |
| Des Moines: | 5.0% |
Percentage of people born in this state:
Percentage of people born in another U.S. state:
Percentage of native residents but born outside the U.S.:
Percentage of foreign born residents:
| Here: | 64.8% |
| Des Moines: | 64.1% |
Percentage of people born in another U.S. state:
| Linden Heights: | 27.4% |
| Des Moines: | 19.2% |
Percentage of native residents but born outside the U.S.:
| Here: | 0.1% |
| city: | 0.5% |
Percentage of foreign born residents:
| Here: | 7.8% |
| Des Moines: | 16.2% |
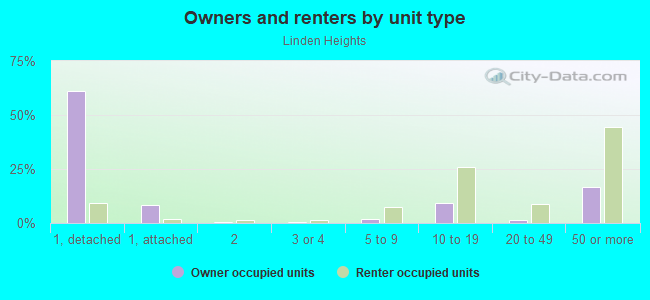
Owner-occupied
Renter-occupied

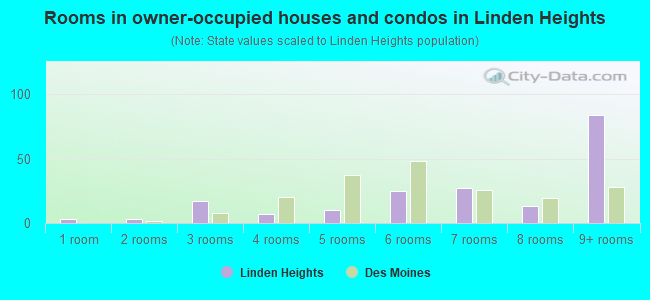
- Rooms in owner-occupied houses and condos in Linden Heights
- 31 room
- 32 rooms
- 173 rooms
- 74 rooms
- 105 rooms
- 256 rooms
- 277 rooms
- 138 rooms
- 849+ rooms
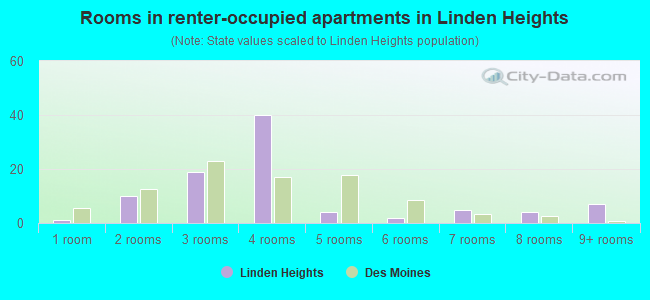
- Rooms in renter-occupied apartments in Linden Heights
- 11 room
- 102 rooms
- 193 rooms
- 404 rooms
- 45 rooms
- 26 rooms
- 57 rooms
- 48 rooms
- 79+ rooms
Owner-occupied
Renter-occupied
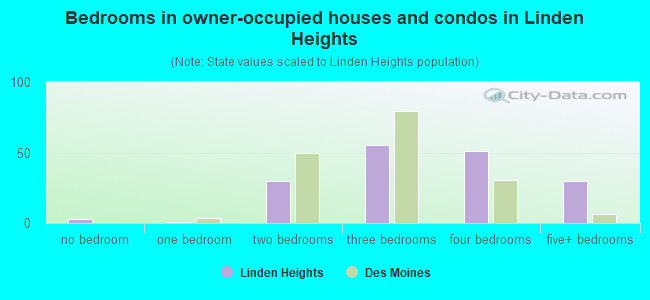
- Bedrooms in owner-occupied houses and condos in Linden Heights
- 3no bedroom
- 11 bedroom
- 302 bedrooms
- 553 bedrooms
- 514 bedrooms
- 305+ bedrooms
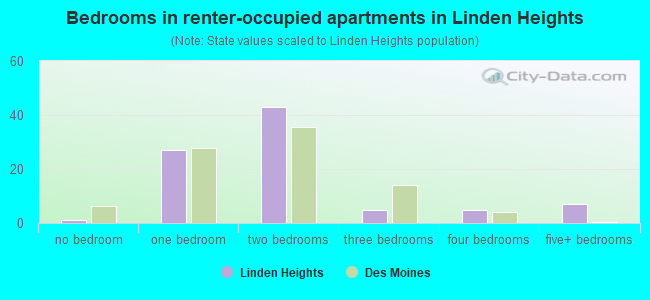
- Bedrooms in renter-occupied apartments in Linden Heights
- 1no bedroom
- 271 bedroom
- 432 bedrooms
- 53 bedrooms
- 54 bedrooms
- 75+ bedrooms
Average number of cars or other vehicles available in houses/condos:
Average number of cars or other vehicles available in apartments:
| This neighborhood: | 2.0 |
| Des Moines: | 1.9 |
Average number of cars or other vehicles available in apartments:
| Here: | 1.1 |
| city: | 1.2 |
Percentage of units with a mortgage:
| Linden Heights: | 69.9% |
| Des Moines: | 69.7% |
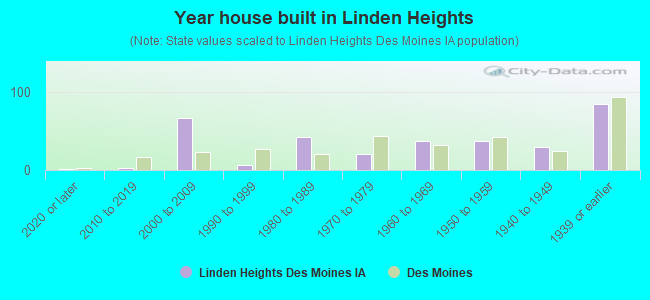
- Year house built in Linden Heights
- 12020 or later
- 22010 to 2019
- 662000 to 2009
- 61990 to 1999
- 421980 to 1989
- 211970 to 1979
- 371960 to 1969
- 371950 to 1959
- 301940 to 1949
- 841939 or earlier
City-data.com crime index for city in 2020 (higher means more crime):
| City: | 422.4 |
| U.S. average: | 219.5 |
Travel time to work (commute)
![Travel time to work (commute)]()
- 5Less than 5 minutes
- 585 to 9 minutes
- 7610 to 14 minutes
- 6015 to 19 minutes
- 3420 to 24 minutes
- 225 to 29 minutes
- 530 to 34 minutes
- 135 to 39 minutes
- 540 to 44 minutes
- 845 to 59 minutes
- 460 to 89 minutes
- 290 or more minutes

Means of transportation to work
![Means of transportation to work]()
- 72.2%229Drove a car alone
- 7.6%24Carpooled
- 3.2%10Walked
- 1.6%5Other means
- 16.7%53Worked at home

Time leaving home to go to work
![Time leaving home to go to work]()
- 412:00 a.m. to 4:59 a.m.
- 105:00 a.m. to 5:29 a.m.
- 35:30 a.m. to 5:59 a.m.
- 66:00 a.m. to 6:29 a.m.
- 226:30 a.m. to 6:59 a.m.
- 427:00 a.m. to 7:29 a.m.
- 387:30 a.m. to 7:59 a.m.
- 478:00 a.m. to 8:29 a.m.
- 438:30 a.m. to 8:59 a.m.
- 209:00 a.m. to 9:59 a.m.
- 1210:00 a.m. to 10:59 a.m.
- 411:00 a.m. to 11:59 a.m.
- 1812:00 p.m. to 3:59 p.m.
- 34:00 p.m. to 11:59 p.m.

Occupations of males:
- Percentage of males in management occupations (except farmers):
Here: 24.0% city: 9.3%
- Percentage of males in business and financial operations occupations:
Here: 6.4% city: 5.5%
- Percentage of males in computer and mathematical occupations:
Here: 20.2% city: 6.0%
- Percentage of males in architecture and engineering occupations:
Here: 2.4% city: 2.3%
- Percentage of males in life, physical, and social science occupations:
Here: 2.6% city: 1.1%
- Percentage of males in legal occupations:
Here: 3.9% city: 1.4%
- Percentage of males in healthcare practitioners and technical occupations:
Here: 4.1% city: 2.2%
- Percentage of males in service occupations:
Here: 2.5% city: 13.1%
- Percentage of males in sales and office occupations:
Here: 17.1% city: 15.2%
- Percentage of males in construction, extraction, and maintenance occupations:
Here: 3.5% city: 10.0%
- Percentage of males in production occupations:
Here: 1.7% city: 9.9%
- Percentage of males in transportation occupations:
Here: 2.9% city: 6.3%
- Percentage of males in material moving occupations:
Here: 4.9% city: 7.2%
Occupations of females:
- Percentage of females in management occupations (except farmers):
Here: 16.7% city: 8.5%
- Percentage of females in business and financial operations occupations:
Here: 18.2% city: 7.3%
- Percentage of females in computer and mathematical occupations:
Here: 1.3% city: 2.5%
- Percentage of females in community and social services occupations:
Here: 3.0% city: 2.1%
- Percentage of females in legal occupations:
Here: 3.3% city: 1.3%
- Percentage of females in education, training, and library occupations:
Here: 6.3% city: 7.0%
- Percentage of females in arts, design, entertainment, sports, and media occupations:
Here: 5.3% city: 2.6%
- Percentage of females in healthcare practitioners and technical occupations:
Here: 8.6% city: 7.6%
- Percentage of females in service occupations:
Here: 14.2% city: 23.4%
- Percentage of females in sales and office occupations:
Here: 21.3% city: 27.7%
- Percentage of females in transportation occupations:
Here: 1.5% city: 0.9%
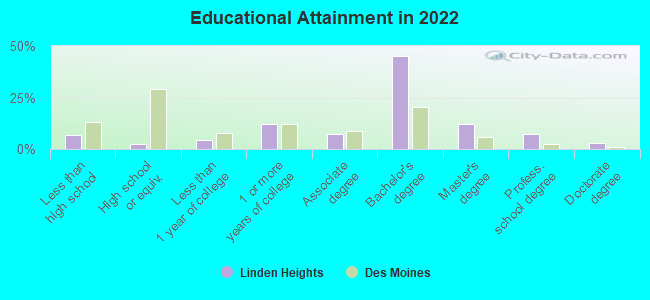
Education in this neighborhood (subdivision or community):
- Percentage of people 3 years and older in K-12 schools:
Linden Heights: 20.5% Des Moines: 17.5%
- Percentage of people 3 years and older in undergraduate colleges:
Linden Heights: 5.0% Des Moines: 3.7%
- Percentage of people 3 years and older in grad. or professional schools:
Linden Heights: 0.7% Des Moines: 1.6%
- Percentage of students K-12 enrolled in private schools:
Linden Heights: 7.8% Des Moines: 6.9%
Percentage of population below poverty level:
| Linden Heights: | 4.2% |
| Des Moines: | 14.7% |
Median year owner moved in (as recorded in 2022):
Median year renter moved in (as recorded in 2022):
| Linden Heights: | 2008 |
| Des Moines: | 2011 |
Median year renter moved in (as recorded in 2022):
| Linden Heights: | 2017 |
| Des Moines: | 2020 |
Percentage of married-couple families with both working:
| Linden Heights: | 84.3% |
| Des Moines: | 73.4% |
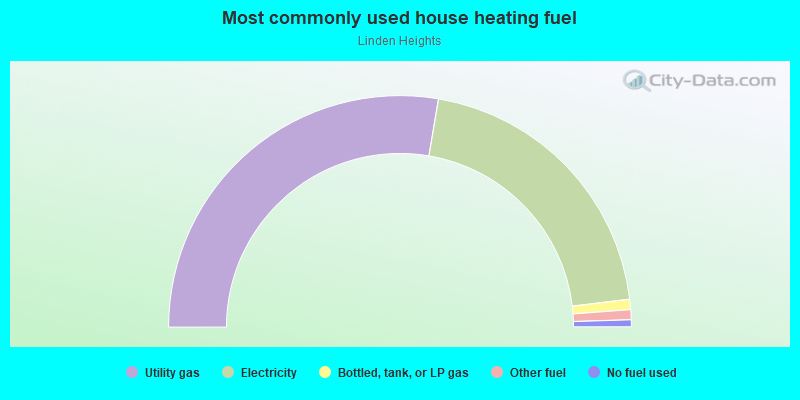
- 55.3%Utility gas
- 40.8%Electricity
- 1.4%Bottled, tank, or LP gas
- 1.4%Other fuel
- 1.0%No fuel used
Roads and streets:
Foster Dr
Length: 1.28 miles
Directions: E-W, N-S, SE-NW, SW-NE
Address range: 1 to 4220
Directions: E-W, N-S, SE-NW, SW-NE
Address range: 1 to 4220
Glenview Dr
Length: 0.56 miles
Directions: E-W, N-S, SE-NW, SW-NE
Address range: 1 to 4229
Directions: E-W, N-S, SE-NW, SW-NE
Address range: 1 to 4229
SW 42nd St
Length: 0.44 miles
Direction: N-S
Address range: 1 to 799
Direction: N-S
Address range: 1 to 799
Woodlawn Dr
Length: 0.31 miles
Directions: E-W, SE-NW, SW-NE
Address range: 4200 to 4299
Directions: E-W, SE-NW, SW-NE
Address range: 4200 to 4299
42nd St
Length: 0.24 miles
Direction: N-S
Address range: 1 to 299
Direction: N-S
Address range: 1 to 299
Parkhill Dr
Length: 0.16 miles
Directions: E-W, SE-NW
Address range: 4228 to 4299
Directions: E-W, SE-NW
Address range: 4228 to 4299
Greenwood Dr
Length: 0.09 miles
Direction: E-W
Address range: 4200 to 4299
Direction: E-W
Address range: 4200 to 4299
Other features:
Walnut Crk
Length: 0.23 miles
Direction: E-W
Direction: E-W