Lindon Park neighborhood in Tempe, Arizona (AZ), 85281 detailed profile
Settings
X


Business Search - 14 Million verified businesses
Area: 0.073 square miles
Population: 1,303
Population density:
| Lindon Park: | 17,805 people per square mile |
| Tempe: | 4,641 people per square mile |

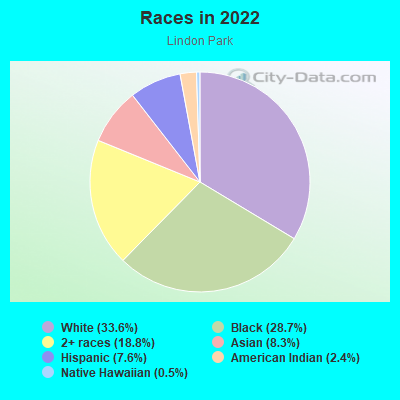
- 44033.6%White
- 37528.7%Black
- 24618.8%Two or more races
- 1098.3%Asian
- 997.6%Hispanic or Latino
- 322.4%American Indian
- 70.5%Native Hawaiian and Other
Pacific Islander
Median household income in 2022:
| Lindon Park: | $41,062 |
| Tempe: | $76,007 |
Distribution of median household income
![Distribution of median household income]()
- 21Less than $10,000
- 50$10,000 to $19,999
- 19$20,000 to $29,999
- 71$30,000 to $39,999
- 80$40,000 to $49,999
- 24$50,000 to $59,999
- 8$60,000 to $74,999
- 21$75,000 to $99,999
- 22$100,000 to $124,999
- 38$125,000 to $149,999
- 18$150,000 to $199,999
- 7$200,000 or more

Distribution of owner-occupied house/condo value
![Distribution of owner-occupied house/condo value]()
- 5Less than $50,000
- 12$100,000 to $149,999
- 13$150,000 to $199,999
- 14$250,000 to $299,999
- 3$300,000 to $399,999
- 22$400,000 to $499,999
- 1$500,000 to $749,999

Distribution of rent paid by renters
![Distribution of rent paid by renters]()
- 1$600 to $699
- 12$700 to $799
- 11$800 to $899
- 52$900 to $999
- 22$1,000 to $1,249
- 81$1,250 to $1,499
- 46$1,500 to $1,999
- 86$2,000 or more

Median rent in 2022:
| Lindon Park: | $1,413 |
| Tempe: | $1,566 |
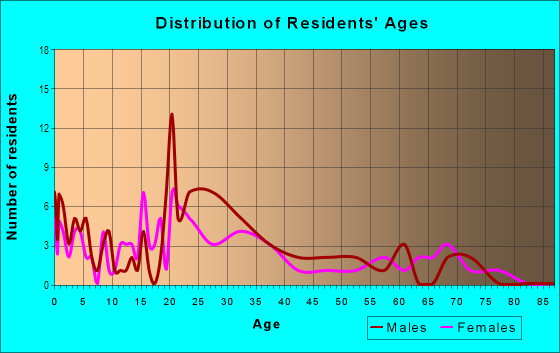
| Males: | 719 |
| Females: | 584 |
Males:
| This neighborhood: | 21.7 years |
| Whole city: | 28.9 years |
| This neighborhood: | 21.3 years |
| Whole city: | 30.5 years |
Average household size:
| Lindon Park: | 3.9 people |
| Tempe: | 2.3 people |
Percentage of family households:
| Lindon Park: | 26.3% |
| Tempe: | 36.3% |
| Here: | 15.1% |
| Tempe: | 32.6% |
Percentage of married-couple families with children (among all households):
| Lindon Park: | 4.3% |
| Tempe: | 26.9% |
Percentage of single-mother households (among all households):
| Lindon Park: | 21.2% |
| Tempe: | 8.3% |
Percentage of never married males 15 years old and over:
Percentage of never married females 15 years old and over:
| Lindon Park: | 52.7% |
| Tempe: | 32.9% |
Percentage of never married females 15 years old and over:
| Lindon Park: | 24.8% |
| city: | 21.7% |
Percentage of people that speak English not well or not at all:
| Lindon Park: | 0.0% |
| Tempe: | 2.0% |
Percentage of people born in this state:
Percentage of people born in another U.S. state:
Percentage of native residents but born outside the U.S.:
Percentage of foreign born residents:
| Here: | 37.8% |
| Tempe: | 39.3% |
Percentage of people born in another U.S. state:
| Lindon Park: | 47.5% |
| Tempe: | 46.0% |
Percentage of native residents but born outside the U.S.:
| Here: | 1.7% |
| city: | 1.8% |
Percentage of foreign born residents:
| Here: | 12.9% |
| Tempe: | 12.9% |
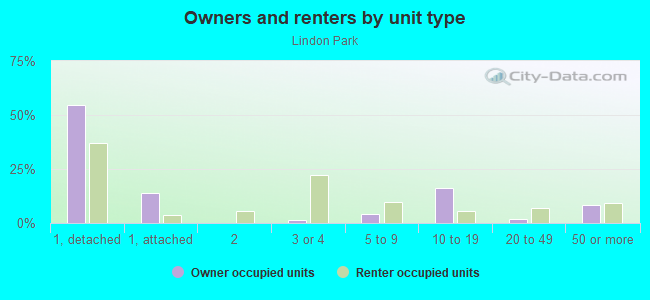
Owner-occupied
Renter-occupied

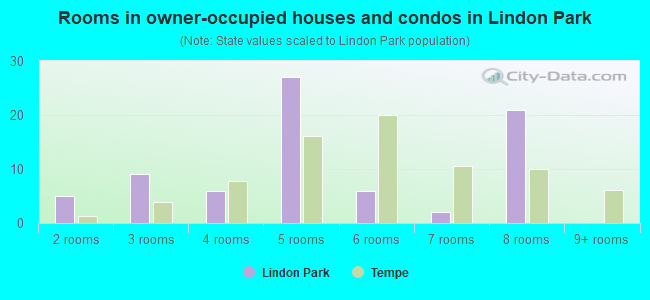
- Rooms in owner-occupied houses and condos in Lindon Park
- 01 room
- 52 rooms
- 93 rooms
- 64 rooms
- 275 rooms
- 66 rooms
- 27 rooms
- 218 rooms
- 09+ rooms
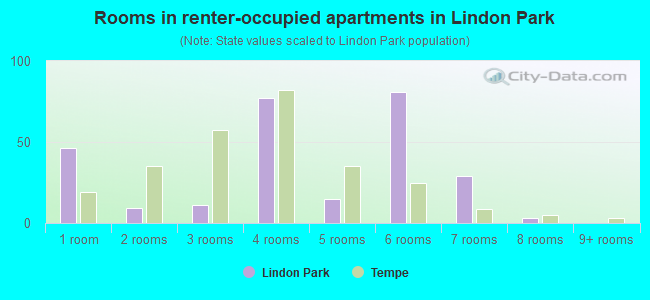
- Rooms in renter-occupied apartments in Lindon Park
- 461 room
- 92 rooms
- 113 rooms
- 774 rooms
- 155 rooms
- 816 rooms
- 297 rooms
- 38 rooms
- 09+ rooms
Owner-occupied
Renter-occupied
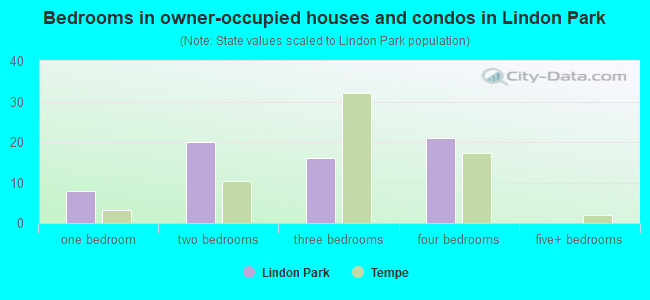
- Bedrooms in owner-occupied houses and condos in Lindon Park
- 0no bedroom
- 81 bedroom
- 202 bedrooms
- 163 bedrooms
- 214 bedrooms
- 05+ bedrooms
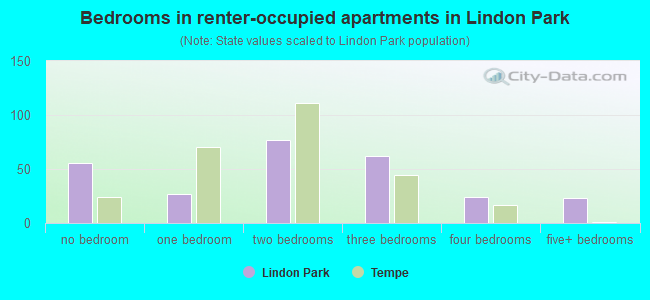
- Bedrooms in renter-occupied apartments in Lindon Park
- 56no bedroom
- 271 bedroom
- 772 bedrooms
- 623 bedrooms
- 244 bedrooms
- 235+ bedrooms
Average number of cars or other vehicles available in houses/condos:
Average number of cars or other vehicles available in apartments:
| This neighborhood: | 2.0 |
| Tempe: | 2.0 |
Average number of cars or other vehicles available in apartments:
| Here: | 1.8 |
| city: | 1.6 |
Percentage of units with a mortgage:
| Lindon Park: | 78.8% |
| Tempe: | 69.2% |
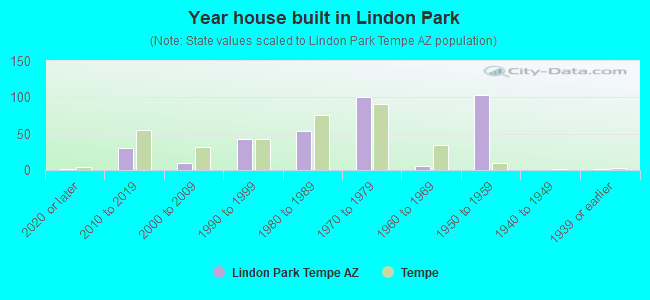
- Year house built in Lindon Park
- 22020 or later
- 302010 to 2019
- 92000 to 2009
- 431990 to 1999
- 541980 to 1989
- 1011970 to 1979
- 51960 to 1969
- 1031950 to 1959
- 01940 to 1949
- 21939 or earlier
City-data.com crime index for city in 2020 (higher means more crime):
| City: | 347.1 |
| U.S. average: | 219.5 |
Travel time to work (commute)
![Travel time to work (commute)]()
- 3Less than 5 minutes
- 315 to 9 minutes
- 5010 to 14 minutes
- 5515 to 19 minutes
- 4520 to 24 minutes
- 3425 to 29 minutes
- 1630 to 34 minutes
- 135 to 39 minutes
- 540 to 44 minutes
- 1845 to 59 minutes
- 1060 to 89 minutes
- 490 or more minutes

Means of transportation to work
![Means of transportation to work]()
- 58.3%293Drove a car alone
- 12.5%63Carpooled
- 1.2%6Bus
- 1.8%9Light rail, streetcar or trolley
- 0.4%2Taxi
- 12.7%64Bicycle
- 9.1%46Walked
- 0.4%2Other means
- 5.0%25Worked at home

Time leaving home to go to work
![Time leaving home to go to work]()
- 912:00 a.m. to 4:59 a.m.
- 25:00 a.m. to 5:29 a.m.
- 75:30 a.m. to 5:59 a.m.
- 206:00 a.m. to 6:29 a.m.
- 196:30 a.m. to 6:59 a.m.
- 287:00 a.m. to 7:29 a.m.
- 187:30 a.m. to 7:59 a.m.
- 498:00 a.m. to 8:29 a.m.
- 388:30 a.m. to 8:59 a.m.
- 179:00 a.m. to 9:59 a.m.
- 910:00 a.m. to 10:59 a.m.
- 711:00 a.m. to 11:59 a.m.
- 3212:00 p.m. to 3:59 p.m.
- 114:00 p.m. to 11:59 p.m.

Occupations of males:
- Percentage of males in management occupations (except farmers):
Here: 6.1% city: 10.2%
- Percentage of males in business and financial operations occupations:
Here: 4.3% city: 6.5%
- Percentage of males in computer and mathematical occupations:
Here: 5.2% city: 8.4%
- Percentage of males in architecture and engineering occupations:
Here: 2.3% city: 5.0%
- Percentage of males in life, physical, and social science occupations:
Here: 8.2% city: 1.9%
- Percentage of males in legal occupations:
Here: 6.9% city: 1.1%
- Percentage of males in education, training, and library occupations:
Here: 8.2% city: 6.1%
- Percentage of males in arts, design, entertainment, sports, and media occupations:
Here: 4.5% city: 2.8%
- Percentage of males in healthcare practitioners and technical occupations:
Here: 2.5% city: 2.8%
- Percentage of males in service occupations:
Here: 26.3% city: 14.4%
- Percentage of males in sales and office occupations:
Here: 11.5% city: 19.0%
- Percentage of males in construction, extraction, and maintenance occupations:
Here: 6.3% city: 5.1%
- Percentage of males in production occupations:
Here: 2.3% city: 4.4%
- Percentage of males in transportation occupations:
Here: 8.9% city: 3.9%
- Percentage of males in material moving occupations:
Here: 3.5% city: 3.5%
Occupations of females:
- Percentage of females in management occupations (except farmers):
Here: 5.2% city: 7.5%
- Percentage of females in business and financial operations occupations:
Here: 7.8% city: 9.3%
- Percentage of females in computer and mathematical occupations:
Here: 5.2% city: 3.3%
- Percentage of females in architecture and engineering occupations:
Here: 3.6% city: 0.9%
- Percentage of females in community and social services occupations:
Here: 5.8% city: 3.4%
- Percentage of females in education, training, and library occupations:
Here: 17.4% city: 12.0%
- Percentage of females in arts, design, entertainment, sports, and media occupations:
Here: 5.2% city: 3.1%
- Percentage of females in healthcare practitioners and technical occupations:
Here: 7.4% city: 7.4%
- Percentage of females in service occupations:
Here: 12.3% city: 18.9%
- Percentage of females in sales and office occupations:
Here: 36.5% city: 26.9%
- Percentage of females in construction, extraction, and maintenance occupations:
Here: 1.3% city: 0.3%
- Percentage of females in transportation occupations:
Here: 5.2% city: 0.9%
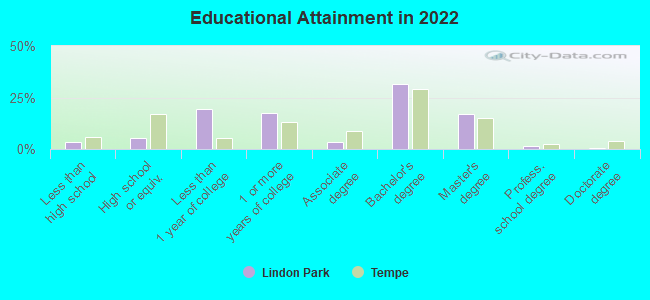
Education in this neighborhood (subdivision or community):
- Percentage of people 3 years and older in K-12 schools:
Lindon Park: 8.7% Tempe: 12.5%
- Percentage of people 3 years and older in undergraduate colleges:
Lindon Park: 21.0% Tempe: 15.4%
- Percentage of people 3 years and older in grad. or professional schools:
Lindon Park: 6.5% Tempe: 6.3%
- Percentage of students K-12 enrolled in private schools:
Lindon Park: 16.8% Tempe: 9.2%
Percentage of population below poverty level:
| Lindon Park: | 29.7% |
| Tempe: | 15.0% |
Median year owner moved in (as recorded in 2022):
| Lindon Park: | 2012 |
| Tempe: | 2013 |
Percentage of married-couple families with both working:
| Lindon Park: | 80.0% |
| Tempe: | 77.6% |
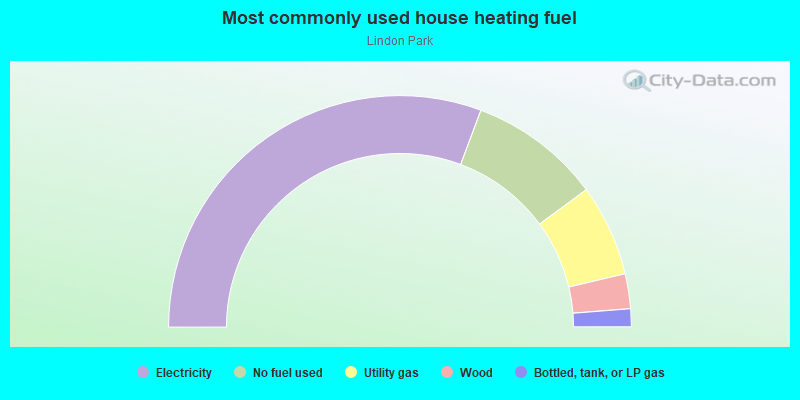
- 61.4%Electricity
- 18.4%No fuel used
- 12.8%Utility gas
- 4.9%Wood
- 2.5%Bottled, tank, or LP gas
Roads and streets:
W 5th St
Length: 0.29 miles
Direction: E-W
Address range: 1400 to 1599
Direction: E-W
Address range: 1400 to 1599
S Albert Ave
Length: 0.26 miles
Direction: N-S
Address range: 500 to 799
Direction: N-S
Address range: 500 to 799
S Priest Dr
Length: 0.17 miles
Direction: N-S
Address range: 450 to 749
Direction: N-S
Address range: 450 to 749
W University Dr
Length: 0.13 miles
Direction: E-W
Address range: 1400 to 1499
Direction: E-W
Address range: 1400 to 1499
W 7th St
Length: 0.11 miles
Directions: E-W, SW-NE
Address range: 1400 to 1499
Directions: E-W, SW-NE
Address range: 1400 to 1499
W 6th St
Length: 0.10 miles
Directions: E-W, SW-NE
Address range: 1400 to 1499
Directions: E-W, SW-NE
Address range: 1400 to 1499
W 7th Pl
Length: 0.10 miles
Direction: E-W
Address range: 1400 to 1499
Direction: E-W
Address range: 1400 to 1499
S Ernie Pl
Length: 0.09 miles
Direction: N-S
Address range: 500 to 599
Direction: N-S
Address range: 500 to 599
Priest Dr
Length: 0.05 miles
Directions: N-S, SE-NW
Directions: N-S, SE-NW