Linwood neighborhood in Fort Worth, Texas (TX), 76107 detailed profile
Settings
X


Business Search - 14 Million verified businesses
Area: 1.103 square miles
Population: 717
Population density:
| Linwood: | 650 people per square mile |
| Fort Worth: | 3,286 people per square mile |

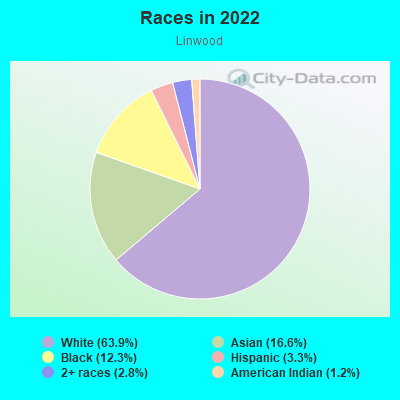
- 46363.9%White
- 12016.6%Asian
- 8912.3%Black
- 243.3%Hispanic or Latino
- 202.8%Two or more races
- 91.2%American Indian
Median household income in 2022:
| Linwood: | $84,688 |
| Fort Worth: | $71,527 |
Distribution of median household income
![Distribution of median household income]()
- 77Less than $10,000
- 36$10,000 to $19,999
- 36$20,000 to $29,999
- 139$30,000 to $39,999
- 25$40,000 to $49,999
- 7$50,000 to $59,999
- 47$60,000 to $74,999
- 62$75,000 to $99,999
- 72$100,000 to $124,999
- 73$125,000 to $149,999
- 31$150,000 to $199,999
- 58$200,000 or more

Distribution of owner-occupied house/condo value
![Distribution of owner-occupied house/condo value]()
- 4Less than $50,000
- 16$300,000 to $399,999
- 21$400,000 to $499,999
- 47$500,000 to $749,999
- 5$750,000 to $999,999
- 14$1,000,000 or more

Distribution of rent paid by renters
![Distribution of rent paid by renters]()
- 6$900 to $999
- 11$1,000 to $1,249
- 209$1,250 to $1,499
- 157$1,500 to $1,999
- 66$2,000 or more

Median rent in 2022:
| Linwood: | $1,503 |
| Fort Worth: | $1,182 |
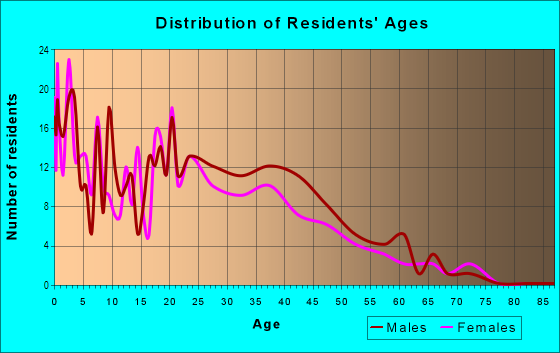
| Males: | 315 |
| Females: | 402 |
Males:
| This neighborhood: | 32.5 years |
| Whole city: | 33.6 years |
| This neighborhood: | 25.9 years |
| Whole city: | 34.8 years |
Average household size:
| Linwood: | 1.3 people |
| Fort Worth: | 2.7 people |
Percentage of family households:
| Linwood: | 9.6% |
| Fort Worth: | 52.4% |
| Here: | 13.0% |
| Fort Worth: | 48.2% |
Percentage of married-couple families with children (among all households):
| Linwood: | 76.0% |
| Fort Worth: | 25.9% |
Percentage of single-mother households (among all households):
| Linwood: | 0.0% |
| Fort Worth: | 7.4% |
Percentage of never married males 15 years old and over:
Percentage of never married females 15 years old and over:
| Linwood: | 27.3% |
| Fort Worth: | 18.5% |
Percentage of never married females 15 years old and over:
| Linwood: | 39.0% |
| city: | 17.3% |
Percentage of people that speak English not well or not at all:
| Linwood: | 0.0% |
| Fort Worth: | 6.5% |
Percentage of people born in this state:
Percentage of people born in another U.S. state:
Percentage of native residents but born outside the U.S.:
Percentage of foreign born residents:
| Here: | 45.1% |
| Fort Worth: | 55.0% |
Percentage of people born in another U.S. state:
| Linwood: | 39.5% |
| Fort Worth: | 26.2% |
Percentage of native residents but born outside the U.S.:
| Here: | 4.7% |
| city: | 2.1% |
Percentage of foreign born residents:
| Here: | 10.7% |
| Fort Worth: | 16.6% |
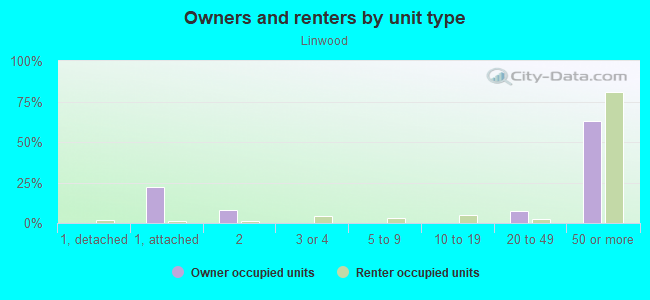
Owner-occupied
Renter-occupied

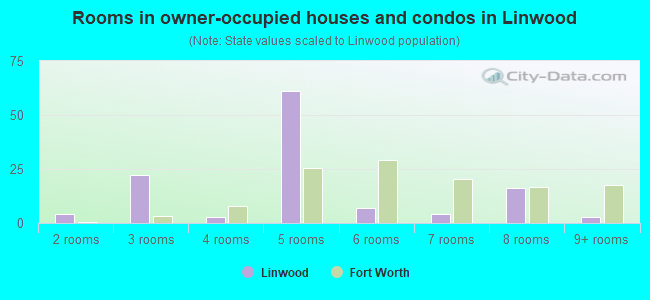
- Rooms in owner-occupied houses and condos in Linwood
- 01 room
- 42 rooms
- 223 rooms
- 34 rooms
- 615 rooms
- 76 rooms
- 47 rooms
- 168 rooms
- 39+ rooms
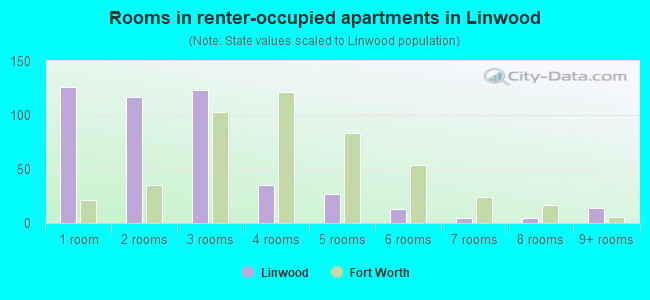
- Rooms in renter-occupied apartments in Linwood
- 1261 room
- 1172 rooms
- 1233 rooms
- 354 rooms
- 275 rooms
- 136 rooms
- 57 rooms
- 58 rooms
- 149+ rooms
Owner-occupied
Renter-occupied
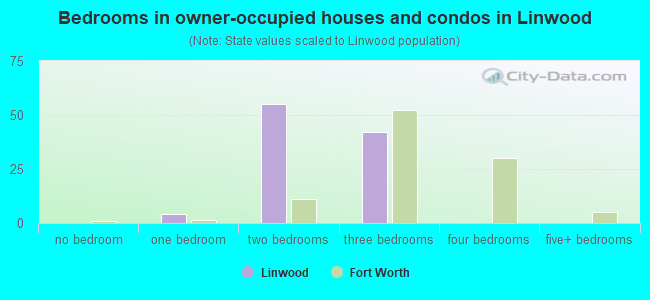
- Bedrooms in owner-occupied houses and condos in Linwood
- 0no bedroom
- 41 bedroom
- 552 bedrooms
- 423 bedrooms
- 04 bedrooms
- 05+ bedrooms
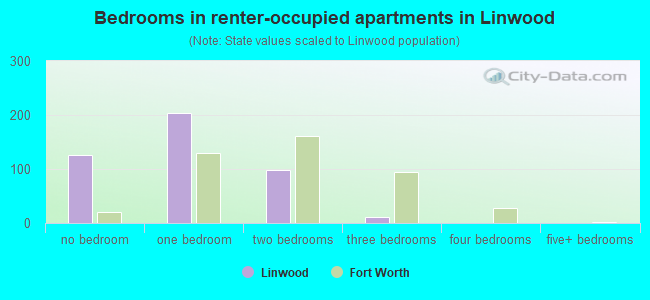
- Bedrooms in renter-occupied apartments in Linwood
- 126no bedroom
- 2041 bedroom
- 982 bedrooms
- 113 bedrooms
- 04 bedrooms
- 05+ bedrooms
Average number of cars or other vehicles available in houses/condos:
Average number of cars or other vehicles available in apartments:
| This neighborhood: | 2.0 |
| Fort Worth: | 2.1 |
Average number of cars or other vehicles available in apartments:
| Here: | 1.2 |
| city: | 1.5 |
Percentage of units with a mortgage:
| Linwood: | 55.0% |
| Fort Worth: | 61.2% |
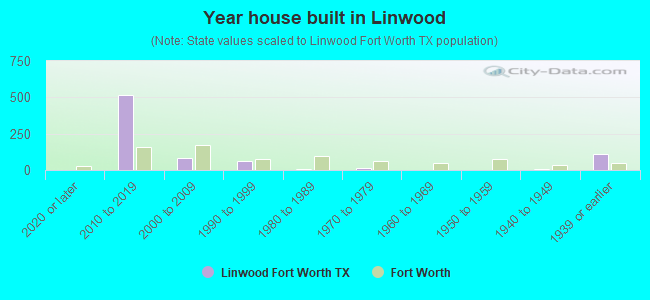
- Year house built in Linwood
- 02020 or later
- 5162010 to 2019
- 832000 to 2009
- 611990 to 1999
- 51980 to 1989
- 111970 to 1979
- 01960 to 1969
- 01950 to 1959
- 41940 to 1949
- 1091939 or earlier
City-data.com crime index for city in 2020 (higher means more crime):
| City: | 303.1 |
| U.S. average: | 219.5 |
Travel time to work (commute)
![Travel time to work (commute)]()
- 66Less than 5 minutes
- 2095 to 9 minutes
- 33510 to 14 minutes
- 19215 to 19 minutes
- 19220 to 24 minutes
- 1325 to 29 minutes
- 10730 to 34 minutes
- 535 to 39 minutes
- 4340 to 44 minutes
- 1745 to 59 minutes
- 2960 to 89 minutes

Means of transportation to work
![Means of transportation to work]()
- 86.2%475Drove a car alone
- 4.9%27Carpooled
- 0.9%5Motorcycle
- 0.9%5Bicycle
- 2.0%11Walked
- 7.3%40Other means
- 5.6%31Worked at home

Time leaving home to go to work
![Time leaving home to go to work]()
- 1612:00 a.m. to 4:59 a.m.
- 35:30 a.m. to 5:59 a.m.
- 886:00 a.m. to 6:29 a.m.
- 596:30 a.m. to 6:59 a.m.
- 1567:00 a.m. to 7:29 a.m.
- 2027:30 a.m. to 7:59 a.m.
- 1868:00 a.m. to 8:29 a.m.
- 2088:30 a.m. to 8:59 a.m.
- 1309:00 a.m. to 9:59 a.m.
- 3410:00 a.m. to 10:59 a.m.
- 2111:00 a.m. to 11:59 a.m.
- 3612:00 p.m. to 3:59 p.m.
- 994:00 p.m. to 11:59 p.m.

Occupations of males:
- Percentage of males in management occupations (except farmers):
Here: 32.8% city: 11.7%
- Percentage of males in business and financial operations occupations:
Here: 10.6% city: 4.9%
- Percentage of males in computer and mathematical occupations:
Here: 14.3% city: 4.3%
- Percentage of males in architecture and engineering occupations:
Here: 5.1% city: 3.4%
- Percentage of males in life, physical, and social science occupations:
Here: 2.2% city: 0.6%
- Percentage of males in community and social services occupations:
Here: 4.9% city: 0.9%
- Percentage of males in legal occupations:
Here: 8.1% city: 0.8%
- Percentage of males in education, training, and library occupations:
Here: 3.2% city: 2.9%
- Percentage of males in arts, design, entertainment, sports, and media occupations:
Here: 7.6% city: 1.3%
- Percentage of males in healthcare practitioners and technical occupations:
Here: 6.8% city: 2.6%
- Percentage of males in service occupations:
Here: 2.5% city: 12.0%
- Percentage of males in sales and office occupations:
Here: 18.4% city: 15.8%
- Percentage of males in construction, extraction, and maintenance occupations:
Here: 2.2% city: 11.7%
- Percentage of males in production occupations:
Here: 2.5% city: 7.8%
- Percentage of males in transportation occupations:
Here: 2.5% city: 7.1%
- Percentage of males in material moving occupations:
Here: 13.3% city: 7.1%
Occupations of females:
- Percentage of females in management occupations (except farmers):
Here: 36.5% city: 9.6%
- Percentage of females in business and financial operations occupations:
Here: 11.1% city: 6.3%
- Percentage of females in computer and mathematical occupations:
Here: 11.6% city: 1.8%
- Percentage of females in architecture and engineering occupations:
Here: 6.2% city: 0.8%
- Percentage of females in legal occupations:
Here: 1.6% city: 1.2%
- Percentage of females in education, training, and library occupations:
Here: 4.2% city: 9.5%
- Percentage of females in arts, design, entertainment, sports, and media occupations:
Here: 23.0% city: 1.8%
- Percentage of females in healthcare practitioners and technical occupations:
Here: 6.2% city: 7.9%
- Percentage of females in service occupations:
Here: 2.8% city: 20.2%
- Percentage of females in sales and office occupations:
Here: 28.4% city: 28.3%
- Percentage of females in production occupations:
Here: 6.2% city: 3.5%
- Percentage of females in transportation occupations:
Here: 2.1% city: 1.8%
- Percentage of females in material moving occupations:
Here: 2.1% city: 3.4%
Percentage of people 16-64 in Armed Forces:
| Linwood: | 0.3% |
| Fort Worth: | 0.2% |
Education in this neighborhood (subdivision or community):
- Percentage of people 3 years and older in K-12 schools:
Linwood: 0.6% Fort Worth: 20.3%
- Percentage of people 3 years and older in undergraduate colleges:
Linwood: 8.5% Fort Worth: 4.7%
- Percentage of people 3 years and older in grad. or professional schools:
Linwood: 15.8% Fort Worth: 1.6%
- Percentage of students K-12 enrolled in private schools:
Linwood: 0.0% Fort Worth: 7.2%
Percentage of population below poverty level:
| Linwood: | 13.6% |
| Fort Worth: | 12.0% |
Median year owner moved in (as recorded in 2022):
Median year renter moved in (as recorded in 2022):
| Linwood: | 2017 |
| Fort Worth: | 2013 |
Median year renter moved in (as recorded in 2022):
| Linwood: | 2019 |
| Fort Worth: | 2020 |
Percentage of married-couple families with both working:
| Linwood: | 100.0% |
| Fort Worth: | 71.2% |
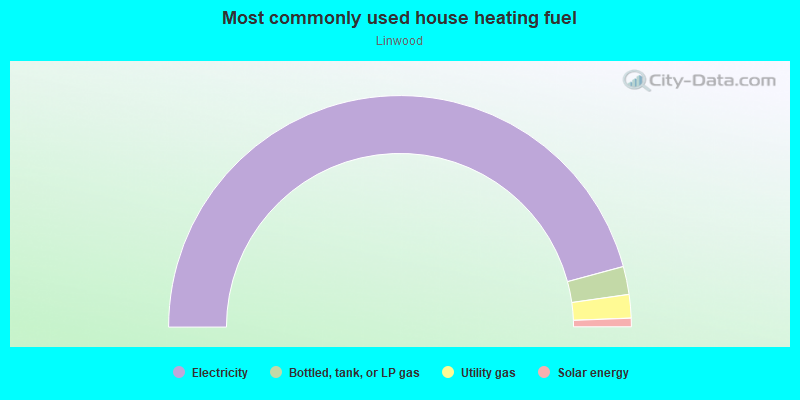
- 91.7%Electricity
- 3.9%Bottled, tank, or LP gas
- 3.3%Utility gas
- 1.2%Solar energy
Highways in this neighborhood:
N Henderson St (Jacksboro Hwy, State Hwy 199)
Length: 0.76 miles
Direction: SE-NW
Address range: 600 to 1181
Direction: SE-NW
Address range: 600 to 1181
Jacksboro Hwy (State Hwy 199)
Length: 0.76 miles
Direction: SE-NW
Direction: SE-NW
Roads and streets:
Heritage Park
Length: 3.48 miles
Directions: E-W, N-S, SE-NW, SW-NE
Directions: E-W, N-S, SE-NW, SW-NE
White Settlement Rd
Length: 1.24 miles
Direction: E-W
Address range: 1600 to 3115
Direction: E-W
Address range: 1600 to 3115
Cullen St
Length: 1.12 miles
Directions: E-W, N-S, SE-NW, SW-NE
Address range: 2300 to 3099
Directions: E-W, N-S, SE-NW, SW-NE
Address range: 2300 to 3099
University Dr
Length: 1.10 miles
Directions: N-S, SW-NE
Address range: 100 to 799
Directions: N-S, SW-NE
Address range: 100 to 799
W 7th St
Length: 1.02 miles
Direction: E-W
Address range: 2100 to 3107
Direction: E-W
Address range: 2100 to 3107
Shamrock Ave
Length: 0.80 miles
Directions: E-W, SE-NW
Address range: 2400 to 3099
Directions: E-W, SE-NW
Address range: 2400 to 3099
Whitmore St
Length: 0.67 miles
Directions: E-W, SW-NE
Address range: 2400 to 2999
Directions: E-W, SW-NE
Address range: 2400 to 2999
Tillar St
Length: 0.65 miles
Direction: E-W
Address range: 2400 to 2899
Direction: E-W
Address range: 2400 to 2899
W 5th St
Length: 0.64 miles
Direction: E-W
Address range: 2000 to 3107
Direction: E-W
Address range: 2000 to 3107
N University Dr
Length: 0.64 miles
Direction: N-S
Address range: 100 to 457
Direction: N-S
Address range: 100 to 457
Weisenberger St
Length: 0.64 miles
Direction: E-W
Address range: 2400 to 2999
Direction: E-W
Address range: 2400 to 2999
W 6th St
Length: 0.59 miles
Direction: E-W
Address range: 2200 to 3099
Direction: E-W
Address range: 2200 to 3099
Carroll St
Length: 0.55 miles
Direction: N-S
Address range: 100 to 799
Direction: N-S
Address range: 100 to 799
Calvert St
Length: 0.54 miles
Directions: E-W, N-S, SE-NW, SW-NE
Address range: 900 to 1099
Directions: E-W, N-S, SE-NW, SW-NE
Address range: 900 to 1099
Foch St
Length: 0.50 miles
Directions: N-S, SW-NE
Address range: 100 to 799
Directions: N-S, SW-NE
Address range: 100 to 799
Wingate St
Length: 0.47 miles
Directions: E-W, SE-NW, SW-NE
Address range: 2700 to 3099
Directions: E-W, SE-NW, SW-NE
Address range: 2700 to 3099
Harrold St
Length: 0.43 miles
Direction: N-S
Address range: 200 to 799
Direction: N-S
Address range: 200 to 799
Greenleaf St
Length: 0.42 miles
Directions: N-S, SW-NE
Address range: 100 to 599
Directions: N-S, SW-NE
Address range: 100 to 599
Wimberly St
Length: 0.37 miles
Directions: N-S, SE-NW, SW-NE
Address range: 100 to 499
Directions: N-S, SE-NW, SW-NE
Address range: 100 to 499
Merrimac St
Length: 0.34 miles
Directions: E-W, SW-NE
Address range: 2700 to 2999
Directions: E-W, SW-NE
Address range: 2700 to 2999
Currie St
Length: 0.32 miles
Direction: N-S
Address range: 100 to 799
Direction: N-S
Address range: 100 to 799
Kansas St
Length: 0.28 miles
Directions: E-W, SW-NE
Address range: 1800 to 2299
Directions: E-W, SW-NE
Address range: 1800 to 2299
N Wimberly St
Length: 0.28 miles
Direction: N-S
Address range: 100 to 399
Direction: N-S
Address range: 100 to 399
Arthur St
Length: 0.24 miles
Directions: N-S, SW-NE
Address range: 100 to 399
Directions: N-S, SW-NE
Address range: 100 to 399
N Vacek St
Length: 0.23 miles
Direction: N-S
Address range: 100 to 399
Direction: N-S
Address range: 100 to 399
N Foch St
Length: 0.23 miles
Direction: N-S
Address range: 100 to 399
Direction: N-S
Address range: 100 to 399
Mercedes Ave
Length: 0.17 miles
Direction: E-W
Address range: 2700 to 2799
Direction: E-W
Address range: 2700 to 2799
Adrian Dr
Length: 0.17 miles
Directions: N-S, SW-NE
Address range: 100 to 299
Directions: N-S, SW-NE
Address range: 100 to 299
Templeton Dr
Length: 0.17 miles
Directions: N-S, SE-NW
Address range: 300 to 599
Directions: N-S, SE-NW
Address range: 300 to 599
Bristol Rd
Length: 0.17 miles
Directions: E-W, SE-NW
Address range: 3000 to 3138
Directions: E-W, SE-NW
Address range: 3000 to 3138
Dakota St
Length: 0.17 miles
Directions: E-W, SW-NE
Address range: 2000 to 2299
Directions: E-W, SW-NE
Address range: 2000 to 2299
Vacek St
Length: 0.16 miles
Direction: N-S
Address range: 100 to 299
Direction: N-S
Address range: 100 to 299
Shotts St
Length: 0.16 miles
Direction: E-W
Address range: 2900 to 3099
Direction: E-W
Address range: 2900 to 3099
N Rupert St
Length: 0.16 miles
Direction: N-S
Address range: 100 to 299
Direction: N-S
Address range: 100 to 299
Stayton St
Length: 0.16 miles
Directions: N-S, SW-NE
Address range: 600 to 825
Directions: N-S, SW-NE
Address range: 600 to 825
Woodward St
Length: 0.16 miles
Directions: N-S, SW-NE
Address range: 600 to 999
Directions: N-S, SW-NE
Address range: 600 to 999
Congress St
Length: 0.14 miles
Directions: N-S, SW-NE
Address range: 600 to 999
Directions: N-S, SW-NE
Address range: 600 to 999
S Commercial St
Length: 0.14 miles
Direction: N-S
Address range: 100 to 299
Direction: N-S
Address range: 100 to 299
Azalea Ave
Length: 0.14 miles
Directions: E-W, SE-NW
Address range: 2700 to 2799
Directions: E-W, SE-NW
Address range: 2700 to 2799
Sondra Dr
Length: 0.14 miles
Directions: E-W, SE-NW
Address range: 3000 to 3151
Directions: E-W, SE-NW
Address range: 3000 to 3151
Rupert St
Length: 0.13 miles
Directions: N-S, SE-NW
Address range: 100 to 399
Directions: N-S, SE-NW
Address range: 100 to 399
Franklin St
Length: 0.13 miles
Directions: E-W, N-S, SE-NW, SW-NE
Address range: 900 to 999
Directions: E-W, N-S, SE-NW, SW-NE
Address range: 900 to 999
Adolph St
Length: 0.13 miles
Direction: N-S
Address range: 100 to 299
Direction: N-S
Address range: 100 to 299
Norwood St
Length: 0.13 miles
Direction: N-S
Address range: 600 to 799
Direction: N-S
Address range: 600 to 799
Viola St
Length: 0.13 miles
Directions: N-S, SW-NE
Address range: 100 to 299
Directions: N-S, SW-NE
Address range: 100 to 299
Hamilton Ave
Length: 0.12 miles
Direction: E-W
Address range: 3000 to 3107
Direction: E-W
Address range: 3000 to 3107
N Commercial St
Length: 0.11 miles
Direction: N-S
Address range: 100 to 199
Direction: N-S
Address range: 100 to 199
Locomotive St
Length: 0.08 miles
Direction: E-W
Direction: E-W
Nebraska St
Length: 0.07 miles
Direction: E-W
Address range: 2100 to 2199
Direction: E-W
Address range: 2100 to 2199
Austin St
Length: 0.07 miles
Direction: N-S
Address range: 100 to 299
Direction: N-S
Address range: 100 to 299
Boxcar Blvd
Length: 0.05 miles
Direction: N-S
Direction: N-S
Camp Bowie Blvd
Length: 0.02 miles
Directions: E-W, SW-NE
Address range: 3100 to 3105
Directions: E-W, SW-NE
Address range: 3100 to 3105
Railroad features:
St Louis Southwestern Rlwy
Length: 1.12 miles
Direction: SW-NE
Direction: SW-NE