Little Italy neighborhood in San Diego, California (CA), 92101 detailed profile
Settings
X


Business Search - 14 Million verified businesses
Area: 0.158 square miles
Population: 1,835
Population density:
| Little Italy: | 11,622 people per square mile |
| San Diego: | 4,258 people per square mile |

- 95751.9%White
- 67336.5%Hispanic or Latino
- 1015.5%Two or more races
- 563.0%Black
- 362.0%Asian
- 110.6%American Indian
- 110.6%Native Hawaiian and Other
Pacific Islander

Median household income in 2022:
| Little Italy: | $86,292 |
| San Diego: | $100,010 |
Distribution of median household income
![Distribution of median household income]()
- 96Less than $10,000
- 104$10,000 to $19,999
- 48$20,000 to $29,999
- 88$30,000 to $39,999
- 144$40,000 to $49,999
- 31$50,000 to $59,999
- 118$60,000 to $74,999
- 208$75,000 to $99,999
- 135$100,000 to $124,999
- 102$125,000 to $149,999
- 163$150,000 to $199,999
- 113$200,000 or more

Distribution of owner-occupied house/condo value
![Distribution of owner-occupied house/condo value]()
- 14$300,000 to $399,999
- 48$400,000 to $499,999
- 121$500,000 to $749,999
- 20$750,000 to $999,999
- 86$1,000,000 or more

Distribution of rent paid by renters
![Distribution of rent paid by renters]()
- 12$400 to $499
- 31$500 to $599
- 12$600 to $699
- 68$800 to $899
- 51$1,000 to $1,249
- 149$1,250 to $1,499
- 427$1,500 to $1,999
- 298$2,000 or more

Median rent in 2022:
| Little Italy: | $1,762 |
| San Diego: | $1,971 |
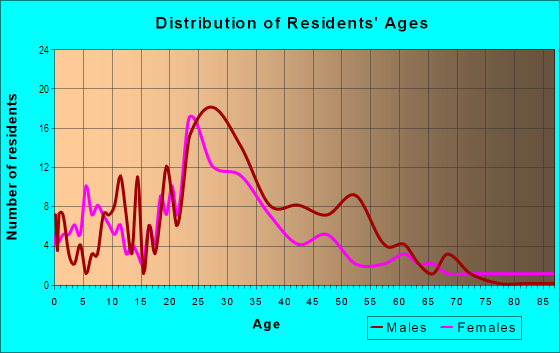
| Males: | 1,077 |
| Females: | 757 |
Males:
| This neighborhood: | 44.5 years |
| Whole city: | 35.4 years |
| This neighborhood: | 46.1 years |
| Whole city: | 37.2 years |
Average household size:
| Little Italy: | 1.4 people |
| San Diego: | 2.5 people |
Percentage of family households:
| Little Italy: | 13.0% |
| San Diego: | 41.7% |
| Here: | 15.3% |
| San Diego: | 43.2% |
Percentage of married-couple families with children (among all households):
| Little Italy: | 28.5% |
| San Diego: | 27.8% |
Percentage of single-mother households (among all households):
| Little Italy: | 38.7% |
| San Diego: | 7.9% |
Percentage of never married males 15 years old and over:
Percentage of never married females 15 years old and over:
| Little Italy: | 33.3% |
| San Diego: | 23.4% |
Percentage of never married females 15 years old and over:
| Little Italy: | 24.3% |
| city: | 18.8% |
Percentage of people that speak English not well or not at all:
| Little Italy: | 1.4% |
| San Diego: | 5.9% |
Percentage of people born in this state:
Percentage of people born in another U.S. state:
Percentage of native residents but born outside the U.S.:
Percentage of foreign born residents:
| Here: | 36.8% |
| San Diego: | 48.1% |
Percentage of people born in another U.S. state:
| Little Italy: | 45.9% |
| San Diego: | 24.9% |
Percentage of native residents but born outside the U.S.:
| Here: | 2.7% |
| city: | 2.4% |
Percentage of foreign born residents:
| Here: | 14.6% |
| San Diego: | 24.6% |

Owner-occupied
Renter-occupied


- Rooms in owner-occupied houses and condos in Little Italy
- 91 room
- 212 rooms
- 873 rooms
- 534 rooms
- 165 rooms
- 586 rooms
- 227 rooms
- 398 rooms
- 279+ rooms

- Rooms in renter-occupied apartments in Little Italy
- 2021 room
- 1452 rooms
- 2073 rooms
- 1264 rooms
- 2755 rooms
- 676 rooms
- 347 rooms
- 08 rooms
- 289+ rooms
Owner-occupied
Renter-occupied

- Bedrooms in owner-occupied houses and condos in Little Italy
- 9no bedroom
- 1241 bedroom
- 1402 bedrooms
- 393 bedrooms
- 04 bedrooms
- 195+ bedrooms

- Bedrooms in renter-occupied apartments in Little Italy
- 238no bedroom
- 2691 bedroom
- 4962 bedrooms
- 473 bedrooms
- 04 bedrooms
- 05+ bedrooms
Average number of cars or other vehicles available in houses/condos:
Average number of cars or other vehicles available in apartments:
| This neighborhood: | 1.2 |
| San Diego: | 2.1 |
Average number of cars or other vehicles available in apartments:
| Here: | 1.2 |
| city: | 1.6 |
Percentage of units with a mortgage:
| Little Italy: | 78.1% |
| San Diego: | 69.2% |
Housing prices:
- Average estimated value of detached houses in 2022 (17.3% of all units):
Little Italy: $2,045,154 San Diego: $1,227,596
- Average estimated value of townhouses or other attached units in 2022 (8.2% of all units):
This neighborhood: $1,059,652 city: $822,615
- Average estimated '22 value of housing units in 5-or-more-unit structures (4.1% of all units):
Little Italy: $1,177,331 San Diego: $704,051

- Year house built in Little Italy
- 02020 or later
- 442010 to 2019
- 282000 to 2009
- 751990 to 1999
- 871980 to 1989
- 1651970 to 1979
- 1931960 to 1969
- 3451950 to 1959
- 1261940 to 1949
- 2751939 or earlier

City-data.com crime index for city in 2020 (higher means more crime):
| City: | 197.8 |
| U.S. average: | 219.5 |
Travel time to work (commute)
![Travel time to work (commute)]()
- 56Less than 5 minutes
- 2005 to 9 minutes
- 37510 to 14 minutes
- 46715 to 19 minutes
- 28420 to 24 minutes
- 13225 to 29 minutes
- 19530 to 34 minutes
- 1735 to 39 minutes
- 1040 to 44 minutes
- 2845 to 59 minutes
- 13360 to 89 minutes
- 3690 or more minutes

Means of transportation to work
![Means of transportation to work]()
- 72.9%819Drove a car alone
- 1.2%14Carpooled
- 4.8%54Bus
- 1.6%18Motorcycle
- 1.7%19Bicycle
- 1.7%19Walked
- 4.2%47Other means
- 18.0%202Worked at home

Time leaving home to go to work
![Time leaving home to go to work]()
- 1012:00 a.m. to 4:59 a.m.
- 475:00 a.m. to 5:29 a.m.
- 475:30 a.m. to 5:59 a.m.
- 706:00 a.m. to 6:29 a.m.
- 1946:30 a.m. to 6:59 a.m.
- 3627:00 a.m. to 7:29 a.m.
- 3767:30 a.m. to 7:59 a.m.
- 1288:00 a.m. to 8:29 a.m.
- 1988:30 a.m. to 8:59 a.m.
- 2809:00 a.m. to 9:59 a.m.
- 8710:00 a.m. to 10:59 a.m.
- 14512:00 p.m. to 3:59 p.m.
- 834:00 p.m. to 11:59 p.m.

Occupations of males:
- Percentage of males in management occupations (except farmers):
Here: 18.5% city: 12.7%
- Percentage of males in business and financial operations occupations:
Here: 15.8% city: 6.6%
- Percentage of males in computer and mathematical occupations:
Here: 12.6% city: 8.8%
- Percentage of males in architecture and engineering occupations:
Here: 7.5% city: 6.5%
- Percentage of males in community and social services occupations:
Here: 4.8% city: 1.0%
- Percentage of males in legal occupations:
Here: 7.9% city: 1.7%
- Percentage of males in education, training, and library occupations:
Here: 4.1% city: 3.8%
- Percentage of males in arts, design, entertainment, sports, and media occupations:
Here: 8.1% city: 2.9%
- Percentage of males in healthcare practitioners and technical occupations:
Here: 5.0% city: 3.8%
- Percentage of males in service occupations:
Here: 12.6% city: 14.6%
- Percentage of males in sales and office occupations:
Here: 19.4% city: 13.9%
- Percentage of males in construction, extraction, and maintenance occupations:
Here: 7.7% city: 5.9%
- Percentage of males in production occupations:
Here: 4.5% city: 4.6%
- Percentage of males in transportation occupations:
Here: 5.0% city: 3.9%
Occupations of females:
- Percentage of females in management occupations (except farmers):
Here: 19.9% city: 10.2%
- Percentage of females in business and financial operations occupations:
Here: 34.7% city: 9.0%
- Percentage of females in architecture and engineering occupations:
Here: 9.7% city: 1.7%
- Percentage of females in life, physical, and social science occupations:
Here: 6.8% city: 3.2%
- Percentage of females in community and social services occupations:
Here: 7.9% city: 2.5%
- Percentage of females in legal occupations:
Here: 5.7% city: 1.8%
- Percentage of females in education, training, and library occupations:
Here: 16.8% city: 8.2%
- Percentage of females in healthcare practitioners and technical occupations:
Here: 13.6% city: 9.7%
- Percentage of females in service occupations:
Here: 14.8% city: 19.9%
- Percentage of females in sales and office occupations:
Here: 39.2% city: 22.0%
- Percentage of females in construction, extraction, and maintenance occupations:
Here: 2.4% city: 0.2%
Percentage of people 16-64 in Armed Forces:
| Little Italy: | 1.2% |
| San Diego: | 4.0% |
Education in this neighborhood (subdivision or community):
- Percentage of people 3 years and older in K-12 schools:
Little Italy: 4.3% San Diego: 13.8%
- Percentage of people 3 years and older in undergraduate colleges:
Little Italy: 6.5% San Diego: 8.5%
- Percentage of people 3 years and older in grad. or professional schools:
Little Italy: 11.0% San Diego: 2.3%
- Percentage of students K-12 enrolled in private schools:
Little Italy: 0.0% San Diego: 13.6%
Percentage of population below poverty level:
| Little Italy: | 10.8% |
| San Diego: | 11.3% |
Median year owner moved in (as recorded in 2022):
Median year renter moved in (as recorded in 2022):
| Little Italy: | 2013 |
| San Diego: | 2010 |
Median year renter moved in (as recorded in 2022):
| Little Italy: | 2016 |
| San Diego: | 2020 |
Percentage of married-couple families with both working:
| Little Italy: | 100.0% |
| San Diego: | 66.0% |

- 45.5%Utility gas
- 35.1%Electricity
- 10.6%No fuel used
- 3.3%Bottled, tank, or LP gas
- 3.1%Fuel oil, kerosene, etc.
- 2.3%Wood
Limited-access highways (interstate or state) in this neighborhood:
San Diego Fwy (I- 5)
Length: 0.61 miles
Direction: SE-NW
Direction: SE-NW
Roads and streets:
State St
Length: 0.72 miles
Directions: N-S, SE-NW
Address range: 1400 to 2399
Directions: N-S, SE-NW
Address range: 1400 to 2399
India St
Length: 0.69 miles
Directions: N-S, SE-NW
Address range: 1400 to 2399
Directions: N-S, SE-NW
Address range: 1400 to 2399
Columbia St
Length: 0.67 miles
Directions: E-W, N-S, SE-NW, SW-NE
Address range: 1400 to 2299
Directions: E-W, N-S, SE-NW, SW-NE
Address range: 1400 to 2299
Union St
Length: 0.27 miles
Directions: N-S, SE-NW
Address range: 1400 to 1699
Directions: N-S, SE-NW
Address range: 1400 to 1699
W Ash St
Length: 0.24 miles
Direction: E-W
Address range: 200 to 599
Direction: E-W
Address range: 200 to 599
W Beech St
Length: 0.24 miles
Direction: E-W
Address range: 200 to 599
Direction: E-W
Address range: 200 to 599
W Cedar St
Length: 0.24 miles
Direction: E-W
Address range: 200 to 599
Direction: E-W
Address range: 200 to 599
W Date St
Length: 0.24 miles
Direction: E-W
Address range: 200 to 599
Direction: E-W
Address range: 200 to 599
Front St
Length: 0.21 miles
Direction: N-S
Address range: 1400 to 1699
Direction: N-S
Address range: 1400 to 1699
W Grape St
Length: 0.19 miles
Direction: E-W
Address range: 400 to 699
Direction: E-W
Address range: 400 to 699
W Hawthorn St
Length: 0.13 miles
Direction: E-W
Address range: 500 to 799
Direction: E-W
Address range: 500 to 799
W Fir St
Length: 0.12 miles
Direction: E-W
Address range: 400 to 619
Direction: E-W
Address range: 400 to 619
W Elm St
Length: 0.06 miles
Direction: E-W
Address range: 400 to 499
Direction: E-W
Address range: 400 to 499
W Ivy St
Length: 0.06 miles
Direction: E-W
Address range: 700 to 799
Direction: E-W
Address range: 700 to 799
W Kalmia St
Length: 0.06 miles
Directions: E-W, SW-NE
Address range: 700 to 899
Directions: E-W, SW-NE
Address range: 700 to 899
W Juniper St
Length: 0.05 miles
Direction: E-W
Address range: 700 to 799
Direction: E-W
Address range: 700 to 799