Logan Park neighborhood in Lynnwood, Washington (WA), 98036 detailed profile
Settings
X


Business Search - 14 Million verified businesses
Area: 0.265 square miles
Population: 1,419
Population density:
| Logan Park: | 5,362 people per square mile |
| Lynnwood: | 5,219 people per square mile |

- 93866.0%White
- 24217.0%Asian
- 1248.7%Hispanic or Latino
- 986.9%Two or more races
- 151.1%Some other race
- 40.3%Black

Median household income in 2022:
| Logan Park: | $156,797 |
| Lynnwood: | $72,241 |
Distribution of median household income
![Distribution of median household income]()
- 2Less than $10,000
- 10$10,000 to $19,999
- 10$20,000 to $29,999
- 29$30,000 to $39,999
- 18$40,000 to $49,999
- 1$50,000 to $59,999
- 10$60,000 to $74,999
- 8$75,000 to $99,999
- 14$100,000 to $124,999
- 110$125,000 to $149,999
- 134$150,000 to $199,999
- 120$200,000 or more

Distribution of owner-occupied house/condo value
![Distribution of owner-occupied house/condo value]()
- 3Less than $50,000
- 2$50,000 to $99,999
- 25$400,000 to $499,999
- 116$500,000 to $749,999
- 224$750,000 to $999,999
- 37$1,000,000 or more

Distribution of rent paid by renters
![Distribution of rent paid by renters]()
- 11$1,000 to $1,249
- 24$1,500 to $1,999
- 16$2,000 or more

Median rent in 2022:
| Logan Park: | $1,740 |
| Lynnwood: | $1,466 |
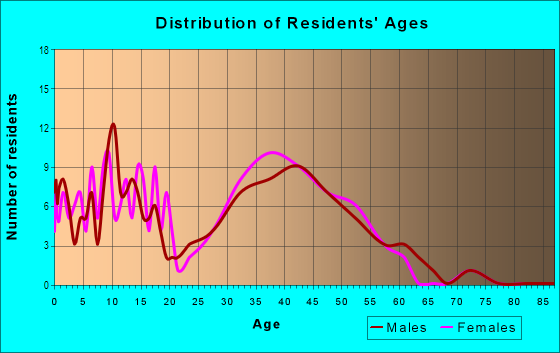
| Males: | 719 |
| Females: | 699 |
Males:
| This neighborhood: | 37.4 years |
| Whole city: | 38.5 years |
| This neighborhood: | 43.5 years |
| Whole city: | 40.7 years |
Average household size:
| Logan Park: | 3.2 people |
| Lynnwood: | 2.5 people |
Percentage of family households:
| Logan Park: | 64.6% |
| Lynnwood: | 42.8% |
| Here: | 75.9% |
| Lynnwood: | 41.5% |
Percentage of married-couple families with children (among all households):
| Logan Park: | 26.8% |
| Lynnwood: | 30.2% |
Percentage of single-mother households (among all households):
| Logan Park: | 4.5% |
| Lynnwood: | 6.8% |
Percentage of never married males 15 years old and over:
Percentage of never married females 15 years old and over:
| Logan Park: | 21.3% |
| Lynnwood: | 19.2% |
Percentage of never married females 15 years old and over:
| Logan Park: | 14.4% |
| city: | 15.0% |
Percentage of people that speak English not well or not at all:
| Logan Park: | 0.0% |
| Lynnwood: | 7.8% |
Percentage of people born in this state:
Percentage of people born in another U.S. state:
Percentage of native residents but born outside the U.S.:
Percentage of foreign born residents:
| Here: | 58.8% |
| Lynnwood: | 42.0% |
Percentage of people born in another U.S. state:
| Logan Park: | 26.9% |
| Lynnwood: | 25.3% |
Percentage of native residents but born outside the U.S.:
| Here: | 1.5% |
| city: | 2.5% |
Percentage of foreign born residents:
| Here: | 12.8% |
| Lynnwood: | 30.1% |

Owner-occupied
Renter-occupied


- Rooms in owner-occupied houses and condos in Logan Park
- 01 room
- 02 rooms
- 03 rooms
- 124 rooms
- 395 rooms
- 176 rooms
- 1597 rooms
- 978 rooms
- 749+ rooms

- Rooms in renter-occupied apartments in Logan Park
- 91 room
- 02 rooms
- 103 rooms
- 14 rooms
- 05 rooms
- 06 rooms
- 237 rooms
- 48 rooms
- 19+ rooms
Owner-occupied
Renter-occupied

- Bedrooms in owner-occupied houses and condos in Logan Park
- 0no bedroom
- 01 bedroom
- 02 bedrooms
- 1723 bedrooms
- 2024 bedrooms
- 255+ bedrooms

- Bedrooms in renter-occupied apartments in Logan Park
- 9no bedroom
- 101 bedroom
- 12 bedrooms
- 233 bedrooms
- 44 bedrooms
- 05+ bedrooms
Average number of cars or other vehicles available in houses/condos:
Average number of cars or other vehicles available in apartments:
| This neighborhood: | 2.7 |
| Lynnwood: | 2.1 |
Average number of cars or other vehicles available in apartments:
| Here: | 3.4 |
| city: | 1.3 |
Percentage of units with a mortgage:
| Logan Park: | 59.8% |
| Lynnwood: | 70.4% |
Average estimated value of detached houses in 2022 (92.3% of all units):
| Logan Park: | $802,689 |
| Lynnwood: | $639,462 |

- Year house built in Logan Park
- 12020 or later
- 412010 to 2019
- 312000 to 2009
- 231990 to 1999
- 1351980 to 1989
- 341970 to 1979
- 991960 to 1969
- 181950 to 1959
- 11940 to 1949
- 601939 or earlier

City-data.com crime index for city in 2020 (higher means more crime):
| City: | 283.8 |
| U.S. average: | 219.5 |
Travel time to work (commute)
![Travel time to work (commute)]()
- 7Less than 5 minutes
- 125 to 9 minutes
- 1010 to 14 minutes
- 3715 to 19 minutes
- 5620 to 24 minutes
- 3025 to 29 minutes
- 4630 to 34 minutes
- 1135 to 39 minutes
- 840 to 44 minutes
- 8345 to 59 minutes
- 1860 to 89 minutes
- 690 or more minutes

Means of transportation to work
![Means of transportation to work]()
- 69.1%453Drove a car alone
- 4.4%29Carpooled
- 5.2%34Bus
- 0.3%2Long-distance train or commuter rail
- 0.2%1Ferryboat
- 0.3%2Taxi
- 0.2%1Motorcycle
- 0.8%5Bicycle
- 2.3%15Walked
- 1.7%11Other means
- 16.9%111Worked at home

Time leaving home to go to work
![Time leaving home to go to work]()
- 612:00 a.m. to 4:59 a.m.
- 125:00 a.m. to 5:29 a.m.
- 185:30 a.m. to 5:59 a.m.
- 316:00 a.m. to 6:29 a.m.
- 356:30 a.m. to 6:59 a.m.
- 267:00 a.m. to 7:29 a.m.
- 227:30 a.m. to 7:59 a.m.
- 408:00 a.m. to 8:29 a.m.
- 178:30 a.m. to 8:59 a.m.
- 209:00 a.m. to 9:59 a.m.
- 2210:00 a.m. to 10:59 a.m.
- 211:00 a.m. to 11:59 a.m.
- 1412:00 p.m. to 3:59 p.m.
- 134:00 p.m. to 11:59 p.m.

Occupations of males:
- Percentage of males in management occupations (except farmers):
Here: 8.6% city: 10.7%
- Percentage of males in business and financial operations occupations:
Here: 4.6% city: 6.3%
- Percentage of males in computer and mathematical occupations:
Here: 20.3% city: 7.0%
- Percentage of males in architecture and engineering occupations:
Here: 1.8% city: 3.1%
- Percentage of males in community and social services occupations:
Here: 3.7% city: 1.8%
- Percentage of males in education, training, and library occupations:
Here: 7.4% city: 1.8%
- Percentage of males in arts, design, entertainment, sports, and media occupations:
Here: 4.3% city: 1.3%
- Percentage of males in healthcare practitioners and technical occupations:
Here: 4.3% city: 1.4%
- Percentage of males in service occupations:
Here: 8.3% city: 17.8%
- Percentage of males in sales and office occupations:
Here: 20.9% city: 14.5%
- Percentage of males in construction, extraction, and maintenance occupations:
Here: 7.1% city: 8.5%
- Percentage of males in production occupations:
Here: 1.8% city: 4.8%
- Percentage of males in transportation occupations:
Here: 4.0% city: 7.3%
- Percentage of males in material moving occupations:
Here: 1.7% city: 5.3%
Occupations of females:
- Percentage of females in management occupations (except farmers):
Here: 18.6% city: 6.8%
- Percentage of females in business and financial operations occupations:
Here: 2.2% city: 7.0%
- Percentage of females in computer and mathematical occupations:
Here: 1.6% city: 1.3%
- Percentage of females in life, physical, and social science occupations:
Here: 1.6% city: 0.9%
- Percentage of females in education, training, and library occupations:
Here: 9.3% city: 7.8%
- Percentage of females in arts, design, entertainment, sports, and media occupations:
Here: 2.5% city: 4.0%
- Percentage of females in healthcare practitioners and technical occupations:
Here: 8.2% city: 10.6%
- Percentage of females in service occupations:
Here: 32.5% city: 21.4%
- Percentage of females in sales and office occupations:
Here: 22.4% city: 27.9%
- Percentage of females in production occupations:
Here: 2.7% city: 3.2%
Education in this neighborhood (subdivision or community):
- Percentage of people 3 years and older in K-12 schools:
Logan Park: 12.9% Lynnwood: 13.6%
- Percentage of people 3 years and older in undergraduate colleges:
Logan Park: 10.9% Lynnwood: 6.0%
- Percentage of people 3 years and older in grad. or professional schools:
Logan Park: 1.5% Lynnwood: 1.1%
- Percentage of students K-12 enrolled in private schools:
Logan Park: 7.8% Lynnwood: 12.3%
Percentage of population below poverty level:
| Logan Park: | 4.1% |
| Lynnwood: | 14.9% |
Median year owner moved in (as recorded in 2022):
Median year renter moved in (as recorded in 2022):
| Logan Park: | 2007 |
| Lynnwood: | 2008 |
Median year renter moved in (as recorded in 2022):
| Logan Park: | 2015 |
| Lynnwood: | 2016 |
Percentage of married-couple families with both working:
| Logan Park: | 78.0% |
| Lynnwood: | 64.7% |

- 49.2%Utility gas
- 45.4%Electricity
- 3.1%Bottled, tank, or LP gas
- 1.3%Wood
- 1.0%Fuel oil, kerosene, etc.
Roads and streets:
Logan Rd
Length: 0.73 miles
Directions: E-W, SE-NW, SW-NE
Address range: 820 to 1599
Directions: E-W, SE-NW, SW-NE
Address range: 820 to 1599
Crawford Rd
Length: 0.53 miles
Directions: E-W, N-S, SE-NW, SW-NE
Address range: 20558 to 20898
Directions: E-W, N-S, SE-NW, SW-NE
Address range: 20558 to 20898
211th Pl SW
Length: 0.43 miles
Directions: E-W, SE-NW
Address range: 1100 to 1499
Directions: E-W, SE-NW
Address range: 1100 to 1499
Locust Way
Length: 0.37 miles
Directions: N-S, SE-NW
Address range: 20750 to 21299
Directions: N-S, SE-NW
Address range: 20750 to 21299
212th Pl SW
Length: 0.37 miles
Directions: E-W, N-S
Address range: 1200 to 1499
Directions: E-W, N-S
Address range: 1200 to 1499
210th Pl SW
Length: 0.32 miles
Directions: E-W, N-S, SE-NW, SW-NE
Address range: 800 to 1139
Directions: E-W, N-S, SE-NW, SW-NE
Address range: 800 to 1139
13th Pl W
Length: 0.31 miles
Directions: E-W, N-S, SE-NW, SW-NE
Address range: 21201 to 22064
Directions: E-W, N-S, SE-NW, SW-NE
Address range: 21201 to 22064
12th Ave W
Length: 0.27 miles
Directions: E-W, N-S, SE-NW, SW-NE
Address range: 21000 to 21099
Directions: E-W, N-S, SE-NW, SW-NE
Address range: 21000 to 21099
Elberta Rd
Length: 0.25 miles
Directions: E-W, N-S, SE-NW, SW-NE
Address range: 20700 to 21027
Directions: E-W, N-S, SE-NW, SW-NE
Address range: 20700 to 21027
Damson Rd
Length: 0.12 miles
Directions: N-S, SW-NE
Address range: 20500 to 20805
Directions: N-S, SW-NE
Address range: 20500 to 20805
14th Pl W
Length: 0.11 miles
Directions: N-S, SE-NW
Address range: 20700 to 21799
Directions: N-S, SE-NW
Address range: 20700 to 21799
10th Pl W
Length: 0.11 miles
Directions: N-S, SE-NW
Address range: 20500 to 21099
Directions: N-S, SE-NW
Address range: 20500 to 21099
213th Pl SW
Length: 0.08 miles
Direction: E-W
Address range: 1500 to 1699
Direction: E-W
Address range: 1500 to 1699
9th Pl W
Length: 0.07 miles
Directions: N-S, SE-NW
Address range: 20900 to 20999
Directions: N-S, SE-NW
Address range: 20900 to 20999
Olympic Pl
Length: 0.06 miles
Directions: E-W, SE-NW
Address range: 20600 to 20799
Directions: E-W, SE-NW
Address range: 20600 to 20799
208th Pl SW
Length: 0.05 miles
Direction: E-W
Direction: E-W
208th St SW
Length: 0.03 miles
Direction: SE-NW
Address range: 1000 to 1099
Direction: SE-NW
Address range: 1000 to 1099