Logan Park neighborhood in Minneapolis, Minnesota (MN), 55413, 55418 detailed profile
Settings
X

Business Search - 14 Million verified businesses
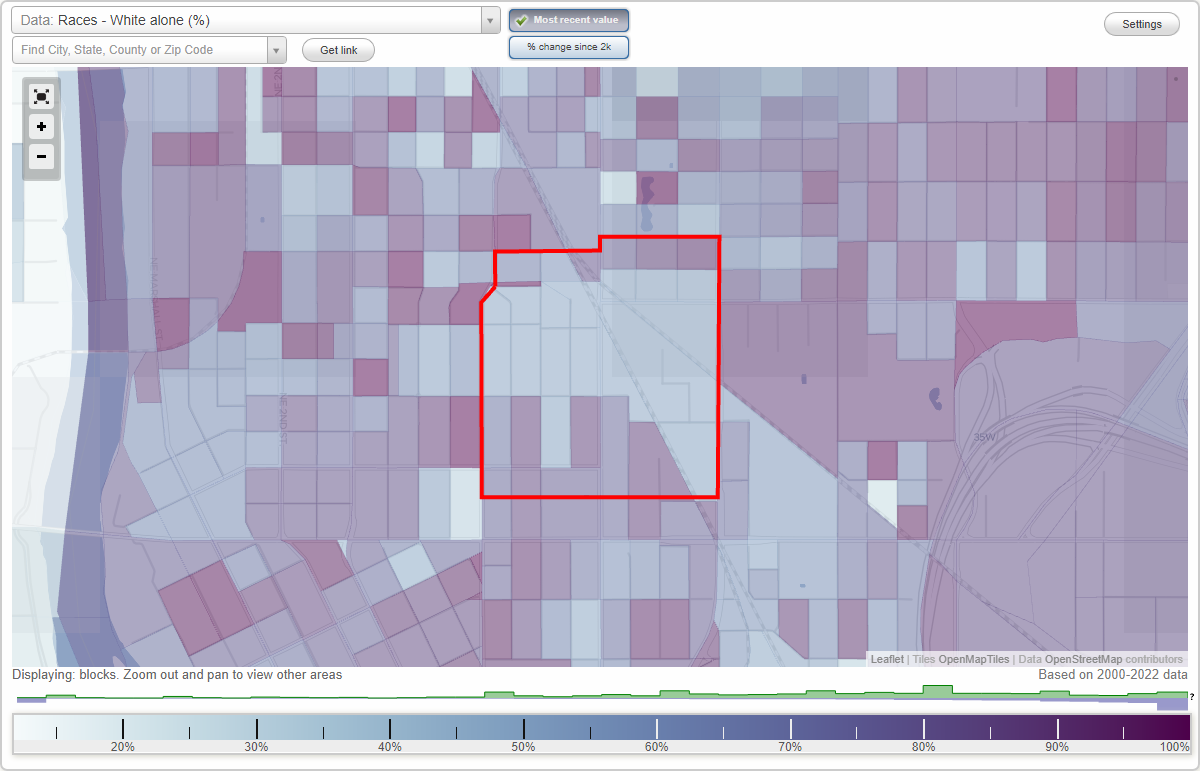
Area: 0.262 square miles
Population: 2,290
Population density:
| Logan Park: | 8,750 people per square mile |
| Minneapolis: | 7,744 people per square mile |

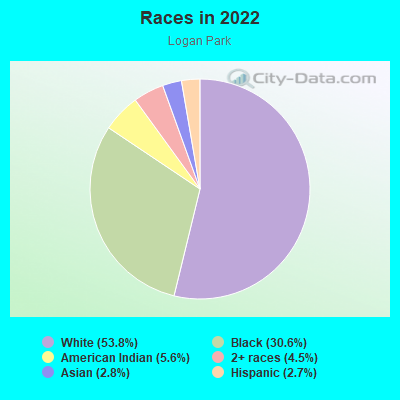
- 1,55653.8%White
- 88430.6%Black
- 1625.6%American Indian
- 1304.5%Two or more races
- 822.8%Asian
- 782.7%Hispanic or Latino
Distribution of median household income
![Distribution of median household income]()
- 56Less than $10,000
- 231$10,000 to $19,999
- 786$20,000 to $29,999
- 85$30,000 to $39,999
- 152$40,000 to $49,999
- 98$50,000 to $59,999
- 79$60,000 to $74,999
- 166$75,000 to $99,999
- 144$100,000 to $124,999
- 152$125,000 to $149,999
- 133$150,000 to $199,999
- 60$200,000 or more

Distribution of owner-occupied house/condo value
![Distribution of owner-occupied house/condo value]()
- 79Less than $50,000
- 149$50,000 to $99,999
- 139$100,000 to $149,999
- 112$150,000 to $199,999
- 61$200,000 to $249,999
- 77$250,000 to $299,999
- 216$300,000 to $399,999
- 83$400,000 to $499,999
- 27$500,000 to $749,999
- 36$750,000 to $999,999
- 23$1,000,000 or more

Distribution of rent paid by renters
![Distribution of rent paid by renters]()
- 29Less than $100
- 276$100 to $199
- 201$200 to $299
- 503$300 to $399
- 125$400 to $499
- 168$500 to $599
- 760$600 to $699
- 117$700 to $799
- 32$800 to $899
- 47$900 to $999
- 216$1,000 to $1,249
- 75$1,250 to $1,499
- 73$1,500 to $1,999
- 33$2,000 or more

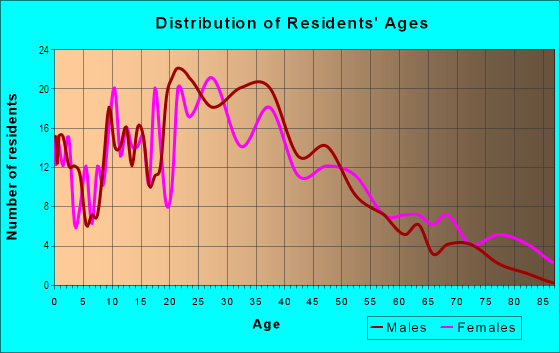
| Males: | 1,067 |
| Females: | 1,223 |
Males:
| This neighborhood: | |
| Whole city: |
| This neighborhood: | |
| Whole city: |
Percentage of family households:
| Logan Park: | 27.3% |
| Minneapolis: | 34.1% |
| Here: | 38.1% |
| Minneapolis: | 29.8% |
Percentage of married-couple families with children (among all households):
| Logan Park: | 28.9% |
| Minneapolis: | 31.8% |
Percentage of single-mother households (among all households):
| Logan Park: | 32.4% |
| Minneapolis: | 10.5% |
Percentage of never married males 15 years old and over:
Percentage of never married females 15 years old and over:
| Logan Park: | 16.7% |
| Minneapolis: | 27.0% |
Percentage of never married females 15 years old and over:
| Logan Park: | 29.2% |
| city: | 25.4% |
Percentage of people that speak English not well or not at all:
| Logan Park: | 1.6% |
| Minneapolis: | 3.8% |
Percentage of people born in this state:
Percentage of people born in another U.S. state:
Percentage of native residents but born outside the U.S.:
Percentage of foreign born residents:
| Here: | 46.1% |
| Minneapolis: | 51.9% |
Percentage of people born in another U.S. state:
| Logan Park: | 35.2% |
| Minneapolis: | 31.8% |
Percentage of native residents but born outside the U.S.:
| Here: | 0.7% |
| city: | 1.5% |
Percentage of foreign born residents:
| Here: | 18.0% |
| Minneapolis: | 14.7% |
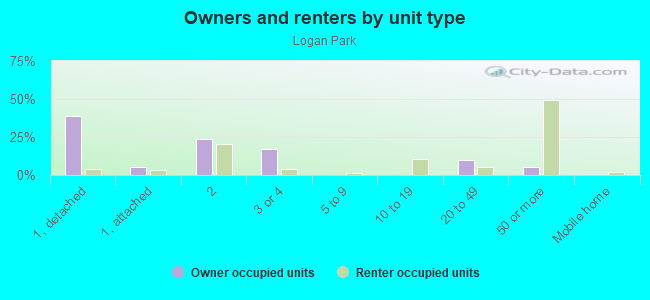
Owner-occupied
Renter-occupied

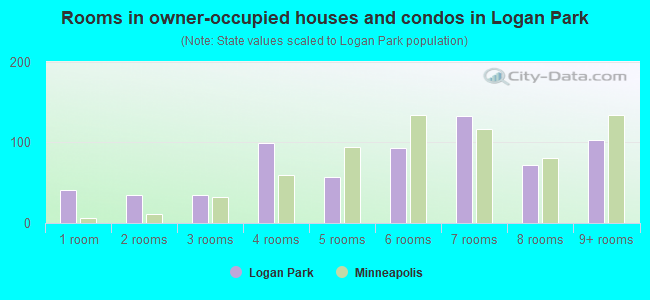
- Rooms in owner-occupied houses and condos in Logan Park
- 411 room
- 352 rooms
- 353 rooms
- 994 rooms
- 575 rooms
- 936 rooms
- 1337 rooms
- 728 rooms
- 1039+ rooms
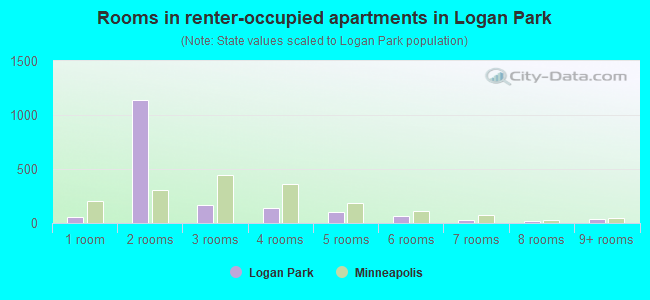
- Rooms in renter-occupied apartments in Logan Park
- 551 room
- 1,1432 rooms
- 1643 rooms
- 1424 rooms
- 1055 rooms
- 686 rooms
- 277 rooms
- 168 rooms
- 389+ rooms
Owner-occupied
Renter-occupied
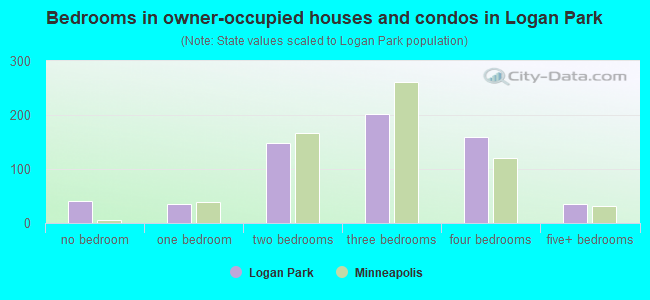
- Bedrooms in owner-occupied houses and condos in Logan Park
- 41no bedroom
- 361 bedroom
- 1492 bedrooms
- 2023 bedrooms
- 1604 bedrooms
- 365+ bedrooms
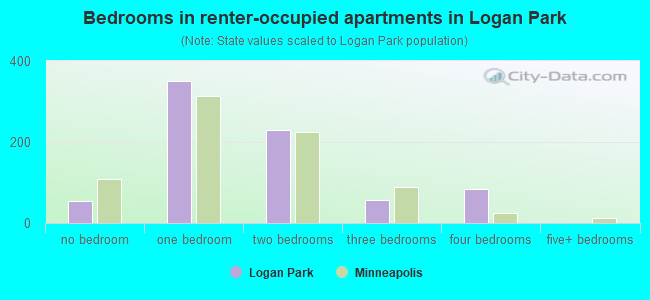
- Bedrooms in renter-occupied apartments in Logan Park
- 55no bedroom
- 3501 bedroom
- 2292 bedrooms
- 563 bedrooms
- 844 bedrooms
- 05+ bedrooms
Average number of cars or other vehicles available in houses/condos:
Average number of cars or other vehicles available in apartments:
| This neighborhood: | |
| Minneapolis: |
Average number of cars or other vehicles available in apartments:
| Here: | |
| city: |
Percentage of units with a mortgage:
| Logan Park: | 73.8% |
| Minneapolis: | 71.8% |
Housing prices:
- Average estimated value of detached houses in 2022 (24.1% of all units):
Logan Park: $347,124 Minnesota: $374,552
- Average estimated value of housing units in 2-unit structures in 2022 (35.6% of all units):
This neighborhood: $331,688 Minnesota: $323,045
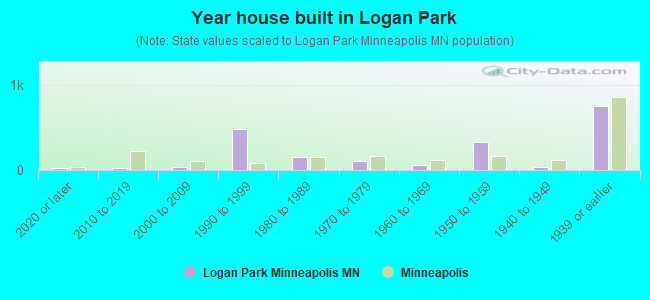
- Year house built in Logan Park
- 262020 or later
- 232010 to 2019
- 352000 to 2009
- 4761990 to 1999
- 1541980 to 1989
- 1081970 to 1979
- 621960 to 1969
- 3261950 to 1959
- 381940 to 1949
- 7481939 or earlier
City-data.com crime index for city in 2020 (higher means more crime):
| City: | 600.2 |
| U.S. average: | 219.5 |
Travel time to work (commute)
![Travel time to work (commute)]()
- 47Less than 5 minutes
- 895 to 9 minutes
- 22110 to 14 minutes
- 17915 to 19 minutes
- 20220 to 24 minutes
- 29425 to 29 minutes
- 5330 to 34 minutes
- 2635 to 39 minutes
- 4040 to 44 minutes
- 5245 to 59 minutes
- 5260 to 89 minutes
- 290 or more minutes

Means of transportation to work
![Means of transportation to work]()
- 64.5%914Drove a car alone
- 5.9%84Carpooled
- 10.7%151Bus
- 1.3%18Light rail, streetcar or trolley
- 2.5%35Motorcycle
- 5.4%77Bicycle
- 4.8%68Walked
- 16.1%228Other means
- 12.0%170Worked at home

Time leaving home to go to work
![Time leaving home to go to work]()
- 3212:00 a.m. to 4:59 a.m.
- 415:00 a.m. to 5:29 a.m.
- 295:30 a.m. to 5:59 a.m.
- 706:00 a.m. to 6:29 a.m.
- 946:30 a.m. to 6:59 a.m.
- 1087:00 a.m. to 7:29 a.m.
- 3527:30 a.m. to 7:59 a.m.
- 1378:00 a.m. to 8:29 a.m.
- 1048:30 a.m. to 8:59 a.m.
- 1609:00 a.m. to 9:59 a.m.
- 7110:00 a.m. to 10:59 a.m.
- 2711:00 a.m. to 11:59 a.m.
- 14512:00 p.m. to 3:59 p.m.
- 244:00 p.m. to 11:59 p.m.

Occupations of males:
- Percentage of males in management occupations (except farmers):
Here: 6.7% city: 12.1%
- Percentage of males in business and financial operations occupations:
Here: 3.4% city: 9.1%
- Percentage of males in computer and mathematical occupations:
Here: 9.0% city: 8.4%
- Percentage of males in architecture and engineering occupations:
Here: 12.5% city: 4.6%
- Percentage of males in life, physical, and social science occupations:
Here: 4.8% city: 2.0%
- Percentage of males in legal occupations:
Here: 4.2% city: 2.0%
- Percentage of males in education, training, and library occupations:
Here: 8.1% city: 5.2%
- Percentage of males in arts, design, entertainment, sports, and media occupations:
Here: 20.0% city: 4.0%
- Percentage of males in healthcare practitioners and technical occupations:
Here: 1.3% city: 3.6%
- Percentage of males in service occupations:
Here: 10.8% city: 12.6%
- Percentage of males in sales and office occupations:
Here: 12.7% city: 15.3%
- Percentage of males in production occupations:
Here: 1.3% city: 5.8%
- Percentage of males in transportation occupations:
Here: 3.1% city: 4.1%
- Percentage of males in material moving occupations:
Here: 1.9% city: 3.6%
Occupations of females:
- Percentage of females in management occupations (except farmers):
Here: 7.7% city: 11.4%
- Percentage of females in business and financial operations occupations:
Here: 10.8% city: 9.8%
- Percentage of females in community and social services occupations:
Here: 1.8% city: 3.8%
- Percentage of females in legal occupations:
Here: 6.3% city: 2.3%
- Percentage of females in education, training, and library occupations:
Here: 10.5% city: 10.6%
- Percentage of females in arts, design, entertainment, sports, and media occupations:
Here: 9.5% city: 5.6%
- Percentage of females in healthcare practitioners and technical occupations:
Here: 16.9% city: 8.3%
- Percentage of females in service occupations:
Here: 5.7% city: 17.8%
- Percentage of females in sales and office occupations:
Here: 26.2% city: 18.7%
- Percentage of females in production occupations:
Here: 2.5% city: 2.7%
- Percentage of females in material moving occupations:
Here: 1.2% city: 1.5%
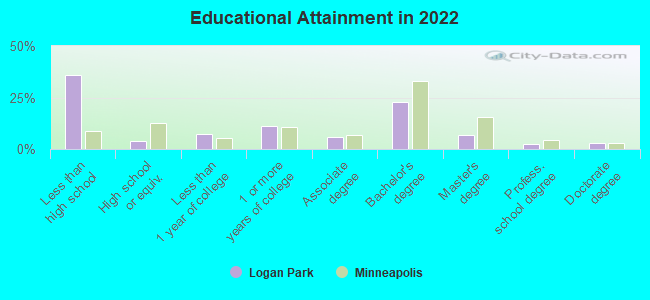
Education in this neighborhood (subdivision or community):
- Percentage of people 3 years and older in K-12 schools:
Logan Park: 18.0% Minneapolis: 14.0%
- Percentage of people 3 years and older in undergraduate colleges:
Logan Park: 2.0% Minneapolis: 8.6%
- Percentage of people 3 years and older in grad. or professional schools:
Logan Park: 4.8% Minneapolis: 2.9%
- Percentage of students K-12 enrolled in private schools:
Logan Park: 24.7% Minneapolis: 14.1%
Percentage of population below poverty level:
| Logan Park: | 14.9% |
| Minneapolis: | 17.2% |
Percentage of married-couple families with both working:
| Logan Park: | 113.9% |
| Minneapolis: | 73.9% |
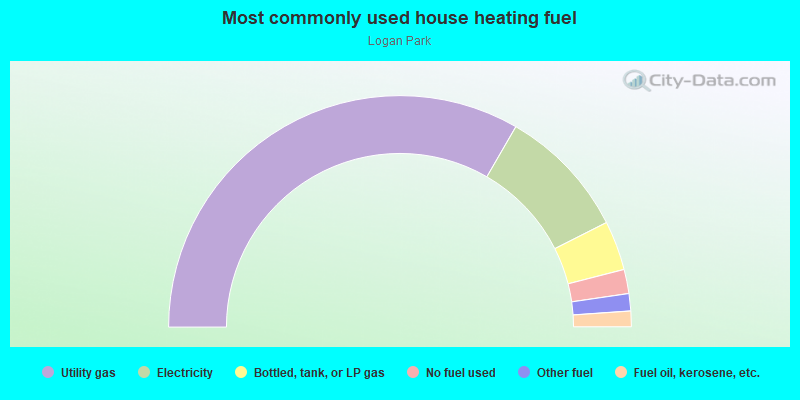
- 66.7%Utility gas
- 18.4%Electricity
- 6.9%Bottled, tank, or LP gas
- 3.4%No fuel used
- 2.4%Other fuel
- 2.2%Fuel oil, kerosene, etc.
Highways in this neighborhood:
Central Ave NE (State Hwy 65)
Length: 0.44 miles
Direction: N-S
Address range: 1301 to 1849
Direction: N-S
Address range: 1301 to 1849
Roads and streets:
15th Ave NE
Length: 0.46 miles
Direction: E-W
Address range: 646 to 899
Direction: E-W
Address range: 646 to 899
Monroe St NE
Length: 0.42 miles
Directions: N-S, SE-NW
Address range: 1300 to 1827
Directions: N-S, SE-NW
Address range: 1300 to 1827
Jefferson St NE
Length: 0.39 miles
Directions: N-S, SW-NE
Address range: 1300 to 1799
Directions: N-S, SW-NE
Address range: 1300 to 1799
Madison St NE
Length: 0.36 miles
Directions: N-S, SE-NW
Address range: 1300 to 1799
Directions: N-S, SE-NW
Address range: 1300 to 1799
18th 1/2 Ave NE
Length: 0.35 miles
Direction: E-W
Address range: 700 to 931
Direction: E-W
Address range: 700 to 931
18th Ave NE
Length: 0.35 miles
Direction: E-W
Address range: 700 to 921
Direction: E-W
Address range: 700 to 921
Adams St NE
Length: 0.34 miles
Direction: N-S
Address range: 1300 to 1799
Direction: N-S
Address range: 1300 to 1799
17th Ave NE
Length: 0.26 miles
Direction: E-W
Address range: 639 to 699
Direction: E-W
Address range: 639 to 699
13th Ave NE
Length: 0.26 miles
Direction: E-W
Address range: 631 to 699
Direction: E-W
Address range: 631 to 699
14th Ave NE
Length: 0.26 miles
Direction: E-W
Address range: 800 to 949
Direction: E-W
Address range: 800 to 949
Quincy St NE
Length: 0.12 miles
Directions: N-S, SE-NW
Address range: 1400 to 1849
Directions: N-S, SE-NW
Address range: 1400 to 1849
Jackson St NE
Length: 0.11 miles
Direction: N-S
Address range: 1500 to 1826
Direction: N-S
Address range: 1500 to 1826
Van Buren St NE
Length: 0.08 miles
Direction: N-S
Address range: 1300 to 1499
Direction: N-S
Address range: 1300 to 1499
Railroad features:
Burlington Northern Santa Fe Rlwy
Length: 1.00 miles
Directions: E-W, SE-NW, SW-NE
Directions: E-W, SE-NW, SW-NE