Lone Bluff neighborhood in San Jose, California (CA), 95111 detailed profile
Settings
X

Business Search - 14 Million verified businesses
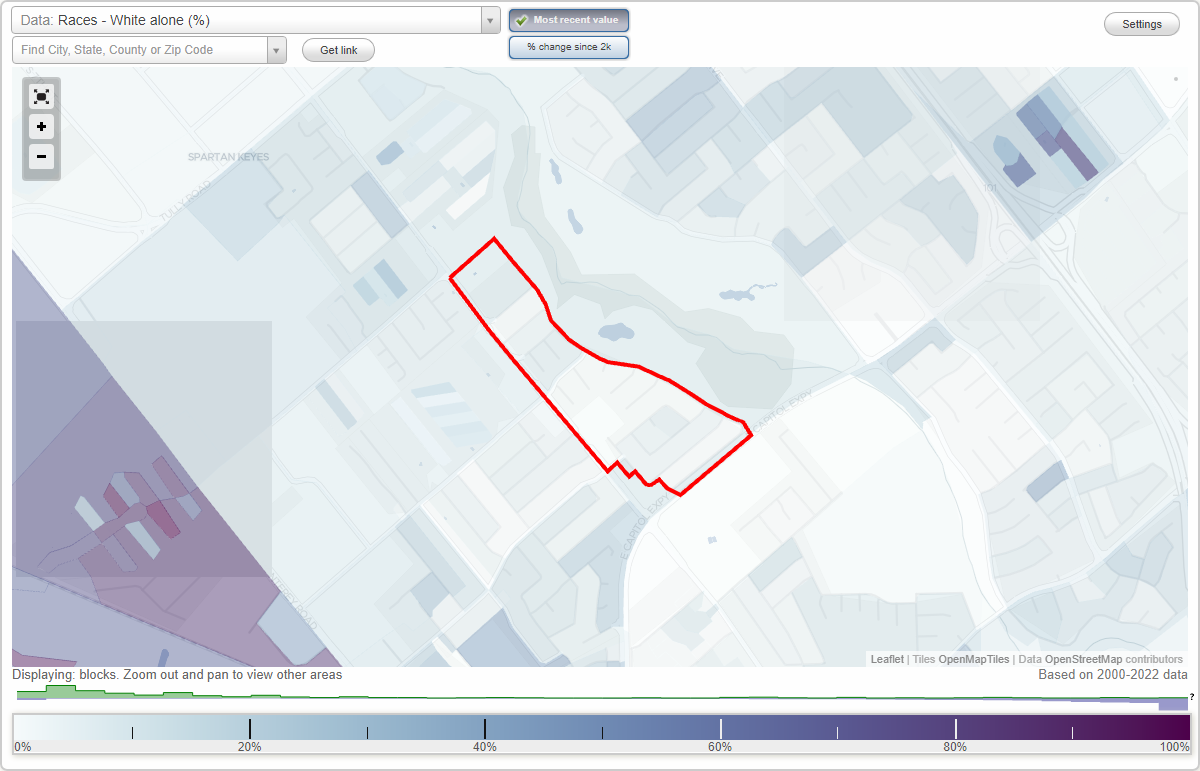
Area: 0.138 square miles
Population: 2,361
Population density:
| Lone Bluff: | 17,131 people per square mile |
| San Jose: | 5,554 people per square mile |

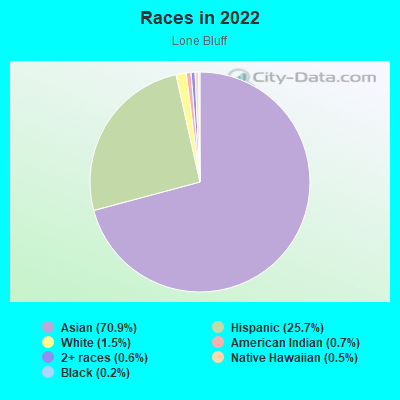
- 1,68370.9%Asian
- 60925.7%Hispanic or Latino
- 351.5%White
- 160.7%American Indian
- 140.6%Two or more races
- 110.5%Native Hawaiian and Other
Pacific Islander - 50.2%Black
Median household income in 2022:
| Lone Bluff: | $85,341 |
| San Jose: | $133,835 |
Distribution of median household income
![Distribution of median household income]()
- 7Less than $10,000
- 59$10,000 to $19,999
- 18$20,000 to $29,999
- 27$30,000 to $39,999
- 17$40,000 to $49,999
- 105$50,000 to $59,999
- 102$60,000 to $74,999
- 74$75,000 to $99,999
- 26$100,000 to $124,999
- 40$125,000 to $149,999
- 23$150,000 to $199,999
- 42$200,000 or more

Distribution of owner-occupied house/condo value
![Distribution of owner-occupied house/condo value]()
- 29Less than $50,000
- 4$50,000 to $99,999
- 28$100,000 to $149,999
- 9$150,000 to $199,999
- 62$200,000 to $249,999
- 22$250,000 to $299,999
- 66$300,000 to $399,999
- 16$400,000 to $499,999
- 47$500,000 to $749,999
- 84$750,000 to $999,999
- 10$1,000,000 or more

Distribution of rent paid by renters
![Distribution of rent paid by renters]()
- 4Less than $100
- 20$200 to $299
- 16$300 to $399
- 13$500 to $599
- 25$600 to $699
- 19$700 to $799
- 3$900 to $999
- 4$1,000 to $1,249
- 18$1,250 to $1,499
- 122$1,500 to $1,999
- 159$2,000 or more

Median rent in 2022:
| Lone Bluff: | $1,865 |
| San Jose: | $2,001 |
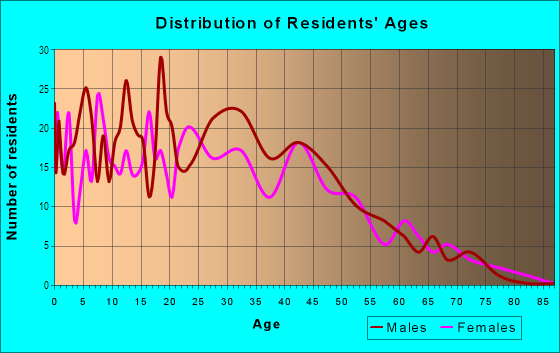
| Males: | 1,129 |
| Females: | 1,232 |
Males:
| This neighborhood: | 37.0 years |
| Whole city: | 37.6 years |
| This neighborhood: | 38.3 years |
| Whole city: | 39.1 years |
Average household size:
| Lone Bluff: | 4.2 people |
| San Jose: | 2.9 people |
Percentage of family households:
| Lone Bluff: | 35.7% |
| San Jose: | 49.9% |
| Here: | 59.1% |
| San Jose: | 53.0% |
Percentage of married-couple families with children (among all households):
| Lone Bluff: | 20.1% |
| San Jose: | 25.8% |
Percentage of single-mother households (among all households):
| Lone Bluff: | 3.6% |
| San Jose: | 5.2% |
Percentage of never married males 15 years old and over:
Percentage of never married females 15 years old and over:
| Lone Bluff: | 18.1% |
| San Jose: | 20.9% |
Percentage of never married females 15 years old and over:
| Lone Bluff: | 16.6% |
| city: | 16.7% |
Percentage of people that speak English not well or not at all:
| Lone Bluff: | 30.7% |
| San Jose: | 11.4% |
Percentage of people born in this state:
Percentage of people born in another U.S. state:
Percentage of native residents but born outside the U.S.:
Percentage of foreign born residents:
| Here: | 46.7% |
| San Jose: | 46.1% |
Percentage of people born in another U.S. state:
| Lone Bluff: | 3.5% |
| San Jose: | 10.4% |
Percentage of native residents but born outside the U.S.:
| Here: | 1.2% |
| city: | 1.7% |
Percentage of foreign born residents:
| Here: | 48.5% |
| San Jose: | 41.8% |
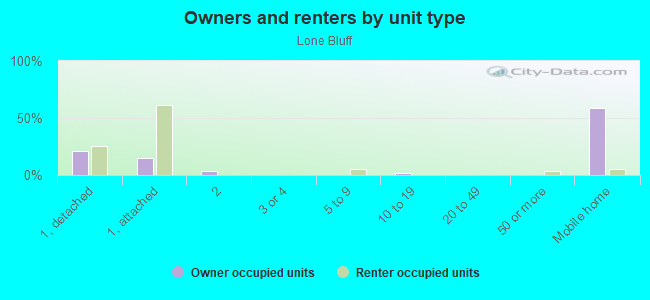
Owner-occupied
Renter-occupied

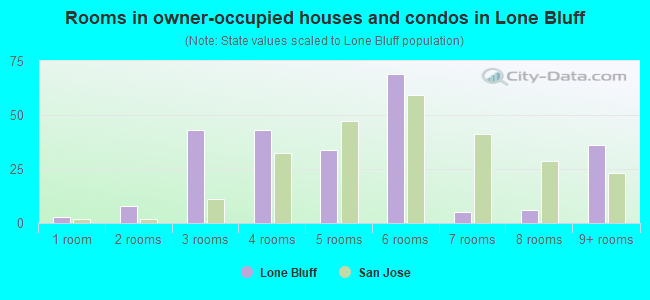
- Rooms in owner-occupied houses and condos in Lone Bluff
- 31 room
- 82 rooms
- 433 rooms
- 434 rooms
- 345 rooms
- 696 rooms
- 57 rooms
- 68 rooms
- 369+ rooms
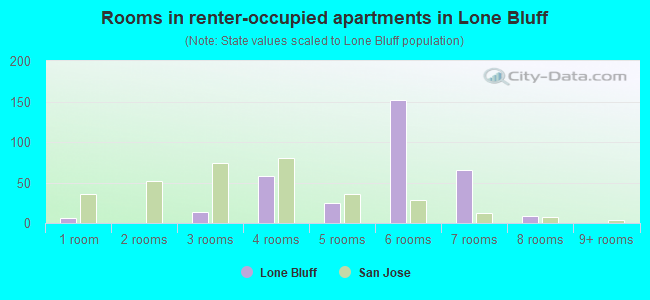
- Rooms in renter-occupied apartments in Lone Bluff
- 61 room
- 02 rooms
- 143 rooms
- 584 rooms
- 255 rooms
- 1526 rooms
- 667 rooms
- 98 rooms
- 09+ rooms
Owner-occupied
Renter-occupied
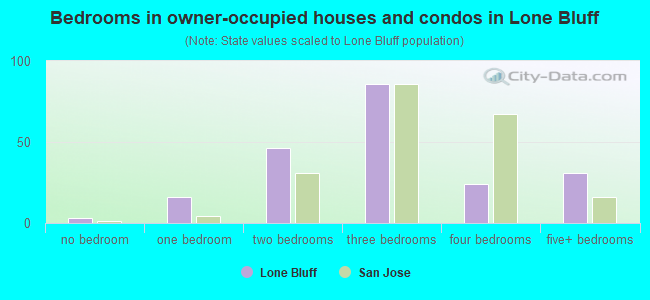
- Bedrooms in owner-occupied houses and condos in Lone Bluff
- 3no bedroom
- 161 bedroom
- 462 bedrooms
- 863 bedrooms
- 244 bedrooms
- 315+ bedrooms
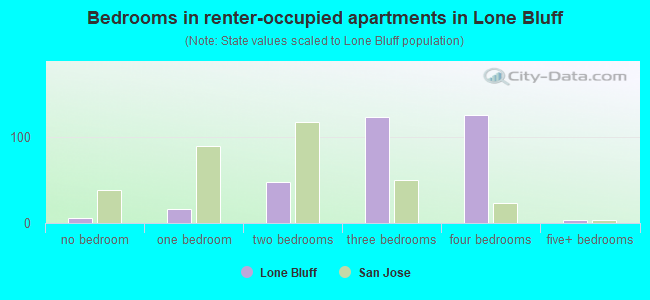
- Bedrooms in renter-occupied apartments in Lone Bluff
- 6no bedroom
- 161 bedroom
- 482 bedrooms
- 1243 bedrooms
- 1264 bedrooms
- 35+ bedrooms
Average number of cars or other vehicles available in houses/condos:
Average number of cars or other vehicles available in apartments:
| This neighborhood: | 2.9 |
| San Jose: | 2.3 |
Average number of cars or other vehicles available in apartments:
| Here: | 2.3 |
| city: | 1.6 |
Percentage of units with a mortgage:
| Lone Bluff: | 54.0% |
| San Jose: | 66.9% |
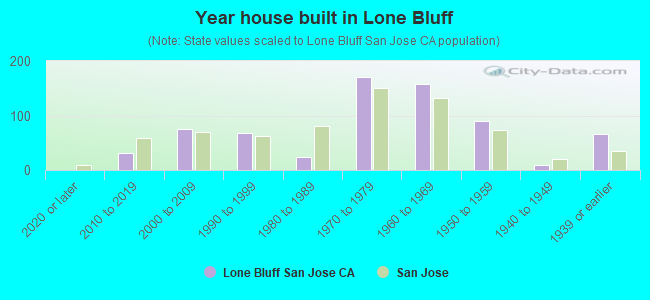
- Year house built in Lone Bluff
- 02020 or later
- 312010 to 2019
- 752000 to 2009
- 681990 to 1999
- 241980 to 1989
- 1701970 to 1979
- 1581960 to 1969
- 901950 to 1959
- 91940 to 1949
- 661939 or earlier
City-data.com crime index for city in 2020 (higher means more crime):
| City: | 268.4 |
| U.S. average: | 219.5 |
Travel time to work (commute)
![Travel time to work (commute)]()
- 4Less than 5 minutes
- 45 to 9 minutes
- 6310 to 14 minutes
- 6615 to 19 minutes
- 21820 to 24 minutes
- 15925 to 29 minutes
- 22830 to 34 minutes
- 3735 to 39 minutes
- 5840 to 44 minutes
- 1745 to 59 minutes
- 4060 to 89 minutes
- 1090 or more minutes

Means of transportation to work
![Means of transportation to work]()
- 75.4%741Drove a car alone
- 11.3%111Carpooled
- 0.5%5Bus
- 0.3%3Subway or elevated rail
- 0.3%3Bicycle
- 0.2%2Walked
- 0.8%8Other means
- 12.4%122Worked at home

Time leaving home to go to work
![Time leaving home to go to work]()
- 2012:00 a.m. to 4:59 a.m.
- 305:00 a.m. to 5:29 a.m.
- 675:30 a.m. to 5:59 a.m.
- 716:00 a.m. to 6:29 a.m.
- 376:30 a.m. to 6:59 a.m.
- 1727:00 a.m. to 7:29 a.m.
- 1037:30 a.m. to 7:59 a.m.
- 1628:00 a.m. to 8:29 a.m.
- 108:30 a.m. to 8:59 a.m.
- 929:00 a.m. to 9:59 a.m.
- 1810:00 a.m. to 10:59 a.m.
- 611:00 a.m. to 11:59 a.m.
- 3212:00 p.m. to 3:59 p.m.
- 1024:00 p.m. to 11:59 p.m.

Occupations of males:
- Percentage of males in business and financial operations occupations:
Here: 1.6% city: 4.6%
- Percentage of males in computer and mathematical occupations:
Here: 9.0% city: 13.6%
- Percentage of males in architecture and engineering occupations:
Here: 9.1% city: 10.2%
- Percentage of males in education, training, and library occupations:
Here: 1.0% city: 2.8%
- Percentage of males in healthcare practitioners and technical occupations:
Here: 2.1% city: 2.0%
- Percentage of males in service occupations:
Here: 36.6% city: 12.7%
- Percentage of males in sales and office occupations:
Here: 6.5% city: 12.8%
- Percentage of males in construction, extraction, and maintenance occupations:
Here: 7.3% city: 7.8%
- Percentage of males in production occupations:
Here: 10.7% city: 5.5%
- Percentage of males in transportation occupations:
Here: 7.8% city: 3.6%
Occupations of females:
- Percentage of females in management occupations (except farmers):
Here: 5.5% city: 11.0%
- Percentage of females in community and social services occupations:
Here: 3.1% city: 1.8%
- Percentage of females in education, training, and library occupations:
Here: 8.7% city: 8.1%
- Percentage of females in healthcare practitioners and technical occupations:
Here: 4.2% city: 6.8%
- Percentage of females in service occupations:
Here: 64.6% city: 21.7%
- Percentage of females in sales and office occupations:
Here: 10.8% city: 22.0%
- Percentage of females in production occupations:
Here: 1.5% city: 4.0%
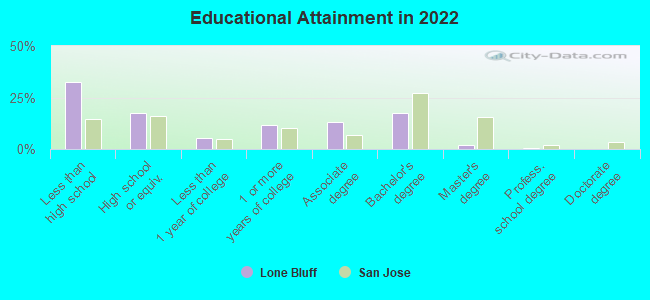
Education in this neighborhood (subdivision or community):
- Percentage of people 3 years and older in K-12 schools:
Lone Bluff: 21.8% San Jose: 16.1%
- Percentage of people 3 years and older in undergraduate colleges:
Lone Bluff: 11.1% San Jose: 6.5%
- Percentage of people 3 years and older in grad. or professional schools:
Lone Bluff: 0.3% San Jose: 2.0%
- Percentage of students K-12 enrolled in private schools:
Lone Bluff: 14.8% San Jose: 14.9%
Percentage of population below poverty level:
| Lone Bluff: | 10.6% |
| San Jose: | 9.0% |
Median year owner moved in (as recorded in 2022):
Median year renter moved in (as recorded in 2022):
| Lone Bluff: | 2005 |
| San Jose: | 2008 |
Median year renter moved in (as recorded in 2022):
| Lone Bluff: | 2013 |
| San Jose: | 2020 |
Percentage of married-couple families with both working:
| Lone Bluff: | 97.1% |
| San Jose: | 72.5% |
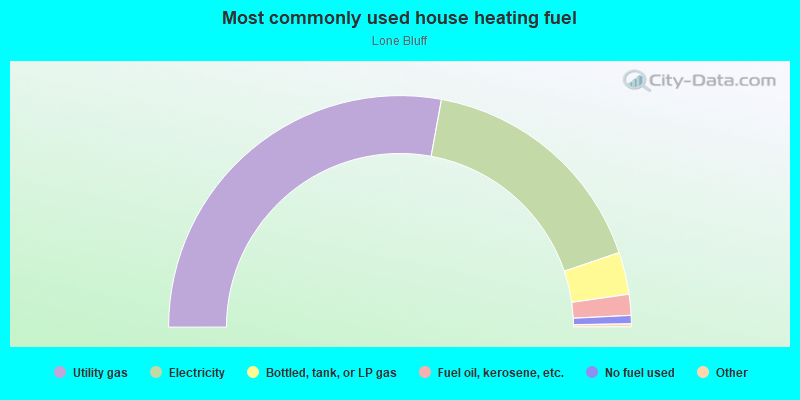
- 55.7%Utility gas
- 33.8%Electricity
- 5.9%Bottled, tank, or LP gas
- 2.9%Fuel oil, kerosene, etc.
- 1.2%No fuel used
Roads and streets:
Lone Bluff Way
Length: 0.82 miles
Directions: E-W, N-S, SE-NW
Address range: 2200 to 3174
Directions: E-W, N-S, SE-NW
Address range: 2200 to 3174
Overland Way
Length: 0.26 miles
Directions: E-W, SE-NW, SW-NE
Address range: 600 to 799
Directions: E-W, SE-NW, SW-NE
Address range: 600 to 799
Pinto Dr
Length: 0.24 miles
Direction: SW-NE
Address range: 600 to 799
Direction: SW-NE
Address range: 600 to 799
Dakota Dr
Length: 0.20 miles
Directions: E-W, SW-NE
Address range: 600 to 799
Directions: E-W, SW-NE
Address range: 600 to 799
Yuma Dr
Length: 0.16 miles
Directions: N-S, SE-NW
Address range: 3100 to 3116
Directions: N-S, SE-NW
Address range: 3100 to 3116
Lewis Rd
Length: 0.14 miles
Directions: N-S, SW-NE
Address range: 615 to 699
Directions: N-S, SW-NE
Address range: 615 to 699
Platte River Ct
Length: 0.12 miles
Direction: SW-NE
Address range: 600 to 799
Direction: SW-NE
Address range: 600 to 799
Dadis Way
Length: 0.10 miles
Direction: SW-NE
Address range: 601 to 683
Direction: SW-NE
Address range: 601 to 683
Santee River Ct
Length: 0.10 miles
Direction: SW-NE
Address range: 600 to 799
Direction: SW-NE
Address range: 600 to 799
Springfield Way
Length: 0.08 miles
Directions: E-W, SE-NW
Address range: 3100 to 3199
Directions: E-W, SE-NW
Address range: 3100 to 3199
Trinity River Ct
Length: 0.08 miles
Direction: SE-NW
Address range: 2900 to 2999
Direction: SE-NW
Address range: 2900 to 2999
Rock River Ct
Length: 0.07 miles
Direction: SE-NW
Address range: 2900 to 2999
Direction: SE-NW
Address range: 2900 to 2999
Senter Rd
Length: 0.07 miles
Direction: SE-NW
Address range: 2706 to 2743
Direction: SE-NW
Address range: 2706 to 2743
Gigi Ct
Length: 0.06 miles
Direction: SE-NW
Address range: 2800 to 2899
Direction: SE-NW
Address range: 2800 to 2899
Hani Ct
Length: 0.06 miles
Direction: SE-NW
Address range: 2800 to 2899
Direction: SE-NW
Address range: 2800 to 2899
Overland Ct
Length: 0.02 miles
Direction: SE-NW
Address range: 600 to 699
Direction: SE-NW
Address range: 600 to 699
Pecos River Ct
Length: 0.02 miles
Direction: SW-NE
Address range: 600 to 699
Direction: SW-NE
Address range: 600 to 699