Lower Broadway neighborhood in Newark, New Jersey (NJ), 07104 detailed profile
Settings
X


Business Search - 14 Million verified businesses
Area: 0.499 square miles
Population: 8,313
Population density:
| Lower Broadway: | 16,674 people per square mile |
| Newark: | 12,831 people per square mile |

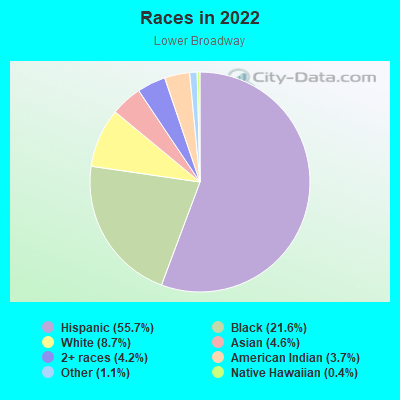
- 5,16455.7%Hispanic or Latino
- 2,00221.6%Black
- 8078.7%White
- 4284.6%Asian
- 3924.2%Two or more races
- 3473.7%American Indian
- 991.1%Some other race
- 370.4%Native Hawaiian and Other
Pacific Islander
Distribution of median household income
![Distribution of median household income]()
- 466Less than $10,000
- 651$10,000 to $19,999
- 784$20,000 to $29,999
- 304$30,000 to $39,999
- 1,150$40,000 to $49,999
- 304$50,000 to $59,999
- 420$60,000 to $74,999
- 229$75,000 to $99,999
- 182$100,000 to $124,999
- 442$125,000 to $149,999
- 383$150,000 to $199,999
- 327$200,000 or more

Distribution of owner-occupied house/condo value
![Distribution of owner-occupied house/condo value]()
- 82Less than $50,000
- 384$50,000 to $99,999
- 337$100,000 to $149,999
- 203$150,000 to $199,999
- 508$200,000 to $249,999
- 276$250,000 to $299,999
- 301$300,000 to $399,999
- 253$400,000 to $499,999
- 251$500,000 to $749,999
- 283$750,000 to $999,999
- 244$1,000,000 or more

Distribution of rent paid by renters
![Distribution of rent paid by renters]()
- 34Less than $100
- 368$100 to $199
- 228$200 to $299
- 113$300 to $399
- 391$400 to $499
- 772$500 to $599
- 252$600 to $699
- 861$700 to $799
- 274$800 to $899
- 439$900 to $999
- 540$1,000 to $1,249
- 174$1,250 to $1,499
- 458$1,500 to $1,999
- 380$2,000 or more

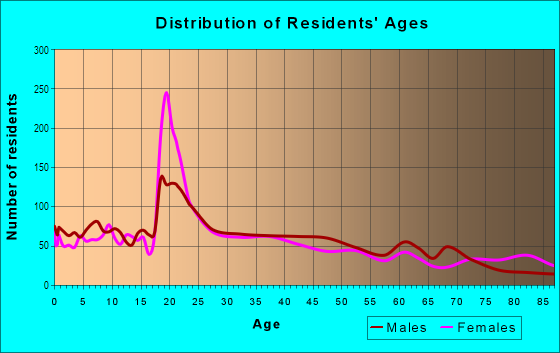
| Males: | 4,260 |
| Females: | 4,053 |
Males:
| This neighborhood: | 36.7 years |
| Whole city: | 33.9 years |
| This neighborhood: | 36.3 years |
| Whole city: | 36.0 years |
Average household size:
| Lower Broadway: | 5.2 people |
| Newark: | 2.6 people |
Percentage of family households:
| Lower Broadway: | 46.9% |
| Newark: | 47.4% |
| Here: | 33.8% |
| Newark: | 30.2% |
Percentage of married-couple families with children (among all households):
| Lower Broadway: | 18.9% |
| Newark: | 18.2% |
Percentage of single-mother households (among all households):
| Lower Broadway: | 17.4% |
| Newark: | 14.8% |
Percentage of never married males 15 years old and over:
Percentage of never married females 15 years old and over:
| Lower Broadway: | 25.7% |
| Newark: | 24.8% |
Percentage of never married females 15 years old and over:
| Lower Broadway: | 24.6% |
| city: | 25.2% |
Percentage of people that speak English not well or not at all:
| Lower Broadway: | 18.7% |
| Newark: | 15.2% |
Percentage of people born in this state:
Percentage of people born in another U.S. state:
Percentage of native residents but born outside the U.S.:
Percentage of foreign born residents:
| Here: | 41.1% |
| Newark: | 47.9% |
Percentage of people born in another U.S. state:
| Lower Broadway: | 17.2% |
| Newark: | 11.7% |
Percentage of native residents but born outside the U.S.:
| Here: | 9.6% |
| city: | 5.5% |
Percentage of foreign born residents:
| Here: | 32.2% |
| Newark: | 34.9% |
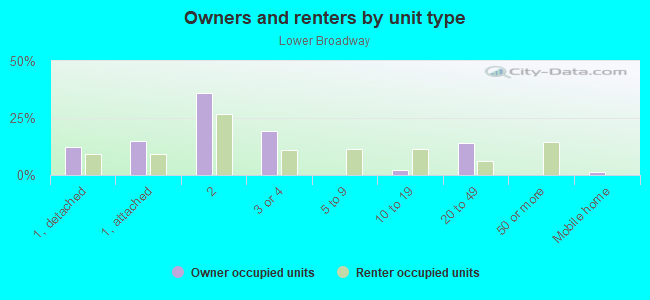
Owner-occupied
Renter-occupied

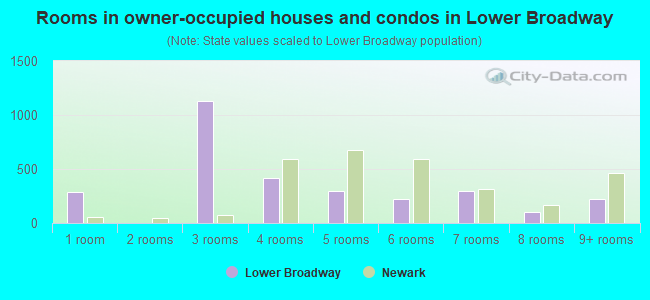
- Rooms in owner-occupied houses and condos in Lower Broadway
- 2851 room
- 02 rooms
- 1,1283 rooms
- 4194 rooms
- 2965 rooms
- 2226 rooms
- 2967 rooms
- 1068 rooms
- 2249+ rooms
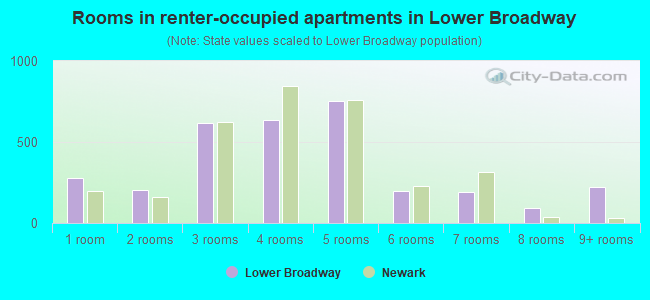
- Rooms in renter-occupied apartments in Lower Broadway
- 2761 room
- 2042 rooms
- 6193 rooms
- 6364 rooms
- 7535 rooms
- 1976 rooms
- 1947 rooms
- 948 rooms
- 2219+ rooms
Owner-occupied
Renter-occupied
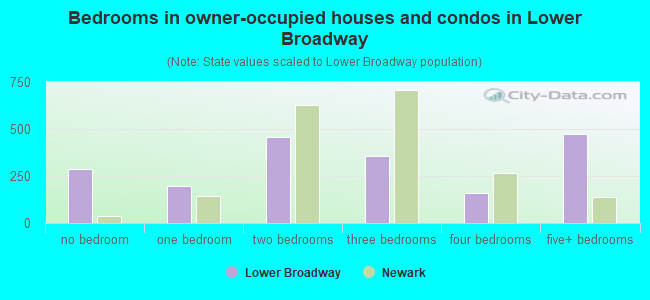
- Bedrooms in owner-occupied houses and condos in Lower Broadway
- 285no bedroom
- 1971 bedroom
- 4562 bedrooms
- 3553 bedrooms
- 1574 bedrooms
- 4725+ bedrooms
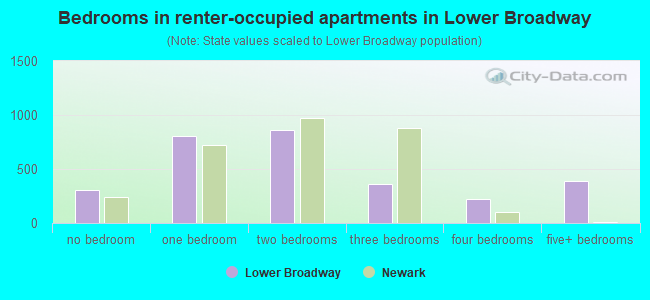
- Bedrooms in renter-occupied apartments in Lower Broadway
- 304no bedroom
- 8021 bedroom
- 8582 bedrooms
- 3583 bedrooms
- 2184 bedrooms
- 3895+ bedrooms
Average number of cars or other vehicles available in houses/condos:
Average number of cars or other vehicles available in apartments:
| This neighborhood: | 1.7 |
| Newark: | 1.4 |
Average number of cars or other vehicles available in apartments:
| Here: | 0.9 |
| city: | 0.8 |
Percentage of units with a mortgage:
| Lower Broadway: | 71.4% |
| Newark: | 65.4% |
Housing prices:
- Average estimated value of detached houses in 2022 (9.2% of all units):
Lower Broadway: $1,813,049 Newark: $412,982
- Average estimated value of housing units in 2-unit structures in 2022 (36.2% of all units):
This neighborhood: $228,705 Newark: $320,136
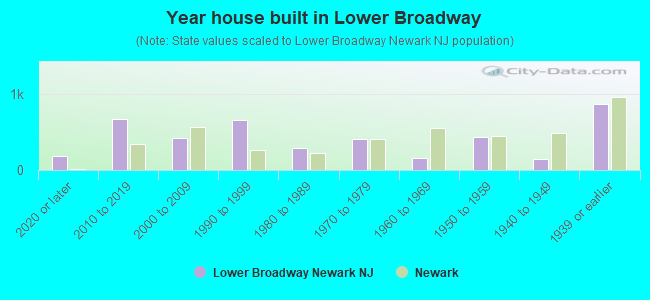
- Year house built in Lower Broadway
- 1822020 or later
- 6702010 to 2019
- 4242000 to 2009
- 6591990 to 1999
- 2911980 to 1989
- 4121970 to 1979
- 1601960 to 1969
- 4331950 to 1959
- 1441940 to 1949
- 8631939 or earlier
City-data.com crime index for city in 2020 (higher means more crime):
| City: | 273.7 |
| U.S. average: | 219.5 |
Travel time to work (commute)
![Travel time to work (commute)]()
- 72Less than 5 minutes
- 1155 to 9 minutes
- 17610 to 14 minutes
- 54115 to 19 minutes
- 53320 to 24 minutes
- 16525 to 29 minutes
- 58330 to 34 minutes
- 3935 to 39 minutes
- 19140 to 44 minutes
- 55745 to 59 minutes
- 30560 to 89 minutes
- 19090 or more minutes

Means of transportation to work
![Means of transportation to work]()
- 60.4%1,910Drove a car alone
- 13.4%425Carpooled
- 6.9%218Bus
- 5.5%174Subway or elevated rail
- 11.6%368Long-distance train or commuter rail
- 23.8%754Taxi
- 2.2%68Bicycle
- 10.5%332Walked
- 6.4%201Other means
- 8.6%273Worked at home

Time leaving home to go to work
![Time leaving home to go to work]()
- 14012:00 a.m. to 4:59 a.m.
- 3305:00 a.m. to 5:29 a.m.
- 805:30 a.m. to 5:59 a.m.
- 3956:00 a.m. to 6:29 a.m.
- 3126:30 a.m. to 6:59 a.m.
- 4137:00 a.m. to 7:29 a.m.
- 2727:30 a.m. to 7:59 a.m.
- 5148:00 a.m. to 8:29 a.m.
- 1108:30 a.m. to 8:59 a.m.
- 3039:00 a.m. to 9:59 a.m.
- 9110:00 a.m. to 10:59 a.m.
- 19111:00 a.m. to 11:59 a.m.
- 17012:00 p.m. to 3:59 p.m.
- 1624:00 p.m. to 11:59 p.m.

Occupations of males:
- Percentage of males in management occupations (except farmers):
Here: 5.2% city: 4.7%
- Percentage of males in business and financial operations occupations:
Here: 1.9% city: 3.2%
- Percentage of males in computer and mathematical occupations:
Here: 3.4% city: 3.1%
- Percentage of males in architecture and engineering occupations:
Here: 4.8% city: 1.0%
- Percentage of males in education, training, and library occupations:
Here: 6.0% city: 2.0%
- Percentage of males in arts, design, entertainment, sports, and media occupations:
Here: 2.0% city: 1.5%
- Percentage of males in service occupations:
Here: 14.5% city: 18.4%
- Percentage of males in sales and office occupations:
Here: 15.9% city: 13.2%
- Percentage of males in construction, extraction, and maintenance occupations:
Here: 5.8% city: 18.9%
- Percentage of males in production occupations:
Here: 10.1% city: 6.5%
- Percentage of males in transportation occupations:
Here: 18.7% city: 12.5%
- Percentage of males in material moving occupations:
Here: 6.4% city: 7.0%
Occupations of females:
- Percentage of females in management occupations (except farmers):
Here: 7.8% city: 7.3%
- Percentage of females in community and social services occupations:
Here: 4.4% city: 2.5%
- Percentage of females in legal occupations:
Here: 3.0% city: 0.9%
- Percentage of females in education, training, and library occupations:
Here: 7.1% city: 7.1%
- Percentage of females in arts, design, entertainment, sports, and media occupations:
Here: 2.3% city: 1.0%
- Percentage of females in healthcare practitioners and technical occupations:
Here: 1.8% city: 4.8%
- Percentage of females in service occupations:
Here: 17.7% city: 30.4%
- Percentage of females in sales and office occupations:
Here: 40.7% city: 27.3%
- Percentage of females in production occupations:
Here: 11.4% city: 5.2%
- Percentage of females in material moving occupations:
Here: 3.1% city: 5.4%
Education in this neighborhood (subdivision or community):
- Percentage of people 3 years and older in K-12 schools:
Lower Broadway: 24.0% Newark: 17.5%
- Percentage of people 3 years and older in undergraduate colleges:
Lower Broadway: 10.0% Newark: 6.3%
- Percentage of people 3 years and older in grad. or professional schools:
Lower Broadway: 2.4% Newark: 1.5%
- Percentage of students K-12 enrolled in private schools:
Lower Broadway: 47.9% Newark: 6.6%
Percentage of population below poverty level:
| Lower Broadway: | 26.4% |
| Newark: | 24.0% |
Median year renter moved in (as recorded in 2022):
| Lower Broadway: | 2011 |
| Newark: | 2017 |
Percentage of married-couple families with both working:
| Lower Broadway: | 103.3% |
| Newark: | 57.9% |
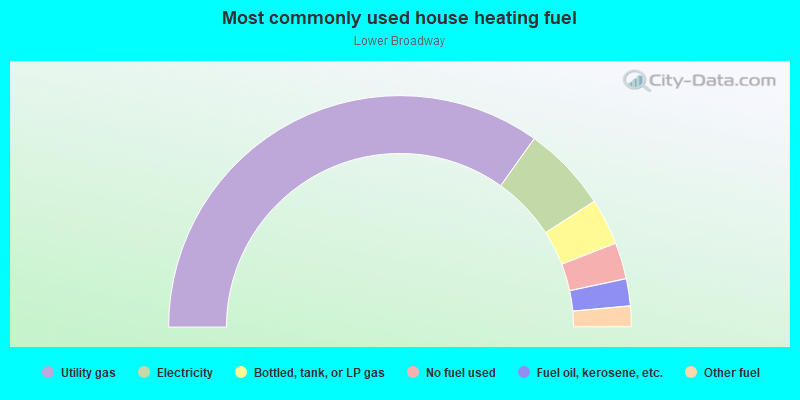
- 69.8%Utility gas
- 12.0%Electricity
- 6.5%Bottled, tank, or LP gas
- 5.1%No fuel used
- 3.8%Fuel oil, kerosene, etc.
- 2.9%Other fuel
Limited-access highways (interstate or state) in this neighborhood:
I- 280
Length: 0.19 miles
Direction: E-W
Direction: E-W
Highways in this neighborhood:
State Rte 21 (McCarter Hwy)
Length: 1.38 miles
Directions: N-S, SW-NE
Address range: 1169 to 1697
Directions: N-S, SW-NE
Address range: 1169 to 1697
Roads and streets:
Broad St
Length: 1.07 miles
Directions: N-S, SW-NE
Address range: 1 to 404
Directions: N-S, SW-NE
Address range: 1 to 404
Broadway
Length: 1.01 miles
Directions: N-S, SE-NW, SW-NE
Address range: 3 to 374
Directions: N-S, SE-NW, SW-NE
Address range: 3 to 374
Mount Pleasant Ave
Length: 0.87 miles
Directions: N-S, SW-NE
Address range: 1 to 341
Directions: N-S, SW-NE
Address range: 1 to 341
Passaic St
Length: 0.78 miles
Directions: N-S, SW-NE
Address range: 20 to 315
Directions: N-S, SW-NE
Address range: 20 to 315
4th Ave
Length: 0.69 miles
Direction: E-W
Address range: 1 to 168
Direction: E-W
Address range: 1 to 168
3rd Ave
Length: 0.51 miles
Directions: E-W, SW-NE
Address range: 1 to 143
Directions: E-W, SW-NE
Address range: 1 to 143
Garside St
Length: 0.38 miles
Direction: SW-NE
Address range: 189 to 323
Direction: SW-NE
Address range: 189 to 323
Summer Ave
Length: 0.36 miles
Direction: SW-NE
Address range: 175 to 296
Direction: SW-NE
Address range: 175 to 296
Clay St
Length: 0.33 miles
Directions: E-W, SW-NE
Address range: 2 to 144
Directions: E-W, SW-NE
Address range: 2 to 144
Kearney St
Length: 0.29 miles
Direction: E-W
Address range: 1 to 99
Direction: E-W
Address range: 1 to 99
Oriental St
Length: 0.27 miles
Direction: E-W
Address range: 1 to 82
Direction: E-W
Address range: 1 to 82
Clark St
Length: 0.27 miles
Direction: E-W
Address range: 1 to 78
Direction: E-W
Address range: 1 to 78
Gouverneur St
Length: 0.27 miles
Direction: E-W
Address range: 3 to 78
Direction: E-W
Address range: 3 to 78
Taylor St
Length: 0.27 miles
Direction: E-W
Address range: 1 to 86
Direction: E-W
Address range: 1 to 86
2nd Ave
Length: 0.20 miles
Direction: E-W
Address range: 1 to 60
Direction: E-W
Address range: 1 to 60
Harvey St
Length: 0.19 miles
Direction: E-W
Address range: 24 to 96
Direction: E-W
Address range: 24 to 96
Ogden St
Length: 0.15 miles
Direction: SW-NE
Address range: 1 to 68
Direction: SW-NE
Address range: 1 to 68
Van Wagenen St
Length: 0.14 miles
Direction: E-W
Address range: 1 to 52
Direction: E-W
Address range: 1 to 52
Spring St
Length: 0.14 miles
Direction: N-S
Address range: 1 to 56
Direction: N-S
Address range: 1 to 56
Grant St
Length: 0.13 miles
Direction: E-W
Address range: 1 to 98
Direction: E-W
Address range: 1 to 98
Rte 506 Spr
Length: 0.11 miles
Directions: E-W, SE-NW
Directions: E-W, SE-NW
8th Ave
Length: 0.10 miles
Direction: E-W
Address range: 1 to 40
Direction: E-W
Address range: 1 to 40
Bloomfield Pl
Length: 0.09 miles
Direction: E-W
Address range: 1 to 20
Direction: E-W
Address range: 1 to 20
Crittenden St
Length: 0.06 miles
Direction: E-W
Address range: 2 to 18
Direction: E-W
Address range: 2 to 18
E Mill St
Length: 0.06 miles
Direction: E-W
Address range: 1 to 18
Direction: E-W
Address range: 1 to 18
Oriental Pl
Length: 0.06 miles
Direction: E-W
Address range: 1 to 52
Direction: E-W
Address range: 1 to 52
Mc Carter Hwy
Length: 0.06 miles
Direction: SW-NE
Address range: 1467 to 1489
Direction: SW-NE
Address range: 1467 to 1489
Railroad features:
Conrail RR
Length: 0.93 miles
Directions: N-S, SE-NW, SW-NE
Directions: N-S, SE-NW, SW-NE