Lynside Neighborhood neighborhood in Midland, Texas (TX), 79705, 79701 detailed profile
Settings
X


Business Search - 14 Million verified businesses
Area: 0.061 square miles
Population: 431
Population density:
| Lynside Neighborhood: | 7,105 people per square mile |
| Midland: | 2,018 people per square mile |

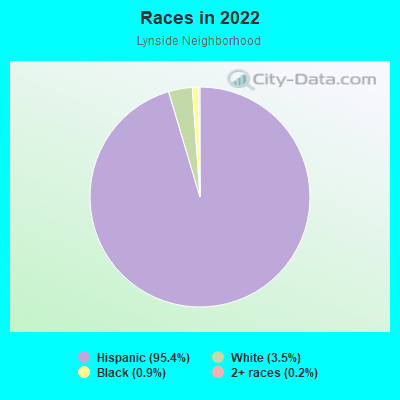
- 41195.4%Hispanic or Latino
- 153.5%White
- 40.9%Black
- 10.2%Two or more races
Distribution of median household income
![Distribution of median household income]()
- 18Less than $10,000
- 14$10,000 to $19,999
- 70$20,000 to $29,999
- 9$30,000 to $39,999
- 7$40,000 to $49,999
- 4$50,000 to $59,999
- 6$60,000 to $74,999
- 7$75,000 to $99,999
- 2$100,000 to $124,999
- 7$125,000 to $149,999
- 9$150,000 to $199,999
- 4$200,000 or more

Distribution of owner-occupied house/condo value
![Distribution of owner-occupied house/condo value]()
- 9Less than $50,000
- 28$50,000 to $99,999
- 8$100,000 to $149,999
- 6$150,000 to $199,999
- 62$200,000 to $249,999
- 7$250,000 to $299,999
- 4$300,000 to $399,999
- 10$750,000 to $999,999
- 1$1,000,000 or more

Distribution of rent paid by renters
![Distribution of rent paid by renters]()
- 12$100 to $199
- 2$300 to $399
- 8$400 to $499
- 2$600 to $699
- 3$700 to $799
- 3$800 to $899
- 2$900 to $999
- 8$1,000 to $1,249
- 1$1,250 to $1,499
- 6$1,500 to $1,999
- 3$2,000 or more

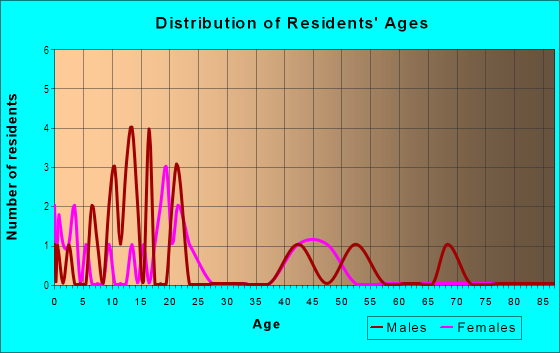
| Males: | 183 |
| Females: | 248 |
Males:
| This neighborhood: | 42.6 years |
| Whole city: | 32.3 years |
| This neighborhood: | 20.8 years |
| Whole city: | 33.3 years |
Average household size:
| Lynside Neighborhood: | 3.3 people |
| Midland: | 2.4 people |
Percentage of family households:
| Lynside Neighborhood: | 76.0% |
| Midland: | 52.0% |
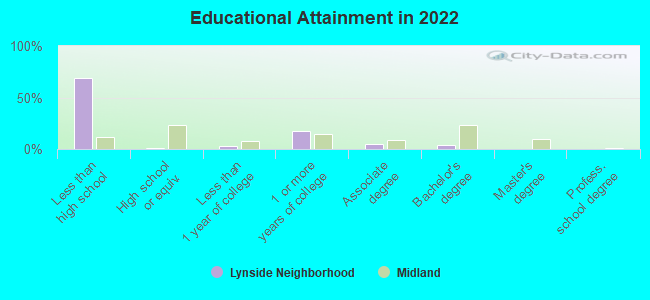
| Here: | 67.3% |
| Midland: | 46.4% |
Percentage of married-couple families with children (among all households):
| Lynside Neighborhood: | 24.3% |
| Midland: | 30.9% |
Percentage of single-mother households (among all households):
| Lynside Neighborhood: | 3.1% |
| Midland: | 8.1% |
Percentage of never married males 15 years old and over:
Percentage of never married females 15 years old and over:
| Lynside Neighborhood: | 18.8% |
| Midland: | 15.2% |
Percentage of never married females 15 years old and over:
| Lynside Neighborhood: | 15.1% |
| city: | 14.9% |
Percentage of people that speak English not well or not at all:
| Lynside Neighborhood: | 34.1% |
| Midland: | 5.7% |
Percentage of people born in this state:
Percentage of people born in another U.S. state:
Percentage of native residents but born outside the U.S.:
Percentage of foreign born residents:
| Here: | 68.4% |
| Midland: | 69.5% |
Percentage of people born in another U.S. state:
| Lynside Neighborhood: | 10.1% |
| Midland: | 18.2% |
Percentage of native residents but born outside the U.S.:
| Here: | 1.2% |
| city: | 1.2% |
Percentage of foreign born residents:
| Here: | 20.4% |
| Midland: | 11.2% |
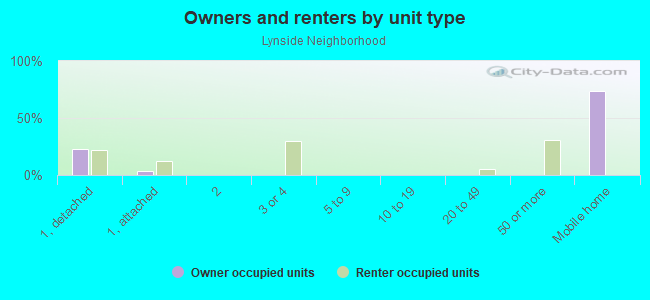
Owner-occupied
Renter-occupied

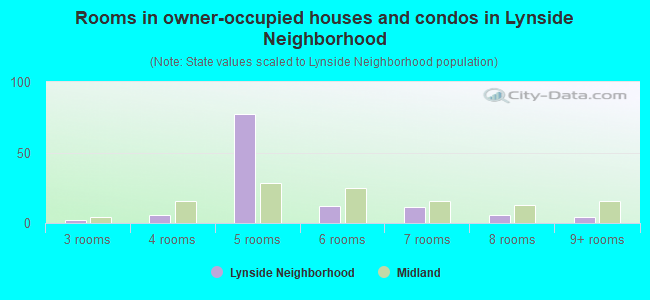
- Rooms in owner-occupied houses and condos in Lynside Neighborhood
- 01 room
- 02 rooms
- 23 rooms
- 64 rooms
- 775 rooms
- 126 rooms
- 117 rooms
- 68 rooms
- 49+ rooms
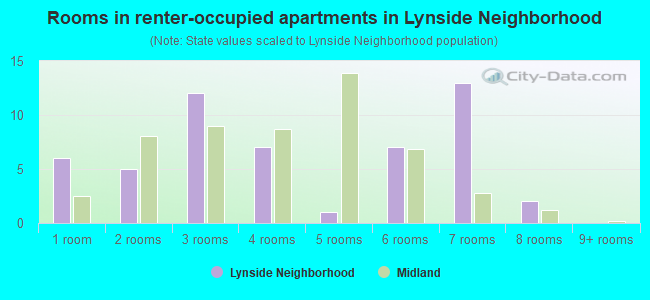
- Rooms in renter-occupied apartments in Lynside Neighborhood
- 61 room
- 52 rooms
- 123 rooms
- 74 rooms
- 15 rooms
- 76 rooms
- 137 rooms
- 28 rooms
- 09+ rooms
Owner-occupied
Renter-occupied
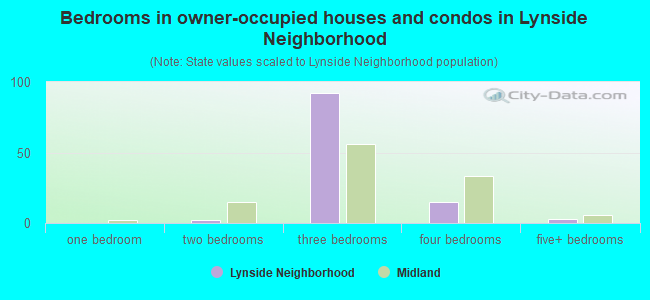
- Bedrooms in owner-occupied houses and condos in Lynside Neighborhood
- 0no bedroom
- 01 bedroom
- 22 bedrooms
- 923 bedrooms
- 154 bedrooms
- 35+ bedrooms
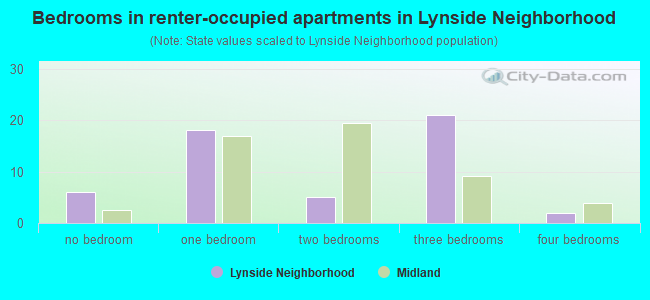
- Bedrooms in renter-occupied apartments in Lynside Neighborhood
- 6no bedroom
- 181 bedroom
- 52 bedrooms
- 213 bedrooms
- 24 bedrooms
- 05+ bedrooms
Average number of cars or other vehicles available in houses/condos:
Average number of cars or other vehicles available in apartments:
| This neighborhood: | 2.1 |
| Midland: | 2.1 |
Average number of cars or other vehicles available in apartments:
| Here: | 9.7 |
| city: | 1.4 |
Percentage of units with a mortgage:
| Lynside Neighborhood: | 14.3% |
| Midland: | 58.2% |
Housing prices:
- Average estimated value of detached houses in 2022 (35.4% of all units):
Lynside Neighborhood: $163,480 Texas: $369,058
- Average estimated value of mobile home in 2022 (64.6% of all units):
Lynside Neighborhood: $284,863 Texas: $124,413
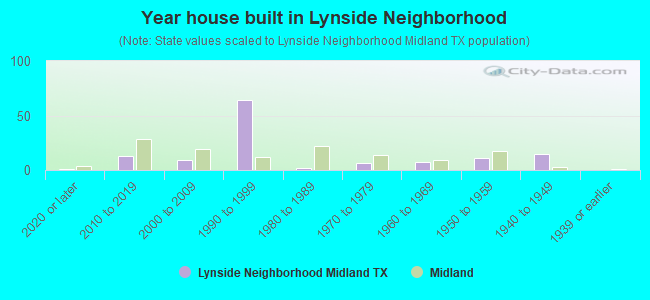
- Year house built in Lynside Neighborhood
- 12020 or later
- 132010 to 2019
- 92000 to 2009
- 641990 to 1999
- 21980 to 1989
- 61970 to 1979
- 71960 to 1969
- 111950 to 1959
- 151940 to 1949
- 01939 or earlier
City-data.com crime index for city in 2020 (higher means more crime):
| City: | 223.8 |
| U.S. average: | 219.5 |
Travel time to work (commute)
![Travel time to work (commute)]()
- 6Less than 5 minutes
- 445 to 9 minutes
- 3310 to 14 minutes
- 1915 to 19 minutes
- 1820 to 24 minutes
- 225 to 29 minutes
- 1030 to 34 minutes
- 235 to 39 minutes
- 140 to 44 minutes
- 1345 to 59 minutes
- 260 to 89 minutes
- 1190 or more minutes

Means of transportation to work
![Means of transportation to work]()
- 81.4%124Drove a car alone
- 7.2%11Carpooled
- 0.7%1Bus
- 3.3%5Walked
- 7.2%11Other means

Time leaving home to go to work
![Time leaving home to go to work]()
- 1012:00 a.m. to 4:59 a.m.
- 125:00 a.m. to 5:29 a.m.
- 326:00 a.m. to 6:29 a.m.
- 46:30 a.m. to 6:59 a.m.
- 257:00 a.m. to 7:29 a.m.
- 217:30 a.m. to 7:59 a.m.
- 178:00 a.m. to 8:29 a.m.
- 88:30 a.m. to 8:59 a.m.
- 99:00 a.m. to 9:59 a.m.
- 210:00 a.m. to 10:59 a.m.
- 811:00 a.m. to 11:59 a.m.
- 712:00 p.m. to 3:59 p.m.
- 64:00 p.m. to 11:59 p.m.

Occupations of males:
- Percentage of males in management occupations (except farmers):
Here: 13.6% city: 14.6%
- Percentage of males in service occupations:
Here: 9.7% city: 9.5%
- Percentage of males in production occupations:
Here: 11.1% city: 7.5%
- Percentage of males in transportation occupations:
Here: 62.3% city: 5.1%
- Percentage of males in material moving occupations:
Here: 3.2% city: 4.8%
Occupations of females:
- Percentage of females in education, training, and library occupations:
Here: 7.9% city: 11.2%
- Percentage of females in service occupations:
Here: 57.8% city: 16.8%
- Percentage of females in sales and office occupations:
Here: 34.2% city: 33.2%
- Percentage of females in production occupations:
Here: 2.2% city: 2.0%
Education in this neighborhood (subdivision or community):
- Percentage of people 3 years and older in K-12 schools:
Lynside Neighborhood: 37.6% Midland: 22.4%
- Percentage of people 3 years and older in undergraduate colleges:
Lynside Neighborhood: 0.5% Midland: 3.0%
- Percentage of people 3 years and older in grad. or professional schools:
Lynside Neighborhood: 0.0% Midland: 1.8%
- Percentage of students K-12 enrolled in private schools:
Lynside Neighborhood: 13.7% Midland: 16.2%
Percentage of population below poverty level:
| Lynside Neighborhood: | 37.8% |
| Midland: | 11.7% |
Median year owner moved in (as recorded in 2022):
| Lynside Neighborhood: | 2006 |
| Midland: | 2015 |
Percentage of married-couple families with both working:
| Lynside Neighborhood: | 30.9% |
| Midland: | 63.2% |
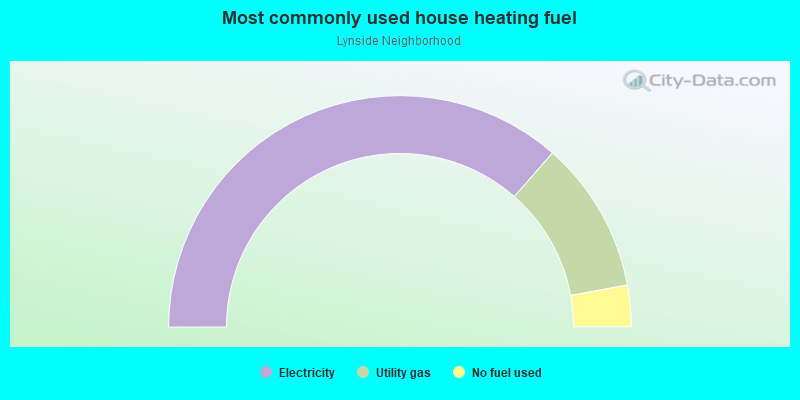
- 72.9%Electricity
- 21.3%Utility gas
- 5.8%No fuel used
Roads and streets:
Cottonwood Ave
Length: 0.27 miles
Directions: E-W, N-S, SE-NW, SW-NE
Address range: 1201 to 1299
Directions: E-W, N-S, SE-NW, SW-NE
Address range: 1201 to 1299
E Golf Course Rd
Length: 0.21 miles
Direction: E-W
Address range: 1109 to 1299
Direction: E-W
Address range: 1109 to 1299
Elm Ave
Length: 0.21 miles
Directions: E-W, SE-NW, SW-NE
Directions: E-W, SE-NW, SW-NE
N Tyler St
Length: 0.20 miles
Directions: N-S, SE-NW
Address range: 1800 to 2099
Directions: N-S, SE-NW
Address range: 1800 to 2099
Lynn Ave
Length: 0.15 miles
Direction: E-W
Address range: 1200 to 1299
Direction: E-W
Address range: 1200 to 1299
N Carver St
Length: 0.14 miles
Directions: N-S, SE-NW
Address range: 1800 to 2013
Directions: N-S, SE-NW
Address range: 1800 to 2013
Cedar Ave
Length: 0.14 miles
Direction: E-W
Address range: 1200 to 1299
Direction: E-W
Address range: 1200 to 1299