MIT (Massachusetts Institute of Technology) neighborhood in Cambridge, Massachusetts (MA), 02139, 02142 detailed profile
Settings
X


Business Search - 14 Million verified businesses
Area: 0.378 square miles
Population: 2,277
Population density:
| MIT (Massachusetts Institute of Technology): | 6,019 people per square mile |
| Cambridge: | 18,431 people per square mile |

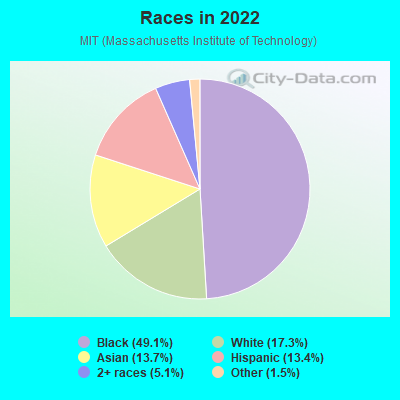
- 1,11749.1%Black
- 39317.3%White
- 31113.7%Asian
- 30513.4%Hispanic or Latino
- 1155.1%Two or more races
- 341.5%Some other race
Median household income in 2022:
| MIT (Massachusetts Institute of Technology): | $72,065 |
| Cambridge: | $109,358 |
Distribution of median household income
![Distribution of median household income]()
- 53Less than $10,000
- 71$10,000 to $19,999
- 81$20,000 to $29,999
- 51$30,000 to $39,999
- 91$40,000 to $49,999
- 38$50,000 to $59,999
- 37$60,000 to $74,999
- 185$75,000 to $99,999
- 44$100,000 to $124,999
- 65$125,000 to $149,999
- 50$150,000 to $199,999
- 67$200,000 or more

Distribution of owner-occupied house/condo value
![Distribution of owner-occupied house/condo value]()
- 9$50,000 to $99,999
- 25$150,000 to $199,999
- 11$300,000 to $399,999
- 16$500,000 to $749,999
- 19$750,000 to $999,999
- 13$1,000,000 or more

Distribution of rent paid by renters
![Distribution of rent paid by renters]()
- 9Less than $100
- 31$100 to $199
- 27$200 to $299
- 51$300 to $399
- 37$400 to $499
- 25$500 to $599
- 40$600 to $699
- 57$700 to $799
- 19$800 to $899
- 23$900 to $999
- 41$1,000 to $1,249
- 53$1,250 to $1,499
- 85$1,500 to $1,999
- 225$2,000 or more

Median rent in 2022:
| MIT (Massachusetts Institute of Technology): | $1,270 |
| Cambridge: | $2,001 |
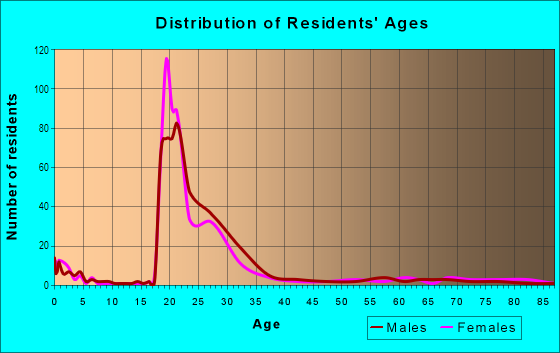
| Males: | 1,239 |
| Females: | 1,037 |
Males:
| This neighborhood: | 24.9 years |
| Whole city: | 29.0 years |
| This neighborhood: | 32.6 years |
| Whole city: | 30.2 years |
Average household size:
| MIT (Massachusetts Institute of Technology): | 2.8 people |
| Cambridge: | 2.0 people |
Percentage of family households:
| MIT (Massachusetts Institute of Technology): | 46.7% |
| Cambridge: | 27.0% |
| Here: | 34.3% |
| Cambridge: | 26.5% |
Percentage of married-couple families with children (among all households):
| MIT (Massachusetts Institute of Technology): | 27.7% |
| Cambridge: | 31.6% |
Percentage of single-mother households (among all households):
| MIT (Massachusetts Institute of Technology): | 8.6% |
| Cambridge: | 9.2% |
Percentage of never married males 15 years old and over:
Percentage of never married females 15 years old and over:
| MIT (Massachusetts Institute of Technology): | 31.1% |
| Cambridge: | 31.1% |
Percentage of never married females 15 years old and over:
| MIT (Massachusetts Institute of Technology): | 21.5% |
| city: | 31.0% |
Percentage of people that speak English not well or not at all:
| MIT (Massachusetts Institute of Technology): | 6.8% |
| Cambridge: | 2.0% |
Percentage of people born in this state:
Percentage of people born in another U.S. state:
Percentage of native residents but born outside the U.S.:
Percentage of foreign born residents:
| Here: | 40.5% |
| Cambridge: | 31.3% |
Percentage of people born in another U.S. state:
| MIT (Massachusetts Institute of Technology): | 19.0% |
| Cambridge: | 37.0% |
Percentage of native residents but born outside the U.S.:
| Here: | 4.4% |
| city: | 2.9% |
Percentage of foreign born residents:
| Here: | 36.1% |
| Cambridge: | 28.8% |
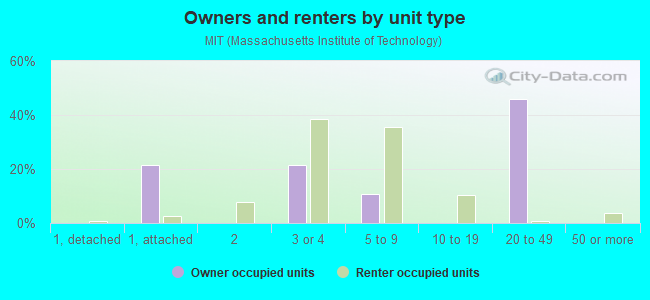
Owner-occupied
Renter-occupied

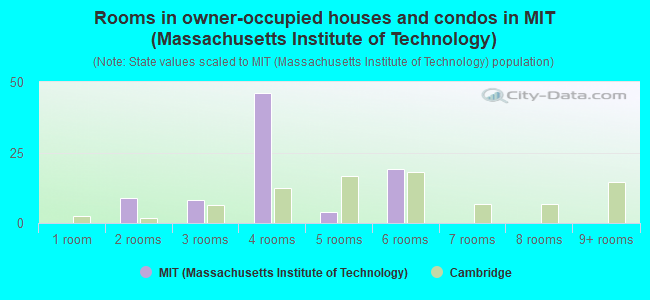
- Rooms in owner-occupied houses and condos in MIT <
> - 01 room
- 92 rooms
- 83 rooms
- 464 rooms
- 45 rooms
- 196 rooms
- 07 rooms
- 08 rooms
- 09+ rooms
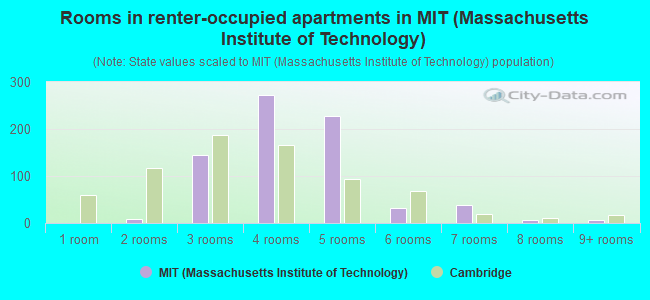
- Rooms in renter-occupied apartments in MIT <
> - 01 room
- 92 rooms
- 1443 rooms
- 2724 rooms
- 2275 rooms
- 326 rooms
- 387 rooms
- 68 rooms
- 79+ rooms
Owner-occupied
Renter-occupied
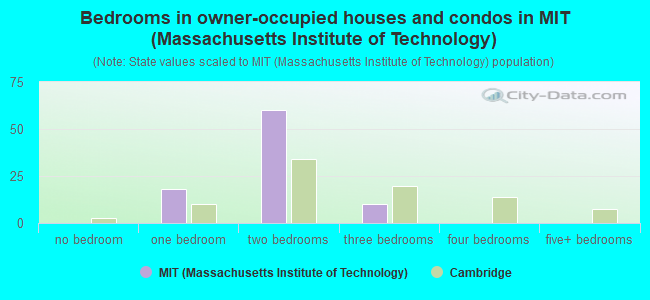
- Bedrooms in owner-occupied houses and condos in MIT <
> - 0no bedroom
- 181 bedroom
- 602 bedrooms
- 103 bedrooms
- 04 bedrooms
- 05+ bedrooms
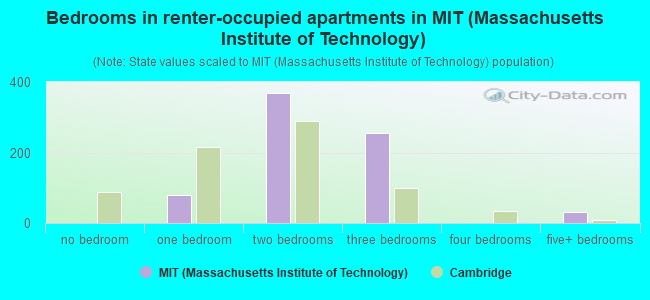
- Bedrooms in renter-occupied apartments in MIT <
> - 0no bedroom
- 791 bedroom
- 3692 bedrooms
- 2553 bedrooms
- 04 bedrooms
- 325+ bedrooms
Average number of cars or other vehicles available in houses/condos:
Average number of cars or other vehicles available in apartments:
| This neighborhood: | 0.9 |
| Cambridge: | 1.2 |
Average number of cars or other vehicles available in apartments:
| Here: | 0.7 |
| city: | 0.7 |
Percentage of units with a mortgage:
| MIT (Massachusetts Institute of Technology): | 91.9% |
| Cambridge: | 54.3% |
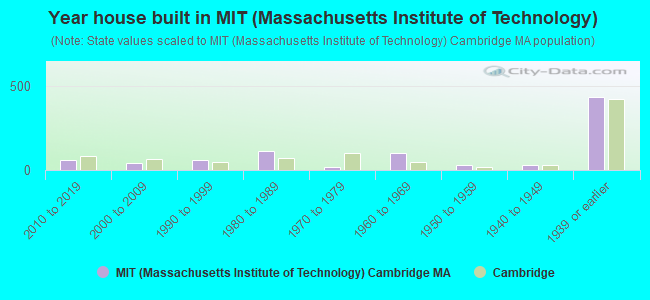
- Year house built in MIT <
> - 02020 or later
- 612010 to 2019
- 402000 to 2009
- 601990 to 1999
- 1101980 to 1989
- 161970 to 1979
- 1021960 to 1969
- 321950 to 1959
- 301940 to 1949
- 4301939 or earlier
City-data.com crime index for city in 2020 (higher means more crime):
| City: | 157.6 |
| U.S. average: | 219.5 |
Travel time to work (commute)
![Travel time to work (commute)]()
- 6Less than 5 minutes
- 505 to 9 minutes
- 18410 to 14 minutes
- 28315 to 19 minutes
- 5520 to 24 minutes
- 9725 to 29 minutes
- 13530 to 34 minutes
- 3135 to 39 minutes
- 4840 to 44 minutes
- 6145 to 59 minutes
- 3460 to 89 minutes
- 2690 or more minutes

Means of transportation to work
![Means of transportation to work]()
- 28.0%325Drove a car alone
- 4.3%50Carpooled
- 6.8%79Bus
- 10.5%122Subway or elevated rail
- 3.2%37Long-distance train or commuter rail
- 1.0%12Light rail, streetcar or trolley
- 0.8%9Taxi
- 5.3%62Bicycle
- 23.5%273Walked
- 3.6%42Other means
- 12.6%146Worked at home

Time leaving home to go to work
![Time leaving home to go to work]()
- 6112:00 a.m. to 4:59 a.m.
- 165:00 a.m. to 5:29 a.m.
- 105:30 a.m. to 5:59 a.m.
- 796:00 a.m. to 6:29 a.m.
- 316:30 a.m. to 6:59 a.m.
- 1167:00 a.m. to 7:29 a.m.
- 707:30 a.m. to 7:59 a.m.
- 1758:00 a.m. to 8:29 a.m.
- 1048:30 a.m. to 8:59 a.m.
- 1169:00 a.m. to 9:59 a.m.
- 5610:00 a.m. to 10:59 a.m.
- 611:00 a.m. to 11:59 a.m.
- 11212:00 p.m. to 3:59 p.m.
- 564:00 p.m. to 11:59 p.m.

Occupations of males:
- Percentage of males in management occupations (except farmers):
Here: 7.5% city: 12.7%
- Percentage of males in business and financial operations occupations:
Here: 7.7% city: 8.9%
- Percentage of males in computer and mathematical occupations:
Here: 12.4% city: 14.7%
- Percentage of males in architecture and engineering occupations:
Here: 3.8% city: 5.8%
- Percentage of males in life, physical, and social science occupations:
Here: 15.4% city: 11.7%
- Percentage of males in education, training, and library occupations:
Here: 6.8% city: 15.8%
- Percentage of males in arts, design, entertainment, sports, and media occupations:
Here: 3.4% city: 3.8%
- Percentage of males in service occupations:
Here: 4.9% city: 5.0%
- Percentage of males in sales and office occupations:
Here: 14.5% city: 7.2%
- Percentage of males in production occupations:
Here: 3.0% city: 1.2%
- Percentage of males in transportation occupations:
Here: 19.0% city: 2.3%
- Percentage of males in material moving occupations:
Here: 1.5% city: 1.0%
Occupations of females:
- Percentage of females in management occupations (except farmers):
Here: 8.7% city: 12.8%
- Percentage of females in business and financial operations occupations:
Here: 4.9% city: 10.9%
- Percentage of females in computer and mathematical occupations:
Here: 2.9% city: 5.9%
- Percentage of females in life, physical, and social science occupations:
Here: 1.6% city: 10.9%
- Percentage of females in community and social services occupations:
Here: 4.9% city: 2.0%
- Percentage of females in legal occupations:
Here: 2.7% city: 2.9%
- Percentage of females in education, training, and library occupations:
Here: 6.7% city: 17.7%
- Percentage of females in arts, design, entertainment, sports, and media occupations:
Here: 2.2% city: 4.9%
- Percentage of females in healthcare practitioners and technical occupations:
Here: 9.0% city: 7.0%
- Percentage of females in service occupations:
Here: 26.7% city: 8.9%
- Percentage of females in sales and office occupations:
Here: 18.8% city: 11.9%
- Percentage of females in production occupations:
Here: 1.3% city: 1.2%
- Percentage of females in transportation occupations:
Here: 8.3% city: 0.4%
- Percentage of females in material moving occupations:
Here: 1.1% city: 0.3%
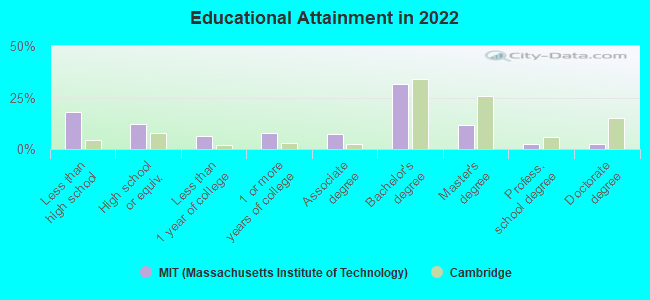
Education in this neighborhood (subdivision or community):
- Percentage of people 3 years and older in K-12 schools:
MIT (Massachusetts Institute of Technology): 17.6% Cambridge: 8.3%
- Percentage of people 3 years and older in undergraduate colleges:
MIT (Massachusetts Institute of Technology): 6.7% Cambridge: 15.4%
- Percentage of people 3 years and older in grad. or professional schools:
MIT (Massachusetts Institute of Technology): 4.8% Cambridge: 12.3%
- Percentage of students K-12 enrolled in private schools:
MIT (Massachusetts Institute of Technology): 7.6% Cambridge: 13.9%
Percentage of population below poverty level:
| MIT (Massachusetts Institute of Technology): | 21.2% |
| Cambridge: | 14.6% |
Median year owner moved in (as recorded in 2022):
Median year renter moved in (as recorded in 2022):
| MIT (Massachusetts Institute of Technology): | 2012 |
| Cambridge: | 2010 |
Median year renter moved in (as recorded in 2022):
| MIT (Massachusetts Institute of Technology): | 2016 |
| Cambridge: | 2022 |
Percentage of married-couple families with both working:
| MIT (Massachusetts Institute of Technology): | 64.9% |
| Cambridge: | 76.5% |
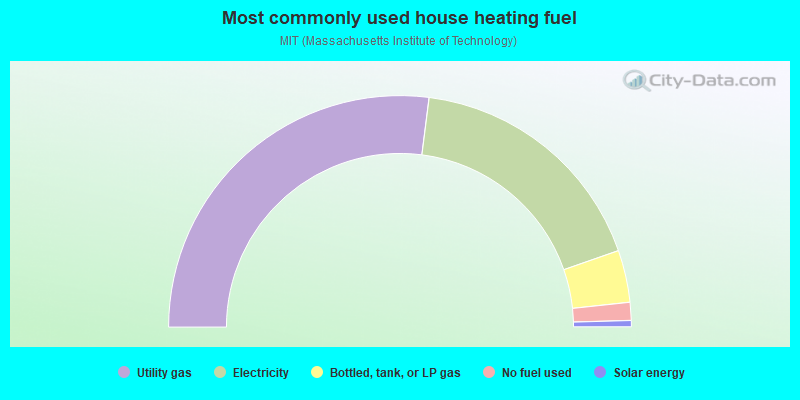
- 54.1%Utility gas
- 35.3%Electricity
- 7.3%Bottled, tank, or LP gas
- 2.5%No fuel used
- 0.9%Solar energy
Highways in this neighborhood:
Memorial Dr (US Hwy 3)
Length: 1.98 miles
Directions: E-W, N-S, SE-NW, SW-NE
Address range: 1 to 17
Directions: E-W, N-S, SE-NW, SW-NE
Address range: 1 to 17
US Hwy 3
Length: 0.48 miles
Directions: E-W, N-S, SW-NE
Directions: E-W, N-S, SW-NE
Massachusetts Ave (State Hwy 2 Alt)
Length: 0.27 miles
Direction: SE-NW
Address range: 1 to 128
Direction: SE-NW
Address range: 1 to 128
Harvard Brg (State Hwy 2 Alt, Massachusetts Avenue Brg, Massachusetts Ave)
Length: 0.22 miles
Direction: SE-NW
Direction: SE-NW
Roads and streets:
Main St
Length: 0.64 miles
Direction: E-W
Address range: 67 to 409
Direction: E-W
Address range: 67 to 409
Ames St
Length: 0.28 miles
Directions: N-S, SE-NW
Address range: 1 to 99
Directions: N-S, SE-NW
Address range: 1 to 99
Amherst St
Length: 0.24 miles
Direction: E-W
Address range: 1 to 99
Direction: E-W
Address range: 1 to 99
Wadsworth St
Length: 0.16 miles
Directions: N-S, SE-NW
Address range: 1 to 99
Directions: N-S, SE-NW
Address range: 1 to 99
Broadway
Length: 0.11 miles
Directions: E-W, SE-NW
Address range: 1 to 8
Directions: E-W, SE-NW
Address range: 1 to 8
Hayward St
Length: 0.11 miles
Direction: N-S
Address range: 1 to 99
Direction: N-S
Address range: 1 to 99
Carleton St
Length: 0.10 miles
Direction: N-S
Address range: 1 to 99
Direction: N-S
Address range: 1 to 99
Deacon St
Length: 0.07 miles
Directions: E-W, N-S
Address range: 1 to 99
Directions: E-W, N-S
Address range: 1 to 99
Mid-Block Con
Length: 0.05 miles
Directions: N-S, SW-NE
Directions: N-S, SW-NE
Dock St
Length: 0.03 miles
Direction: N-S
Address range: 2 to 8
Direction: N-S
Address range: 2 to 8
Highways in this neighborhood:
State Hwy 3
Length: 0.00 miles
Direction: E-W
Direction: E-W