Mace Ranch Business Park neighborhood in Davis, California (CA), 95616 detailed profile
Settings
X


Business Search - 14 Million verified businesses
Area: 0.046 square miles
Population: 326
Population density:
| Mace Ranch Business Park: | 7,089 people per square mile |
| Davis: | 6,415 people per square mile |

- 16149.8%White
- 12639.0%Asian
- 185.6%Two or more races
- 175.3%Hispanic or Latino
- 10.3%Black

Median household income in 2022:
| Mace Ranch Business Park: | $170,417 |
| Davis: | $67,373 |
Distribution of median household income
![Distribution of median household income]()
- 5Less than $10,000
- 9$10,000 to $19,999
- 6$20,000 to $29,999
- 4$30,000 to $39,999
- 4$40,000 to $49,999
- 1$50,000 to $59,999
- 1$60,000 to $74,999
- 2$75,000 to $99,999
- 12$100,000 to $124,999
- 10$125,000 to $149,999
- 14$150,000 to $199,999
- 52$200,000 or more

Distribution of owner-occupied house/condo value
![Distribution of owner-occupied house/condo value]()
- 1$400,000 to $499,999
- 33$500,000 to $749,999
- 19$750,000 to $999,999
- 30$1,000,000 or more

Distribution of rent paid by renters
![Distribution of rent paid by renters]()
- 1$400 to $499
- 2$600 to $699
- 4$700 to $799
- 3$900 to $999
- 1$1,000 to $1,249
- 1$1,250 to $1,499
- 6$1,500 to $1,999
- 20$2,000 or more

Median rent in 2022:
| Mace Ranch Business Park: | $2,301 |
| Davis: | $1,865 |
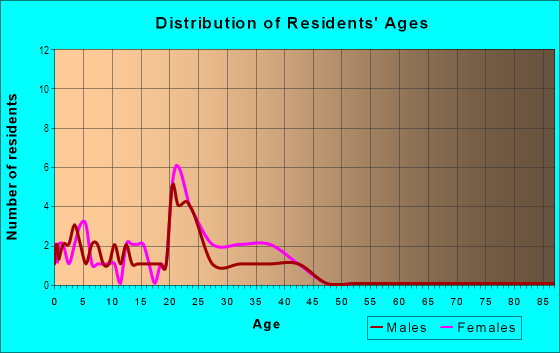
| Males: | 153 |
| Females: | 173 |
Males:
| This neighborhood: | 39.2 years |
| Whole city: | 24.9 years |
| This neighborhood: | 35.1 years |
| Whole city: | 26.5 years |
Average household size:
| Mace Ranch Business Park: | 2.9 people |
| Davis: | 2.5 people |
Percentage of family households:
| Mace Ranch Business Park: | 55.2% |
| Davis: | 31.5% |
| Here: | 59.0% |
| Davis: | 35.7% |
Percentage of married-couple families with children (among all households):
| Mace Ranch Business Park: | 28.3% |
| Davis: | 28.9% |
Percentage of single-mother households (among all households):
| Mace Ranch Business Park: | 1.1% |
| Davis: | 7.2% |
Percentage of never married males 15 years old and over:
Percentage of never married females 15 years old and over:
| Mace Ranch Business Park: | 21.3% |
| Davis: | 25.7% |
Percentage of never married females 15 years old and over:
| Mace Ranch Business Park: | 18.1% |
| city: | 29.9% |
Percentage of people that speak English not well or not at all:
| Mace Ranch Business Park: | 0.7% |
| Davis: | 2.8% |
Percentage of people born in this state:
Percentage of people born in another U.S. state:
Percentage of native residents but born outside the U.S.:
Percentage of foreign born residents:
| Here: | 51.7% |
| Davis: | 59.5% |
Percentage of people born in another U.S. state:
| Mace Ranch Business Park: | 17.5% |
| Davis: | 19.1% |
Percentage of native residents but born outside the U.S.:
| Here: | 1.7% |
| city: | 0.9% |
Percentage of foreign born residents:
| Here: | 29.1% |
| Davis: | 20.5% |

Owner-occupied
Renter-occupied


- Rooms in owner-occupied houses and condos in Mace Ranch Business Park
- 01 room
- 02 rooms
- 33 rooms
- 24 rooms
- 145 rooms
- 106 rooms
- 197 rooms
- 118 rooms
- 179+ rooms

- Rooms in renter-occupied apartments in Mace Ranch Business Park
- 01 room
- 02 rooms
- 53 rooms
- 94 rooms
- 55 rooms
- 86 rooms
- 07 rooms
- 28 rooms
- 09+ rooms
Owner-occupied
Renter-occupied

- Bedrooms in owner-occupied houses and condos in Mace Ranch Business Park
- 0no bedroom
- 01 bedroom
- 82 bedrooms
- 283 bedrooms
- 344 bedrooms
- 85+ bedrooms

- Bedrooms in renter-occupied apartments in Mace Ranch Business Park
- 0no bedroom
- 41 bedroom
- 52 bedrooms
- 183 bedrooms
- 44 bedrooms
- 05+ bedrooms
Average number of cars or other vehicles available in houses/condos:
Average number of cars or other vehicles available in apartments:
| This neighborhood: | 2.2 |
| Davis: | 2.0 |
Average number of cars or other vehicles available in apartments:
| Here: | 2.4 |
| city: | 1.7 |
Percentage of units with a mortgage:
| Mace Ranch Business Park: | 81.3% |
| Davis: | 61.8% |
Housing prices:
- Average estimated value of detached houses in 2022 (79.6% of all units):
Mace Ranch Business Park: $945,473 Davis: $1,006,726
- Average estimated value of townhouses or other attached units in 2022 (5.3% of all units):
This neighborhood: $568,697 city: $537,134

- Year house built in Mace Ranch Business Park
- 02020 or later
- 172010 to 2019
- 252000 to 2009
- 551990 to 1999
- 131980 to 1989
- 01970 to 1979
- 01960 to 1969
- 01950 to 1959
- 01940 to 1949
- 01939 or earlier

City-data.com crime index for city in 2020 (higher means more crime):
| City: | 213.3 |
| U.S. average: | 219.5 |
Travel time to work (commute)
![Travel time to work (commute)]()
- 95 to 9 minutes
- 710 to 14 minutes
- 815 to 19 minutes
- 820 to 24 minutes
- 625 to 29 minutes
- 530 to 34 minutes
- 140 to 44 minutes
- 345 to 59 minutes
- 290 or more minutes

Means of transportation to work
![Means of transportation to work]()
- 61.0%105Drove a car alone
- 2.9%5Carpooled
- 1.7%3Bus
- 1.2%2Long-distance train or commuter rail
- 0.6%1Motorcycle
- 5.2%9Bicycle
- 0.6%1Walked
- 0.6%1Other means
- 24.4%42Worked at home

Time leaving home to go to work
![Time leaving home to go to work]()
- 36:00 a.m. to 6:29 a.m.
- 36:30 a.m. to 6:59 a.m.
- 67:00 a.m. to 7:29 a.m.
- 137:30 a.m. to 7:59 a.m.
- 118:00 a.m. to 8:29 a.m.
- 48:30 a.m. to 8:59 a.m.
- 39:00 a.m. to 9:59 a.m.
- 310:00 a.m. to 10:59 a.m.
- 212:00 p.m. to 3:59 p.m.
- 24:00 p.m. to 11:59 p.m.

Occupations of males:
- Percentage of males in management occupations (except farmers):
Here: 15.7% city: 9.8%
- Percentage of males in business and financial operations occupations:
Here: 9.0% city: 5.9%
- Percentage of males in computer and mathematical occupations:
Here: 4.2% city: 5.6%
- Percentage of males in architecture and engineering occupations:
Here: 10.7% city: 5.7%
- Percentage of males in life, physical, and social science occupations:
Here: 12.6% city: 7.8%
- Percentage of males in legal occupations:
Here: 1.7% city: 2.7%
- Percentage of males in education, training, and library occupations:
Here: 11.4% city: 18.9%
- Percentage of males in arts, design, entertainment, sports, and media occupations:
Here: 1.8% city: 2.1%
- Percentage of males in healthcare practitioners and technical occupations:
Here: 6.9% city: 4.7%
- Percentage of males in service occupations:
Here: 11.0% city: 11.9%
- Percentage of males in sales and office occupations:
Here: 6.9% city: 10.8%
- Percentage of males in production occupations:
Here: 3.9% city: 2.8%
- Percentage of males in material moving occupations:
Here: 2.6% city: 2.0%
Occupations of females:
- Percentage of females in management occupations (except farmers):
Here: 12.8% city: 7.9%
- Percentage of females in business and financial operations occupations:
Here: 4.3% city: 5.0%
- Percentage of females in computer and mathematical occupations:
Here: 4.3% city: 2.0%
- Percentage of females in architecture and engineering occupations:
Here: 2.0% city: 1.1%
- Percentage of females in life, physical, and social science occupations:
Here: 12.0% city: 8.9%
- Percentage of females in community and social services occupations:
Here: 3.7% city: 2.7%
- Percentage of females in education, training, and library occupations:
Here: 18.3% city: 19.0%
- Percentage of females in arts, design, entertainment, sports, and media occupations:
Here: 1.3% city: 2.9%
- Percentage of females in healthcare practitioners and technical occupations:
Here: 14.6% city: 9.1%
- Percentage of females in service occupations:
Here: 11.8% city: 18.1%
- Percentage of females in sales and office occupations:
Here: 11.6% city: 16.0%
- Percentage of females in production occupations:
Here: 1.8% city: 1.7%
- Percentage of females in material moving occupations:
Here: 1.5% city: 0.8%
Percentage of people 16-64 in Armed Forces:
| Mace Ranch Business Park: | 0.3% |
| Davis: | 0.2% |
Education in this neighborhood (subdivision or community):
- Percentage of people 3 years and older in K-12 schools:
Mace Ranch Business Park: 14.8% Davis: 10.0%
- Percentage of people 3 years and older in undergraduate colleges:
Mace Ranch Business Park: 16.0% Davis: 24.3%
- Percentage of people 3 years and older in grad. or professional schools:
Mace Ranch Business Park: 6.0% Davis: 8.2%
- Percentage of students K-12 enrolled in private schools:
Mace Ranch Business Park: 2.1% Davis: 11.2%
Percentage of population below poverty level:
| Mace Ranch Business Park: | 10.4% |
| Davis: | 27.0% |
Median year owner moved in (as recorded in 2022):
Median year renter moved in (as recorded in 2022):
| Mace Ranch Business Park: | 2007 |
| Davis: | 2009 |
Median year renter moved in (as recorded in 2022):
| Mace Ranch Business Park: | 2020 |
| Davis: | 2022 |
Percentage of married-couple families with both working:
| Mace Ranch Business Park: | 79.8% |
| Davis: | 71.8% |

- 69.9%Utility gas
- 23.2%Electricity
- 5.3%Bottled, tank, or LP gas
- 1.6%Solar energy